Thesis Report: A Study on Non-Performing Loan: From the Perspective of the Banking Industry in Bangladesh
•
1 like•215 views

Thesis Report: A Study on Non-Performing Loan: From the Perspective of the Banking Industry in Bangladesh.

Recommended
Recommended
More Related Content
What's hot
What's hot (20)
Similar to Thesis Report: A Study on Non-Performing Loan: From the Perspective of the Banking Industry in Bangladesh
Similar to Thesis Report: A Study on Non-Performing Loan: From the Perspective of the Banking Industry in Bangladesh (20)
Recently uploaded
Recently uploaded (20)
Thesis Report: A Study on Non-Performing Loan: From the Perspective of the Banking Industry in Bangladesh
- 1. A Study on Non-Performing Loan: From the Perspective of the Banking Industry in Bangladesh 1 | P a g e Chittagong Independent University Contents PART I 1.0: INTRODUCTION..........................................................................................................................6 1.1: OBJECTIVE OF THE STUDY ..................................................................................................6 1.2: Methodology of Study...............................................................................................................6 1.3: Limitations of the study ...........................................................................................................7 PART II 2.0: Review of Related Literature...................................................................................................9 PART III OVERVIEW OF NPL .....................................................................................................................16 3.0: Non-Performing Loan (NPL)..................................................................................................17 3.1: Classifications of Loans.........................................................................................................17 3.1.1: Unclassified Loans...............................................................................................................17 3.1.2: Classified Loans ...................................................................................................................18 3.2: Provisions against NPL..........................................................................................................20 3.2.1 General Provision.................................................................................................................20 3.2.2 Specific Provisions...............................................................................................................21 3.3: Write off .......................................................................................................................................22 3.4: Symptoms of NPL ......................................................................................................................23 3.5: Causes & Effects of NPL........................................................................................................24 3.6: Adverse effects of Non-Performing Loan in Bangladesh .............................................26 3.7: Monitoring of NPL......................................................................................................................28 PART IV ANALYSIS ON NON-PERFORMING LOANS IN THE BANKING SECTORS OF BANGLADESH................................................................................................................................29 4.0: Banking Sector Performance................................................................................................30 4.1: Aggregate Balance Sheet ......................................................................................................35 4.2: Capital Adequacy.....................................................................................................................37 4.3: Asset Quality.............................................................................................................................38 4.4: Overall NPL Scenario of Bangladesh .................................................................................39 4.4.1: Gross NPLs to Total Loans byType of Banks.................................................................39 4.4.2: Ratio of Net NPL to Total Loans by Type of Banks..........................................................40 4.4.3: Amount of NPLs by Type of Banks ..................................................................................41 4.4.4: Gross NPLs to Total Loans by Six State Owned Banks ...............................................42
- 2. A Study on Non-Performing Loan: From the Perspective of the Banking Industry in Bangladesh 2 | P a g e Chittagong Independent University 4.4.5: Required Provision and Provision Maintained by the Banking Industry .....................44 4.4.6: Comparative Position of Provision Adequacy by Types of Banks...............................45 4.4.7: Writing-off Bad Debts by Types of Bank..........................................................................46 4.4.8: Geographical NPL Distribution..........................................................................................47 4.4.9: The sector-wise NPL distributions....................................................................................48 4.5: Consequences of NPL on Banks' Profitability and Financial Stability......................52 4.5.1: Consequences of NPL on banks' profitability .................................................................53 4.5.2: Consequences of NPL on financial stability....................................................................53 4.6: Non-performing Loans in the South Asian countries ....................................................54 PART V FINDINGS, RECOMMENDATION & CONCLUSION ........................................................57 5.0: Findings......................................................................................................................................58 6.0: Recommendations...................................................................................................................60 7.0: Conclusion.................................................................................................................................61 8.0: References:................................................................................................................................63
- 3. A Study on Non-Performing Loan: From the Perspective of the Banking Industry in Bangladesh 3 | P a g e Chittagong Independent University List of Table Table 3.1: Rate of General provisions 20 Table 3.2: Rate of Specific provisions 21 Table 3.3: Rate of provisions 22 Table 4.1: Banking Structure And Activities 30 Table 4.2: Capital to Risk Weighted Assets Ratio by Type of Banks 37 Table 4.3: Gross NPLs to Total Loans by Type of Banks 39 Table 4.4: Ratio of Net NPL to Total Loans by Type of Banks 40 Table 4.5: Amount of NPLs by Type of Banks 41 Table 4.6: Gross NPLs to Total Loans 42 Table 4.7 : Required Provision and Provision Maintained by the Banking Industry 44 Table 4.8 : Comparative Position of Provision Adequacy by Types of Banks 44 Table 4.9: Writing-off Bad Debts by Types of Bank 46 Table 4.10: Geographical NPL Distribution of 2018 47 TABLE 4.11 : SECTOR-WISE NONPERFORMING LOANS DISTRIBUTION (2018) 48 TABLE 4.12: SECTOR-WISE NONPERFORMING LOANS DISTRIBUTION (2013-218) 50 Table 4.13: NPL on Banks' Profitability and Financial Stability 51 Table 4.14: The position of NPLs in South Asia 54
- 4. A Study on Non-Performing Loan: From the Perspective of the Banking Industry in Bangladesh 4 | P a g e Chittagong Independent University List of Graph Graph 4.2: Capital to Risk Weighted Assets Ratio by Type of Banks 38 Graph 4.3: Gross NPLs to Total Loans by Type of Banks 39 Graph 4.4: Ratio of Net NPL to Total Loans by Type of Banks 41 Graph 4.5: Amount of NPLs by Type of Banks 42 Graph 4.6: Gross NPLs to Total Loans 43 Graph 4.9: Writing-off Bad Debts by Types of Bank 46 Graph 4.13: NPL on Banks' Profitability and Financial Stability 52 Graph 4.14: The position of NPLs in South Asia 56
- 5. A Study on Non-Performing Loan: From the Perspective of the Banking Industry in Bangladesh 5 | P a g e Chittagong Independent University PART I INTRODUCTION
- 6. A Study on Non-Performing Loan: From the Perspective of the Banking Industry in Bangladesh 6 | P a g e Chittagong Independent University 1.0: INTRODUCTION The smooth and adequate flow of the saving-investment process is a requirement for the economic development of a country. Bangladesh, being a developing country and with an undeveloped capital market, largely depends on the intermediary role of commercial banks for mobilizing domestic saving and giving funds to the investor. Thus, it matters greatly how well our financial sector is performing. Studying the performance of our financial sector for the last decade or so, we see that our banking division is profoundly troubled with a high portion of non-performing loans (NPLs). It is obvious that NPLs decrease banks’ profitability, as banks cannot secure interest income from their classified loans. NPLs reduce loanable funds by ending recycling. Banks require to set aside a portion of their income as loan loss reserves to make up bad debt. A bank with a high percentage of NPLs suffers from erosion of the money if there is no provision (assume). All those adverse impacts of NPLs on banks’ financial health such as low profitability and low capital base are clearly shown in the Bangladesh banking sector. The ratio of NPL to entire loans of all the banks 9.3 percent in June 2017. The ratio further rose to 10.4 percent at the end of June 2018. 1.1: OBJECTIVE OF THE STUDY The objectives of this paper are I. To assess the present situation of non-performing loans in our banking sector. II. To show the scenarios of the “loan default problem’’ in Bangladesh. III. To find out the effect of NPL on bank’s profitability and Financial Stability IV. To identify the causes and effects of non-performing loans. V. To show a comparative analysis of NLP in south Asian Countries VI. To raise some issues and observations which need to be looked upon quickly for ensuring a financially sound banking sector. 1.2: Methodology of Study To perform the objective of report I have collected secondary data from published sources. The secondary sources of data and information are:
- 7. A Study on Non-Performing Loan: From the Perspective of the Banking Industry in Bangladesh 7 | P a g e Chittagong Independent University Sources of Data and Data Collection Data has been collected from the various secondary sources like research works of individuals, different publications, journal of different institutions, Bangladesh Bank Credit Risk Grading manual , Bangladesh Bank annual report etc. 1.3: Limitations of the study The limitations of the study are Lack of previous experience. This study did not cover primary and unpublished data. Time constraint.
- 8. A Study on Non-Performing Loan: From the Perspective of the Banking Industry in Bangladesh 8 | P a g e Chittagong Independent University PART II LITERATURE REVIEW
- 9. A Study on Non-Performing Loan: From the Perspective of the Banking Industry in Bangladesh 9 | P a g e Chittagong Independent University 2.0: Review of Related Literature NPL is an important topic regarding banking industry so there are lots of studies on this topic so it is necessary to understand the conclusions of the studies that have already been performed by different authors before performing the same study as the previous studies may help to understand the topic more effectively. It arises from various sources. Banks should identify them and take the necessary steps to eliminate the NPL from the industry. However empirical studies show that there is an adverse effect of NPL on the profitability of banks in all over the world. Following are some quotes from the article related to NPL. A study conducted by Ekanayake and Azeez (2015) based on Sri Lankan banking industry showed that non-performing loans increases when the efficiency of a bank worsen. In the study of Zelalem (2013), which was conducted on the Ethiopian commercial banks ROA was used as a proxy for financial performance in other words performance efficiency. In that study the relationship between NPL and loan to assets ratio of a bank was all examined and the relationship was shown as negative. Another study related to NPL conducted by Louzis (2012), showed that the amount of NPLs in Greek banking industry is significantly influenced by both the management quality of the banks and the macroeconomic forces of the country. Same conclusion was also drawn by Mehmood (2013) and his study was performed based on 13 commercial banks of Pakistan and he chose time period from 2003 to 2012 for conducting his study. According to the study of Eurak (2013) which was based on the banking system of South Europe it was concluded that high interest rate, economic downturn and high inflation rate are the main reasons of higher non-performing loans in an economy and the study was also conducted based on 69 banks from ten different countries. Other factors that influence the credit risk of a bank are the size, performance and solvency of the bank as these factors are influential to the non-performing loans of the bank. Wangai et al. (2014) have examined the effect of non-performing loans on financial performance of microfinance banks (MFBs) in Kenya. A structured questionnaire was used to collect data from the respondents. The authors assert that credit risk significantly negatively affected financial performance of MFBs in Nakuru town. They
- 10. A Study on Non-Performing Loan: From the Perspective of the Banking Industry in Bangladesh 10 | P a g e Chittagong Independent University have concluded that increase in credit risk would significantly reduce the MFBs’ financial performance. Adebisi and Matthew (2015) have examined the impact of nonperforming loans on firms’ profitability of banks in Nigeria. The secondary data obtained from the Annual Report and Statement of Accounts of the NDIC for a period of seven (7) years (2006- 2012) were analyzed using the regression model. The authors have found significant negative relationship between the Nonperforming Loans (NPI) and Return on Assets (ROA); however, they found a positive but insignificant relationship between the Nonperforming Loan (NPI) and Return on Equity (ROE) of Nigerian Banks. Somoye (2010) explored the variations of credit risk of NPIs on bank performances in Nigeria. The study reviewed performances of banks of Nigeria using banking variables such as total assets, total loans, non-performing loans, equity capital and profit-before tax etc. Karim et al. (2010) in their study shows the relationship between NPL and bank efficiency in Malaysia and Singapore by using the Tobit regression model during the period of 1998-2007. The outcome stated that higher NPL reduces cost efficiency and also the lower cost efficiency increases NPL and profitability. The cost efficiency estimation results indicate an average cost efficiency score of 87.68% for the full sample. This suggests that banks are wasting 12.32% of their inputs. The results also indicate that there is no significant differences in the cost efficiency level between commercial banks in Singapore and Malaysia even though the commercial banks in Singapore exhibit a higher average cost efficiency score than the commercial banks in Malaysia. The Tobit regression results clearly indicate that higher non-performing loan reduces cost efficiency. Likewise, lower cost efficiency increases non-performing loans. The results are consistent with the studies by Altunbas et al. (2000), Fan and Shaffer (2004), and Girard one et al. (2004) that found that non-performing loans lead to inefficiency in the banking sector. In addition, the results also support the hypothesis of bad management proposed by Berger and DE Young (1997), which suggests that poor management in the banking institutions results in bad quality loans, and therefore, escalates the level of non-performing loans.
- 11. A Study on Non-Performing Loan: From the Perspective of the Banking Industry in Bangladesh 11 | P a g e Chittagong Independent University Podder (2012) found NPL, Advance/Deposit ratio, Total Asset, Equity/Total Asset ratio as some prominent determinants of profitability of banks during the period 2001-2010 observed on 30 PCBs in Bangladesh. Beck, Jakubik and Piloiu (2013) studied the macroeconomic determinants of non- performing loans (NPLs) across 75 countries during the past decade. According to our dynamic panel estimates, the following variables are found to significantly affect NPL ratios: real GDP growth, share prices, the exchange rate, and the lending interest rate. In the case of exchange rates, the direction of the effect depends on the extent of foreign exchange lending to unhedged borrowers which is particularly high in countries with pegged or managed exchange rates. In the case of share prices, the impact is found to be larger in countries which have a large stock market relative to GDP. These results are robust to alternative econometric specifications. Haneef et al (2011) investigated the impact of risk management on non- performing loan and profitability of banking sector of Pakistan with secondary data. The result of this study reveals that there is no proper mechanism for risk management in banking sector of Pakistan. Study also concluded that non-performing loans are increasing due to lack of risk management which threatens the profitability of banks. This study provides suggestion that banking sector can avoid their nonperforming loans by adopting methods suggested by state bank of Pakistan. Philippos Papadopoulos and Xiayan (Jason) Wang (2016) developed a conceptual framework for risk capital calculation for portfolios of non-performing loans. In general banking practice, loans that pass a threshold of delinquency are declared non-performing and are provisioned. Yet there is a residual risk that the provisioning is not sufficient. This risk must be covered by capital buyers. Their framework builds on tools used in portfolio credit risk modeling and provides a structured approach to address the risk pro1le that is speci1c to non-performing loans. Rahman (2011) found that the banks in Bangladesh have started undertaking a number of quantitative and qualitative measures to understand the risks involved in credit or chance of default which may come from the failure of counterparty or obligor (client) to fulfill his/her commitments as per agreed terms and contractual agreement with the bank. Traditionally, a bank gives emphasis on collateral in funding to the clients whereas in the concept of modern banking a bank
- 12. A Study on Non-Performing Loan: From the Perspective of the Banking Industry in Bangladesh 12 | P a g e Chittagong Independent University keenly feels to measure the business risk over the security risk for ensuring the timely repayment of invested funds. Majumder (2014) attempted to find cause and effect behind the NPLs in Bangladesh. He explained that, the first reason is entrepreneur‘s related and Second reason is business related. Effects of NPL are such as Stopping Money Cycling, Earning Reduction, Capital Erosion, Increase in Loan Pricing, Frustration etc. As a result, the values of security are increased and the risks of financial recession also see a rise. Lata (2015) attempted to find out the time series scenario of NPLs, its growth, provisions and relation with banks profitability by using some ratios and a linear regression model of econometric technique. The empirical results represent that NPL as percentage of total loans of SCBs is very high and they holds more than 50 % of total NPLs of the banking industry from FY2006 to FY2013. Moreover, it is one of the major factors of influencing banks profitability and it has statistically significant negative impact on Net Interest Income of SCBs for the study periods. Bhattarai (2016) examined the effect of non-performing loan on the profitability of Nepalese commercial banks using pooled data of fourteen commercial banks with 77 observations during the period of 2010 to 2015. The study concludes that profitability of Nepalese commercial is influenced negatively by non-performing loan ratio and positively by the other covariates like as bank size, cost per loan assets and gross domestic product growth rate. Rajan and Dhal (2003) have examined the Nonperforming Loans and Terms of Credit of state owned banks in India. They found that favorable macroeconomic conditions and financial factors such as banks size, cost of credit, credit maturity, and credit orientation have significant impact on the nonperforming loans of Indian commercial banks. Shrestha (2011) has analyzed trend of NPIs and the effect of NPI on share price of the18 sampled commercial banks of Nepal using the descriptive statistics, trend and one factor econometric model. The stratified sampling method was used in selecting the banks for the study. The author assets that NPI of commercial banks is in decreasing trend, however, the total performing loan to total deposit ratio in the industry is an increasing trend during study period. The author further concludes that the real stock price of the commercial banks has a negative association with the levels of their NPIs.
- 13. A Study on Non-Performing Loan: From the Perspective of the Banking Industry in Bangladesh 13 | P a g e Chittagong Independent University Lata (2015) has analyzed time series data and concluded that NPL is one of the foremost factors that influence banks profitability and it has a considerable negative impact on Net Interest Income of State-owned Commercial Banks in Bangladesh. Nonperforming loans in Bangladesh has become a problem that has significant negative impact on bank profitability. He posits that nonperforming loans is a topic of great concern in Bangladesh. He states that for the last eight years, loan default as a percentage of outstanding loans in state owned commercial banks were 50 percent or above where private commercial banks and foreign commercial banks hold maximum 5 – 10 percent of the total. Nsobilla (2015) has investigated the effect of NPL on financial performance. Secondary data was collected from six selected rural Banks of Ghana for the period of 2004-2013. Applying OLS model, it discovers that the NPL, cost-income ratio, loan recovered and total revenue variables are found statistically significant on ROA. Kiran and Jones (2016) have discovered the effect of NPL on the profitability of banks. The study confirms that except for SBI all other banks show a negative connection between their gross NPL and net income. Akter and Roy (2017) found the negative impact of NPL on profitability (Net Interest Margin). Moreover, Net Profit Margin found also negatively influenced by the NPL as well while considering 30 banks data of Bangladesh for the year 2008 to 2013. As lending is the most profitable investment for commercial banks, non-performing loan has effect on profitability of the commercial banks. In this study, we tried to show the impact of non-performing loan on banks profitability. It’s time to work with non- performing loan as the funds that are given to the borrowers as loans must be safe and are recovered and when due. Banks do business with depositor’s money, if banks can’t get depositors fund when they want, there might be a vulnerable situation in the industry. Public may lose confidence from the bank, which may create run on the bank. As a result profitability of the bank can be negatively affected. Balango and Rao (2017) showed that there is a significant relationship between performance (in terms of profitability) and the amount of non-performing loans (in terms of loan performance and capital adequacy) where non-performing loans have
- 14. A Study on Non-Performing Loan: From the Perspective of the Banking Industry in Bangladesh 14 | P a g e Chittagong Independent University significantly negative impact whereas capital adequacy ratio has positive and relatively insignificant impact on return on asset (ROA). Matin (2017) In His study the main purpose of overseeing the financial soundness indicators and identifying the potential bank specific and macroeconomic determinants of bank profitability in commercial banks in Bangladesh. Considering the trend of the industry level annual data on banking assets to GDP ratio, Capital to Risk assets ratio, non-performing loans, return on assets, return on equity and net interest margin for the period 2000-2015, one would be satisfied with the performance of the commercial banks in Bangladesh. Amongst them the Assets to GDP ratio, CRAR, ROA and NIM showed upward trend, while non-performing loans and ROE are on the decrease, although ROE experienced a wide range of fluctuations during the period under consideration. The financial soundness indicators compares well with those from countries like India, Pakistan, Sri Lanka, China, Indonesia, Thailand and Vietnam. In the multiple regression analysis on panel data of 47 banks for the period 2010- 15, it appeared that all the bank specific variables included in the models exerted significant influence on the three measures of profitability used in the study – ROA, ROE and NIM. But their effect on the profitability had wide range of variation across different measures. The Feasible Generalized Least Squares regression model for panel data has been applied to estimate the effect of the explanatory variables.. The results indicated that nonperforming loans, loan loss provisions, bank size, cost efficiency and liquidity had significant negative effect on ROA, while non-traditional activities measured by non-interest income and off balance sheet activities had significant positive effect on ROA. In the model for ROE, loan loss provision and cost efficiency had significant negative effect. The equity capital, loan loss provision, non-interest income, cost efficiency and liquidity had significant positive effect on NIM, while bank size and off balance sheet activities had significant negative effect on NIM. The macroeconomic variables- rate of growth of real GDP and annual inflation rate did not exhibit any influence on bank profitability. Islam & Rana ( 2017) in their study considering data period 2005-10 and using panel data regression model found NPL and operating expenses have a significant effect on ROA. Results also have shown that elevated NPL may lead to less profit due to the provision of classified loans.
- 15. A Study on Non-Performing Loan: From the Perspective of the Banking Industry in Bangladesh 15 | P a g e Chittagong Independent University Kingu et al. (2018) in their study examined the impact of NPL on bank’s profitability using information asymmetry theory and bad management hypothesis. The study establishes that occurrence of NPL is negatively related to the level of profitability in commercial banks of Tanzania. The study found that an increase in non-performing loans is associated with a decrease in ROA. These results support information asymmetry theory and bad management hypothesis, which argue, increased exposure to credit risk measured by NPLs is normally associated with an increase in operating costs and lead to decreased profitability.
- 16. A Study on Non-Performing Loan: From the Perspective of the Banking Industry in Bangladesh 16 | P a g e Chittagong Independent University PART III OVERVIEW OF NPL
- 17. A Study on Non-Performing Loan: From the Perspective of the Banking Industry in Bangladesh 17 | P a g e Chittagong Independent University 3.0: Non-Performing Loan (NPL) Non-Performing loan is a loan which the borrower has missed to pay its scheduled interest payment or payment of the principle amount, generally for at least 90 days. A nonperforming loan has much higher risk to default than a normal loan. If the borrowers start to repay again on their non-performing loan, the loan then becomes performing loan or regular loan; even if they hadn’t repaid the entire missed payment amount. The timeframe of a loan becoming a non-performing loan depends on the category of the loan and also might depend on contract. Generally until 90 days from the scheduled payment day, a loan is considered as a regular loan. If the borrower miss the scheduled payment and pays that amount within 90 days, the loan will not consider as non-performing. Therefore, a loan will become nonperforming if- 1. The borrower missed the scheduled payment and at least 90 days has past from the missed scheduled payment. 2. No mention of any other terms or of day limits from the first missed payment date about the loan being non-performing. 3. If mentioned in loan contract, the loan will become non-performing according to the contract agreement. 3.1: Classifications of Loans Based on characteristics all loans can be primarily classified into 2 groups- unclassified and classified loans. These 2 groups total includes 5 different types of loans, which are- 1. Standard Loan (STD) 2. Special Mention Account (SMA) 3. Sub-standard (SS) 4. Doubtful (DF) 5. Bad/Loss (B/L) 3.1.1: Unclassified Loans I. Standard Loan (STD): Loans which are repaid according to their schedules are standard loans. These are unclassified loans.
- 18. A Study on Non-Performing Loan: From the Perspective of the Banking Industry in Bangladesh 18 | P a g e Chittagong Independent University II. Special Mention Account (SMA): When the borrower missed the first scheduled payment and paid it within 90 days of the scheduled date those are listed as Special Mention Account (SMA). There are some certain rules for a loan to be listed in SMA- 1. Regular loan: If any loan was not paid within its expiree date. 2. Continuous and Demand loan: If the loan payment was missed and was not paid up to 1 month. 3. Term Loan: For monthly installment, from 2 up to 3 installments miss (not need to be consecutive) will be listed as SMA. Standard loan and Special Mention Loan (SMA) represents the performing loan or unclassified loan. Interests from these 2 loans are added to bank income. 3.1.2: Classified Loans I. Sub-standard (SS): Sub-standard loans are the first stage of a loan being nonperforming or classified loan. Loans are categorized as sub-standard when- 1. Continuous Loan: it exits 3 months after expiree date. The time limit of a continuous loan to be sub-standard loan is from 3 months to up to 6 months. 2. Demand Loan: it exits 3 months after expiree date. The time limit of a demand loan to be sub-standard loan is from 3 months to up to 6 months. 3. Term Loan: Up to TK 10 lac monthly installment- from 6 months to up to 9 months (from 6 up to 9 missed installments). Up to TK 10 lac quarterly installment- first missed schedule of the installment Above TK 10 lac monthly installment- from 3 months to up to 6 months(from 3 up to 6 missed installments). Above TK 10 lac quarterly installment- first missed schedule of the installment. 4. Short Term Agricultural Credit/ Micro Credit: after a period of 12 months from the scheduled due date as per the loan agreement.
- 19. A Study on Non-Performing Loan: From the Perspective of the Banking Industry in Bangladesh 19 | P a g e Chittagong Independent University The interest charged in sub-standard loans are transferred in separate account head called ‘Suspense Account’. These interest amounts are not added with the bank income until and unless the accounts are being regularized. II. Doubtful (DF): This is the second stage of non-performing loan. Loans are listed as doubtful when- 1) Continuous Loan: If it exits past 6 months or beyond but less than 9 months from its scheduled payment date. 2) Demand Loan: If it exits past 6 months or beyond but less than 9 months from the date of expiry or claim by the bank or from the date of creation of demand loan. 3) Term Loan: Below TK. 10 lac monthly installment payment- from 9 month to up to 12 months. Above TK 10 lac monthly installment payment- from 6 months to up to 9 months. 4) Short Term Agricultural Credit/ Micro Credit: After 36 months from the scheduled due date as per the loan agreement. For doubtful loans the interest is charged as per contract but the interests don’t include with bank’s income. These interests are includes in the suspense account. III. Bad/Loss (B/L): This is the worst case of a non-performing loan. These types of loans have the highest possibility of being bad debts. Loans are listed as bad/loss when- 1) Continuous Loan: It exits 9 months or beyond from the scheduled payment time. 2) Demand Loan: It exits 9 months or beyond from the date of expiry or claim by the bank or from the date of creation of the demand loan 3) Term Loan: Below TK. 10 lac monthly installment payment- over 12 months from the missed scheduled payment.
- 20. A Study on Non-Performing Loan: From the Perspective of the Banking Industry in Bangladesh 20 | P a g e Chittagong Independent University Above TK. 10 lac monthly Installment payment- over 9 months from the missed scheduled payment. 4) Short Term Agricultural Credit/ Micro Credit: After 60 months from the scheduled due date as per the loan agreement. No interests are charged on bad/loss categorized loans. 3.2: Provisions against NPL Bank generally set aside a particular amount of money for the loan losses. This amount is determined by the classifications or the commodities on which the loans are been taken. There are 2 types of loan loss provisions- i. General Provision ii. Specific Provision 3.2.1 General Provision General provisions are balance sheet items representing funds set aside by a company as assets to pay for anticipated future losses. For banks, a general provision is considered to be supplementary capital under the first Basel Accord. General provisions on the balance sheets of financial firms are considered to be a higher risk asset, because it is implicitly assumed that the underlying funds will be in default in the future. In the business world, future losses are inevitable, whether it be for the falling resale value of an asset, malfunctioning products, lawsuits or a customer that can no longer pay what it owes. To account for these risks, companies must ensure they have enough money set aside. Banks maintain general provisions in following ways- Table 3.1: Rate of General provisions Subjects Rate 1. All unclassified SME loans 0.25% 2. All unclassified loans 1% 3. Unclassified consumer financing 5%
- 21. A Study on Non-Performing Loan: From the Perspective of the Banking Industry in Bangladesh 21 | P a g e Chittagong Independent University 4. Unclassified Housing Finance and Professional Loans to set up business under Consumer Financing Scheme 2% 5. Unclassified Loans to Brokerage House, Merchant Banks, Stock dealers 2% 6. Outstanding amount of loans kept in the Special Mention Account(SMA) 5% 7. Off-balance sheet exposures 1% 3.2.2 Specific Provisions Specific provisions are created when specific future losses are identified. Receivables may be logged as such if a certain customer faces serious financial problems or has a trade dispute with the entity. The balances may be noted by examining an aged receivable analysis detailing the time elapsed since creating the document. Long-outstanding balances may be included in the specific provision for doubtful debts. However, specific provisions may not be created for the entire amount of the doubtful receivable. For example, if there is a 50 percent chance of recovering a doubtful debt for a certain receivable, a specific provision of 50 percent may be required. For banks, generic provisions are allocated at the time a loan is approved, while specific provisions are created to cover loan defaults. Table 3.2: Rate of Specific provisions Subject Rate 1. Sub-standard 20% 2. Doubtful 50% 3. Bad/Loss 100% 4. All credits except Bad/Loss for Agricultural and Micro Credit 5% 5. For Bad/Loss in Agricultural and Micro Credit 100%
- 22. A Study on Non-Performing Loan: From the Perspective of the Banking Industry in Bangladesh 22 | P a g e Chittagong Independent University According to (Banking Regulation & Policy Department) BRPD-14 the rate of provisions are- Rate of Provision: Table 3.3: Rate of provisions Particulars Short Term Agri. Loan Consumer Financing SMEF Loans to BHs/MBs /SDs All Other Credit sOther than HF,LP HF LP Un- Classifi ed STD 5% 5% 2% 2% 0.25% 2% 1% SMA - 5% 5% 5% 5% 5% 5% Classifi ed SS 5% 20% 20% 20% 20% 20% 20 % DF 5% 50% 50% 50% 50% 50% 50 % B/L 100% 100 % 100% 100% 100% 100% 100 % 3.3: Write off Write off means omitting the bad debts from the balance sheet with 100% provision; list it in off-balance sheet items and maintaining a manual register for the loan to monitor its further status. If the loan amount is up to TK 50,000 it can be directly write off to off-balance sheet items and follow the normal procedure but if the amount is above TK 50,000 bank will place a case against the defaulter and then start the write off procedure. For all write off loans there should be 100% provision kept
- 23. A Study on Non-Performing Loan: From the Perspective of the Banking Industry in Bangladesh 23 | P a g e Chittagong Independent University before the loan has been omitted and placed in off-balance sheet items. The oldest bad debts get the priority to list as write off. A manual register should be maintained to follow up the write off loans and to calculate interest on the loan amount. The interest is 12% on the unrecovered loan amount for above TK 50,000 loans. For up to TK 50,000 loans interest rate is on the percentage the loan has been taken from bank. If the bad debt recovers, the full amount goes to income as 100% provision has already been secured for the loan amount. 3.4: Symptoms of NPL There are some common signs from it can be determined beforehand if a loan is going to be non-performing or not. Here are some of the symptoms that might help to identify a non- performing loan before hand- Warning Signs from Borrowers- Banks always stays in contact with the loan borrowers. When the borrower misses his/her first scheduled payment bank call the borrowers to let him/her know the situation and to know why s/he missed the scheduled payment. If the borrower don’t receive the calls or don’t co-operate with the bank this might be a sign of that loan being non-performing. Warning Signs from Third Parties- Banks sometimes collect information about the borrowers from third parties. If the borrower is a company then the bank collects information from the competitors of them from the same industry. If the borrower is an individual person bank might collect information from the introducer of that person. Warning Sign from Other Banks- Every bank collects a CIB report of their clients who interested to take loan holders from Bangladesh Bank. If the bank wants it can check the CIB report of the clients they want to sanction loan. If the client had taken any loan before from
- 24. A Study on Non-Performing Loan: From the Perspective of the Banking Industry in Bangladesh 24 | P a g e Chittagong Independent University other banks, his/her CIB report can be checked if there’s any bad scheduling (SS,DF,B/L) of his/her previous loan. If the report is good, the bank might sanction loan to that person/ company. 3.5: Causes of NPL The non-performing loan has become the main concern for the banking industry in recent time. Many economist and analyst found that the main reason behind recent bank failure, continuous loss of SCBs and banking scams all arises from the adverse impact of NPL. In order to find the solution to the problem the study discover some of the root causes of NPL in the banking industry which are discussed below: Corruption: One of the major reasons behind increasing the NPL in the banking industry is the involvement of the corrupted person in sanctioning and disbursing loans. If we recall the case of the BASIC bank, it turns into a bad bank through the corruption of top management. Lack of Monitoring: Sometimes performing loan becomes defaulted due to lack of monitoring. If the monitoring system was good, and proper action was taken from the beginning period when the bank comes to know about the loan to be defaulted, the NPL amount wouldn’t be as large as it is now. Borrower Selection: A loan is considered as a bad loan from the beginning if it is provided to the wrong borrower without correctly evaluating their information. There are many borrowers who take the loan from banks by using false documents. Political Influences: It works in two ways- Firstly, while bank is sanctioning the loans and secondly interfering when the bank takes steps against the bad loan. Lengthy Recovery Procedure: If the recovery procedure through releasing collateral becomes difficult and legal process consume more time then banks have no choice but to keep the NPL forcefully in the loan portfolio.
- 25. A Study on Non-Performing Loan: From the Perspective of the Banking Industry in Bangladesh 25 | P a g e Chittagong Independent University Repetition of Rescheduling: Rescheduling of loans is not the ultimate solution of NPL problem. It rather increases NPL when the bank applies it repeatedly for the no deserving loan which ultimately encourages the default culture. Lending above the Exposure Limit: Crossing lending exposure above the prescribed limit by BB to a single borrower create huge NPL as the client become defaulter thus ruin the loan portfolio as well. Recapitalization Facility: When any state-owned bank faces financial difficulties and capital shortage, government help them through injecting capital from taxpayer’s money. These practices de-motivated the govt. banks to earn money on their own as they think govt. will always be there for them supporting at the time of distress all the time. Unskilled Personnel: In our banking industry, many bankers have a little knowledge about the risk assessment factors that they should apply while measuring the risk associated with loans and advances. Failure of Business of the Borrower: Due to lack of business knowledge, experience in the field of business or other reason borrower’s business become fail which makes them unable to repay the loan to the banks. Willful Default by the Borrower: Most of the people of our country tend repaying the money as late as possible. When this type of borrower borrows money from the bank they have the intension not to repay the loan at all or to pay as late as possible. Poor Management Quality of Borrowers: If the management quality of the borrower’s company found to be weak, the risk of loan default increases. Lack of Proper Action Taken against Defaulters: In our country, loans are hardly monitored in due time as a result banks remain unaware of the defaulted loan, even if they come to know it. Delay in taking action or proper legal action against borrower keep the defaulted loan in the bank’s portfolio for a long time results from an increase in the aggregate NPL.
- 26. A Study on Non-Performing Loan: From the Perspective of the Banking Industry in Bangladesh 26 | P a g e Chittagong Independent University Adverse Economic Conditions: Some borrowers are not willful defaulters rather they fail to repay loans for some adverse economic factors that affect their business such as recession, political instability, increasing inflation, etc. Fund Diversion: Sometimes borrower takes the loan for one purpose but uses them for another purpose causing extra risk for banks. Regular monitoring of the loan is thus essential to ensure their proper utilization. Delay in Assessing and Distributing Loans: Due to delay in assessing or disbursing loan, banks failed to provide money to business enterprises at the time when they need it most. As a result, the business fails as they suffer from the shortage of funds Improper Documentation: When the loan becomes defaulted, the bank fails to track the borrower as they didn’t maintain proper documentation at the beginning of loan contact thus make it difficult to take proper action against the defaulters. Lack of Applicability of Regulation: There are several regulation and guidelines for managing nonperforming loan such as The Bankruptcy Act, Money Loan Court Act, etc. but in practice, they are not followed entirely and efficiently. 3.6: Adverse effects of Non-Performing Loan in Bangladesh This study finds some of the major adverse effects of NPL which are given below: Reduce Capacity to Provide New Loans: Honest borrowers are deprived of getting the new and adequate amount of loans as NPL reduces the investable funds of the bank. Shrinking Profits: NPL reduces interest income with the principal amount of loan. Again banks need to maintain the provision for NPL which ultimately reduces net income.
- 27. A Study on Non-Performing Loan: From the Perspective of the Banking Industry in Bangladesh 27 | P a g e Chittagong Independent University Rise in Lending Rates: Due to NPL banks lose interest income, but they need to maintain operating costs to run their business smoothly. As an incidence of that bank further increases lending rates for new loans. Deteriorate Economic Growth: Non-performing loan requires provision and to meet this requirement banks have to cut off their profit with a vast amount of provisioning requirement. Due to huge profit cuts and the rising cost of capital resulting from NPL the investment opportunity of banks decreases, therefore, upsets the economic development. Decreases Reinvestment of Fund: NPL blocks the money of banks by the defaulters and restrains the bank from reinvesting that fund that they could have invested in the more profitable sector. Credit Crunch: This situation arises when due to the increase of NPL bank failed to provide sufficient fund at the previous interest rate to new loans. Hampers Performing Loans: It also negatively affect the performing loans. From the bad experience of NPL, banks forced to follow the restrictive lending policy which ultimately adversely affects the performing loans also. Disruption in Money Cycle: Due to NPL banks failed to provide the adequate amount of return to its depositors resulting in the withdrawal of funds by the depositor that ultimately cause the shortage of funds. Thus disruption in money cycle emerged due to NPL. Decreases Employment Opportunity: Due to huge NPL, banks face difficulties to expand their business hence decreases the employment opportunity. Due to this problem prospective businesses also shrink their expansion as they don’t get sufficient funds. Increase the Cost of Banks: As banks need to perform several NPL management strategies, more supervision and strong monitoring required which in turns increases the overall costs of the bank. Reduce the Capital Adequacy Ratio: NPL decreases the capital by reducing profit and also the increasing NPL leads in increasing risk- weighted assets thus eventually ruin the capital adequacy ratio.
- 28. A Study on Non-Performing Loan: From the Perspective of the Banking Industry in Bangladesh 28 | P a g e Chittagong Independent University 3.7: Monitoring of NPL For any loan which has the tendency of turning into NPL or which is already listed as NPL needs monitoring very closely by the bank for not being a bad debt. For this bank do some certain things to monitor their loans, which are- Verbal communication- Banks maintain verbal communications with their borrowers through phone calls. If any borrower misses any scheduled payment bank call the borrower to remind that fact and try to know why s/he missed the payment date. This communication helps the bank to know the current situation of the borrower and also helps to maintain a good relationship with the client. Formal Letter- If the loan has already being listed as non- performing loan, bank sends formal letter to the borrower to let him know the situation and also the consequences he might face for the loan being non-performing, also to request him to pay the loan as soon as possible. Physical Visit- If above factors doesn’t get responded by the borrowers; bank sends officers to visit that person/ business place to know why they are not repaying the loans or the situation of the business. The officers try to collect some loan amount in their physical visit and also let the borrower know about the bad effects of a loan being non-performing. The officers also try to find out why the person or the company is not paying the loans properly. If any borrower cannot repay his/her loan, the bank sells the collateral security in auction and try to recover their loans. If the loan amount is up to TK 50,000 the bank doesn’t file any case on the borrower. If the amount is above TK 50,000 the bank file case against the defaulter in court.
- 29. A Study on Non-Performing Loan: From the Perspective of the Banking Industry in Bangladesh 29 | P a g e Chittagong Independent University PART IV ANALYSIS ON NON- PERFORMING LOANS IN THE BANKING SECTORS OF BANGLADESH
- 30. A Study on Non-Performing Loan: From the Perspective of the Banking Industry in Bangladesh 30 | P a g e Chittagong Independent University 4.0: Banking Sector Performance The banking sector in Bangladesh comprises four categories of scheduled banks state-owned commercial banks (SCBs), state-owned development financial institutions (DFIs), private commercial banks (PCBs) and foreign commercial banks (FCBs). Total number of 57 banks operated in 2017. The number of bank branches increased at the end of June 2017 to 9955 from 9654 of June 2016. Information on the banking structure and activities by types of banks is shown in Table 4.1. Table 4.1: Banking Structure And Activities SCBS DFIS PCBS FCBS Total 2010 Number of banks 4 4 30 9 47 Number of branches 3447 1382 2828 72 7729 Total assets 1384.3 295.4 2854.6 320.8 4855.1 Sharein industry assets (in percent) 28.5 6.1 58.8 6.6 100.0 Deposits 1044.9 183.4 2266.5 227.1 3721.9 Share in deposits (in percent) 28.1 4.9 60.9 6.1 100.0 2011 Number of banks 4 4 30 9 47 Number of branches 3437 1406 3055 63 7961 Total assets 1629.2 328.8 3524.2 385.4 5867.6 Share in industry assets (in percent) 27.8 5.6 60.0 6.6 100 Deposits 1235.6 214.4 2787.5 272.2 4509.7
- 31. A Study on Non-Performing Loan: From the Perspective of the Banking Industry in Bangladesh 31 | P a g e Chittagong Independent University Share in deposits (in percent) 27.4 4.8 61.8 6.0 100 2012 Number of banks 4 4 30 9 47 Number of branches 3478 1440 3339 65 8322 Total assets 1831.9 385.5 4371.5 441.8 7030.7 Share in industry assets (in percent) 26.1 5.5 62.2 6.3 100 Deposits 1377.9 260.4 3430.7 327.0 5396.0 Share in deposits (in percent) 25.5 4.8 63.6 6.1 100 2013 Number of banks 4 4 39 9 56 Number of branches 3520 1494 3602 69 8685 Total assets 2108.5 454.8 4948.2 488.7 8000.2 Share in industry assets (in percent) 26.4 5.7 61.9 6.1 100 Deposits 1631.2 343.0 3939.3 359.5 6273.0 Share in deposits (in percent) 26.0 5.5 62.8 5.7 100
- 32. A Study on Non-Performing Loan: From the Perspective of the Banking Industry in Bangladesh 32 | P a g e Chittagong Independent University 2014 Number of banks 4 4 39 9 56 Number of branches 3553 1500 3917 70 9040 Total assets 2517.1 333.8 5787.1 505.0 9143.0 Share in industry assets (in percent) 27.5 3.7 63.3 5.5 100 Deposits 1952.1 237.6 4449.4 326.0 6965.1 Share in deposits (in percent) 28.0 3.4 63.9 4.7 100 2015 Number of banks 4 4 39 9 56 Number of branches 3690 1406 4226 75 9397 Total assets 2839.6 291.3 6652.9 530.8 10314.6 Share in industry assets (in percent) 27.5 2.8 64.5 5.2 100 Deposits 2254.8 226.6 5110.4 336.8 7928.6 Share in deposits (in percent) 28.4 2.9 64.5 4.3 100 2016 Number of banks 6 2 40 9 57 Number of branches 3710 1407 4467 70 9654 Total assets 3209.5 299.5 7560.0 557.6 11626.6
- 33. A Study on Non-Performing Loan: From the Perspective of the Banking Industry in Bangladesh 33 | P a g e Chittagong Independent University Share in industry assets (in percent) 27.6 2.6 65.0 4.8 100 Deposits 2535.4 249.4 5788.0 361.1 8933.9 Share in deposits (in percent) 28.38 2.79 64.79 4.04 100 2017 Number of banks 6 2 40 9 57 Number of branches 3721 1407 4758 69 9955 Total assets 3379.5 317.6 8758.3 603.9 13059.3 Share in industry assets (in percent) 25.88 2.43 67.07 4.62 100 Deposits 2700.6 273.3 6508.2 392.8 9874.9 Share in deposits (in percent) 27.35 2.77 65.91 3.98 100 In 2017, the SCBs held 25.88 percent share of the total assets which was 27.61 in 2016. PCBs' share in the total assets increased from 65.03 percent in 2016 to 67.07 percent in 2017. The FCBs held 4.62 percent share in the total assets in 2017, showing a decline of 0.18 percentage points over the previous year. The DFIs' share in the total assets declined to 2.43 percent in 2017 from 2.58 percent in 2016 (Table 4.1). Total deposits of the banks in 2017 rose to BDT 9874.89 billion from BDT 8933.92 billion in 2016, showing an increase of 10.53 percent. The SCBs' share in deposits decreased from 28.38 percent in 2016 to 27.35 percent in 2017. PCBs' deposits in 2017 amounted to BDT 6508.19 billion or 65.91 percent in the total deposit compared
- 34. A Study on Non-Performing Loan: From the Perspective of the Banking Industry in Bangladesh 34 | P a g e Chittagong Independent University to BDT 5788.02 billion or 64.79 percent in 2016. FCBs' deposits in 2017 slightly increased by BDT 31.65 billion over the year 2016, although its contribution to total deposits decreased slightly. The DFIs' deposits in 2017 was BDT 273.32 billion against BDT 249.4 billion in 2016, showing an increase of 9.59 percent over the year One newly licensed private commercial bank has started its operation in 2016. Therefore, the number of scheduled banks increased to 57 in 2016 from 56 in 2015 and the number of bank branches increased to 9654 in June 2016 from 9397 in June 2015. At the end of June 2017, total number of bank branches increased further to 9720. Information on the banking structure is shown in Table 4.1. In 2016, the SCBs held 27.60 percent share of the total assets which was 27.53 percent in 2015. PCBs’ share of the total assets increased from 64.50 percent in 2015 to 65.02 percent in 2016. The FCBs held 4.80 percent share of the total assets in 2016, showing a decline of 0.35 percentage points over the previous year. The DFIs’ share of the total assets was 2.58 percent in 2016 against 2.82 percent in 2015. Total deposits of the banks in 2016 rose to BDT 8933.9 billion from BDT 7928.6 billion in 2015 showing an overall increase of 12.7 percent. The SCBs’ share in total deposits slightly decreased from 28.4 percent in 2015 to 28.4percent in 2016. PCBs’ deposits in 2016 stood at BDT 5788.0 billion or 64.8 percent of the total deposits compared to BDT 5110.4 billion or 64.5 percent in 2015. FCBs’ deposits in 2016 slightly increased by BDT 24.4 billion over the year 2015 although, their contribution to total deposits decreased slightly. The DFIs’ deposits in 2016 was BDT 249.4 billion against BDT 226.6 billion in 2015 showing an increase of 10.1 percent over the year. The banking sector of Bangladesh comprises four categories of scheduled banks. These are the state owned commercial banks (SCBs), the state owned development financial institutions (DFIs), the private commercial banks (PCBs), and the foreign commercial banks (FCBs). While the number of banks remained unchanged at 47 in 2011, the number of bank branches increased from 7658 in 2010 to 7961 in 2011 reflecting the opening of new branches by the PCBs. At the end of June 2012, the total number of bank branches increased further to 8059, with total number of banks remaining unchanged at 47.
- 35. A Study on Non-Performing Loan: From the Perspective of the Banking Industry in Bangladesh 35 | P a g e Chittagong Independent University 4.1: Aggregate Balance Sheet Total industry assets in 2017 showed an increase of 12.34 percent over 2016. During this period, the SCBs' assets rose by 5.29 percent and that of the PCBs' increased by 15.85 percent. In 2017, loans and advances of BDT 8050.85 billion constituted the most significant portion (61.6 percent) in the sector's aggregate assets of BDT 13059.26 billion. Moreover, cash in tills including foreign currencies was BDT 117.62 billion; deposits with BB was BDT 810.37 billion; other assets was BDT 2357.83 billion and investment in government bills & bonds was BDT 1722.59 billion during the same period. Loans & Advances, 6787.94, 58.4% Govt. bills & bond, 1862.24, 16.0% Deposit with BB 6.3% Cash in tills, 106.51, 0.9% Other Assets, 2133.03, 18.3% Aggregate Industry Assets (2016) Loans & Advances Govt. bills & bond Deposit with BB Cash in tills Other Assets Loans & Advances, 8050.85, 62.7% Govt. bills & bond, 1722.59, 13.4% Deposit with BB 6.3% Cash in tills, 117.62, 0.9% Other Assets, 2133.03, 16.6% Aggregate Industry Assets (2017) Loans & Advances Govt. bills & bond Deposit with BB Cash in tills Other Assets
- 36. A Study on Non-Performing Loan: From the Perspective of the Banking Industry in Bangladesh 36 | P a g e Chittagong Independent University Deposits continued to be the main sources of funds of the banking industry and constituted 75.3 percent (BDT 9834.19 billion) of total liability in 2017. Capital and reserves of the banks were BDT 910.31 billion (7.49 percent) in 2017 as compared to BDT 859.11 billion (7.40 percent) in 2016. Deposits, 8892.97, 76.5% Capital & Reserve, 859.11, 7.4% Other liability, 1874.56, 16.1% Aggregate Industry Liabilities 2016 Deposits Capital & Reserve Other liability Deposits, 9834.19, 75.3% Capital & Reserve, 910.31, 7.0% Other liability, 2314.76, 17.7% Aggregate Industry Liabilities 2017 Deposits Capital & Reserve Other liability
- 37. A Study on Non-Performing Loan: From the Perspective of the Banking Industry in Bangladesh 37 | P a g e Chittagong Independent University The development of a sound banking sector is important for the sustainable development of an economy. Since banking sector is the main component of the overall financial system in Bangladesh, the health of the economy is closely related to the soundness of its banking system. BB has adopted many prudential policies for maintaining stability in the banking sector. The aggregate micro-prudential soundness indicators (Capital Adequacy, Asset Quality, Management, Earnings, Liquidity and Sensitivity to Market Risk) of the banking sector also known as Financial Stability Indicators are consider for measuring banking sector performance. 4.2: Capital Adequacy Capital adequacy focuses on the total position of banks' capital and the protection of depositors and other creditors from the potential losses that a bank might incur. It helps absorbing all possible financial risks related to credit, market, operation, interest rate, liquidity, reputation, settlement, strategy, environment & climate change etc. Under Basel-III, banks in Bangladesh are instructed to maintain the Minimum Capital Requirement (MCR) at 10.0 percent of the Risk Weighted Assets (RWA) or BDT 4.0 billion as capital, whichever is higher. Under the Supervisory Review Process (SRP), banks are directed to maintain a level of "adequate" capital which is higher than the minimum required capital and sufficient to cover for all possible risks in their business. This higher level of capital for the banks is usually determined and finalized through SRP and SREP (Supervisory Review Evaluation Process, the central bank's assessment) dialogue. The aggregate amount of capital of the banking sector was BDT 280.58 billion as on June 2010 which increased to BDT 945.61 billion at the end of June 2018. Table 4.2: Capital to Risk Weighted Assets Ratio by Type of Banks (In percent) Bank types June 2010 June 2011 June 2012 June 2013 June 2014 June 2015 June 2016 June 2017 June 2018 SCBs 8.9 11.7 8.1 10.8 8.3 6.4 5.9 5.0 2.0 DFIs -7.3 -4.5 -7.8 -9.7 -17.3 -32.0 -33.7 -35.5 -31.9 PCBs 10.1 11.5 11.4 12.6 12.5 12.4 12.4 12.5 12.2
- 38. A Study on Non-Performing Loan: From the Perspective of the Banking Industry in Bangladesh 38 | P a g e Chittagong Independent University FCBs 15.6 21.0 20.6 20.2 22.6 25.6 25.4 24.9 23.0 Total 9.3 11.4 10.5 11.5 11.3 10.8 10.8 10.83 10.0 Table 4.2 shows the Capital to Risk Weighted Assets Ratio (CRAR) by type of banks. It is observed that on June 2018, SCBs, DFIs, PCBs and FCBs maintained CRAR of 2.0, -31.9, 12.2 and 22.2 percent respectively. In 2017, CRAR ratio of SCBs was 5.0, DFIs, PCBs and FCBs maintained CRAR of -35.5, 12.5, 24.9, and 10.8 percent respectively. But individually, 4 SCBs, 3 PCBs and 2 DFIs could not maintain the minimum required CRAR. Graph 4.2: Capital to Risk Weighted Assets Ratio by Type of Banks The CRAR of the banking industry as a whole was 10.83 percent at end of June 2017 as against 10.80 percent at the end of 2016. The CRAR of the industry was 10.0 percent at the end of June 2018. Trend of CRAR ratio of Bangladesh banking sector is downward which are not good. 4.3: Asset Quality Loans and advances (61.6%) are the major components in the asset composition of all commercial banks. The high concentration of loans and advances increases the vulnerability of assets to credit risk. However, investment of banks in bills, bonds, -40 -30 -20 -10 0 10 20 30 2010 2011 2012 2013 2014 2015 2016 2017 2018 CRAR SCBs DFIs PCBs FCBs Total
- 39. A Study on Non-Performing Loan: From the Perspective of the Banking Industry in Bangladesh 39 | P a g e Chittagong Independent University shares etc. also demonstrates somewhat concentration, which is 13.2 percent to total assets in 2017. 4.4: Overall NPL Scenario of Bangladesh The most important indicator to demonstrate the asset quality in the loan portfolio is the ratio of gross Non-Performing Loans (NPLs) to total loans and net NPLs to net total loans. At the end of June 2018, the gross NPL of the banking sector stood at 10.4 percent. 4.4.1: Gross NPLs to Total Loans by Type of Banks Table 4.3 shows that PCBs had the lowest and SCBs had the highest gross NPLs. PCBs' gross NPLs was 6.0 percent, whereas those of SCBs, FCBs and DFIs were 33.35, 21.7 and 6.6 percent respectively at the end of June 2018. Table 4.3: Gross NPLs to Total Loans by Type of Banks (in percent) Bank types June 2010 June 2011 June 2012 June 2013 June 2014 June 2015 June 2016 June 2017 June 2018 SCBs 15 12.6 23.34 23.6 29.6 25.6 30.54 32.2 33.35 DFIs 24.2 24.6 26.8 26.8 32.81 23.2 26.0 23.4 21.7 PCBs 3.2 2.9 4.6 4.5 4.98 4.9 4.6 4.9 6.0 FCBs 3.0 3.0 3.5 5.5 7.30 7.8 9.6 7.0 6.7 Total 7.3 6.1 10.0 8.9 9.7 8.8 9.2 9.3 10.4 The ratio of gross NPLs to total loans indicates a mixed trend in the banking system during 2010-2018. It declined in 2011 and increased in 2012 (10.0 percent) and again declined in 2013 (8.9 percent). Afterward, the ratio jumped in 2014 (9.7 percent) and again declined in 2015 (8.8 percent). But the ratio shows an upward trend in recent years mainly due to increase in total classified loans, defaulted outstanding and non- recovery of loans. At the end of June 2018, it stood at 10.4 percent (Graph 4.3). Graph 4.3: Gross NPLs to Total Loans by Type of Banks
- 40. A Study on Non-Performing Loan: From the Perspective of the Banking Industry in Bangladesh 40 | P a g e Chittagong Independent University The high level of NPLs in SCBs and DFIs continued due to substantial loans disbursed by them was on considerations other than commercial criteria. Poor assessment and inadequate follow-up and supervision of the loans disbursed by the SCBs and DFIs eventually consequence the current situation of poor quality assets. However, BB took various measures (i.e. loan classification, loan rescheduling, provisioning and write- off) to recovery the loan. Besides, BB has also taken steps with regard to internal restructuring of these banks to strengthen their loan recovery mechanism and write- off measures in recent years. 4.4.2: Ratio of Net NPL to Total Loans by Type of Banks Table 4.4: Ratio of Net NPL to Total Loans by Type of Banks (in percent) Bank types June 2010 June 2011 June 2012 June 2013 June 2014 June 2015 June 2016 June 2017 June 2018 SCBs 1.9 -0.3 12.8 1.7 6.1 9.2 11.1 11.2 11.7 DFIs 16.0 17.0 20.4 19.7 25.5 6.9 10.5 9.7 7.4 PCBs 0.00 0.2 0.9 0.6 0.8 0.6 0.1 0.2 0.8 FCBs -1.7 -1.8 -0.9 -0.4 -0.9 -0.2 1.9 0.7 0.8 Total 1.3 0.7 4.4 2.0 2.7 2.3 2.3 2.2 2.7 0 5 10 15 20 25 30 35 40 2010 2011 2012 2013 2014 2015 2016 2017 2018 Gross NPLs to total loans SCBs DFIs PCBs FCBs Total
- 41. A Study on Non-Performing Loan: From the Perspective of the Banking Industry in Bangladesh 41 | P a g e Chittagong Independent University Table 4.4 show that the ratio of net NPLs (net of provisions and interest suspense) to net total loans (net of provisions and interest suspense) was 2.7 percent in 2018 for the banking sector and it was 11.7 percent for SCBs. The table demonstrates that SCBs' and PCBs’ non-performing portfolios increased in 2018 as compared to that of the previous year. The net NPLs were 11.7, 7.4, 0.8 and 0.8 percent for the SCBs, DFIs, PCBs and FCBs respectively at the end of June 2018. Net NPL of the industry was 2.2 percent at the end of June 2017. Graph4.4: Ratio of Net NPL to Total Loans by Type of Banks It reveals from the table that the SCBs and DFIs’ non-performing portfolios were still high after adjustment of actual provision and interest suspense, whereas the FCBs had excess provision against their NPLs in 2010-2015. 4.4.3: Amount of NPLs by Type of Banks Table 4.5: Amount of NPLs by Type of Banks (In billion BDT) Bank types June 2010 June 2011 June 2012 June 2013 June 2014 June 2015 June 2016 June 2017 June 2018 SCBs 107.6 91.7 215.2 166.1 227.6 272.8 310.3 373.3 428.5 DFIs 49.7 56.5 73.3 83.6 72.6 49.7 56.8 54.3 52.4 -5 0 5 10 15 20 25 30 2010 2011 2012 2013 2014 2015 2016 2017 2018 Net NPL to Total Loans SCBs DFIs PCBs FCBs Total
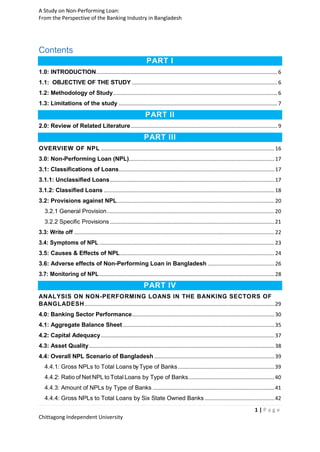
- 42. A Study on Non-Performing Loan: From the Perspective of the Banking Industry in Bangladesh 42 | P a g e Chittagong Independent University PCBs 64.3 72.0 130.4 143.1 184.3 253.3 230.6 294.0 389.8 FCBs 5.5 6.3 8.5 13.0 17.1 18.2 24.1 21.5 22.7 Total 227.1 226.4 427.3 405.8 501.6 594.1 621.8 743.0 893.4 Table 4.5 shows the amount of NPLs of the four types of banks since 2010 to 2018. The amount of NPLs of the SCBs increased from BDT 107.6 billion in 2010 to BDT 428.5 billion in 2018. The amount of NPLs of the PCBs stood at BDT 389.8 billion in 2018 up from BDT 64.3 billion in 2010. The amount of NPLs of the DFIs increased to BDT 52.4 billion in 2018 from BDT 49.7 billion in 2010. The amount of NPLs of the FCBs increased to BDT 22.7 billion in 2018 as against BDT 5.5 billion in 2010. Graph 4.5: Amount of NPLs by Type of Banks The table also demonstrates that total NPLs of the banking sector have increased to BDT 893.4 billion in 2018 as compared to BDT 743.0 billion in 2017 and the amount of NPLs has increased in SCBs and PCBs and has decreased in DFIs and FCBs in 2017 as compared to that of the previous year. The amount of NPLs of SCBs, DFIs, PCBs and FCBs Stood at BDT 428.5, 52.4, 389.8 and 22.7 billion respectively at the end of June 2018. 4.4.4: Gross NPLs to Total Loans by Six State Owned Banks 0 100 200 300 400 500 600 700 800 900 1000 2010 2011 2012 2013 2014 2015 2016 2017 2018 Amount of NPLs SCBs DFIs PCBs FCBs Total
- 43. A Study on Non-Performing Loan: From the Perspective of the Banking Industry in Bangladesh 43 | P a g e Chittagong Independent University Table 4.6: Gross NPLs to Total Loans (In percent) Banks June 2010 June 2011 June 2012 June 2013 June 2014 June 2015 June 2016 June 2017 June 2018 Agrani Bank 12.88 11.07 25.30 17.93 16.96 18.96 25.59 17.45 17.67 Sonali Bank 23.88 17.80 33.31 30.21 25.61 25.08 28.38 35.09 26.14 Basic Bank 4.83 4.38 8.22 28.75 57.15 51.09 54.13 54.63 56.85 Janata Bank 5.24 5.83 17.42 11.12 33.72 16.54 14.73 16.54 33.72 Rupali Bank 11.96 5.94 24.96 16.75 12.15 3.70 19.90 23.40 19.21 BDBL 31.31 30.5 30.86 36.75 31.81 38.29 40.48 46.07 46.53 Graph 4.6: Gross NPLs to Total Loans Table shows the ratio of nonperforming Loan to Total Loans of State controlled Banks of Bangladesh. All banks suffer with higher Classified Loan but the condition of basic banks is very disastrous. In 2018, Gross NPLs to Total Loans of basic bank is 56.85%., which is highest in Bangladesh banking History. The NPL Ratio of Basic bank from 0 10 20 30 40 50 60 70 2010 2011 2012 2013 2014 2015 2016 2017 2018 Gross NPLs to Total Loans Agrani Bank Sonali Bank Basic Bank Janata Bank Rupali Bank BDBL
- 44. A Study on Non-Performing Loan: From the Perspective of the Banking Industry in Bangladesh 44 | P a g e Chittagong Independent University 2010 is 4.83, 4.38, 8.22, 28.75, 57.15, 51.09%, 54.13%, 54.63%, and 56.85%. BDBL is also in a dangerous position. From 2015-2018, The NPL ratio of BDBL was 38.29%, 40.48%, 46.07%, 46.53%. In 2018, NPL ratio of Agrani bank was 17.67%, NPL ratio of sonali bank was decrease from 35.09% to 26.14%, Janata Bank Has 33.72% of NPL. 4.4.5: Required Provision and Provision Maintained by the Banking Industry Table 4.7 : Required Provision and Provision Maintained by the Banking Industry (in billion BDT) All Banks June 2010 June 2011 June 2012 June 2013 June 2014 June 2015 June 2016 June 2017 June 2018 Amount of NPLs 227.1 226.4 427.3 405.8 501.6 594.1 621.7 743.0 893.4 Required Provision 149.2 148.2 242.4 252.4 289.6 308.9 362.1 443.0 528.8 Provision maintained 142.3 152.7 189.8 249.8 281.6 266.1 307.4 375.3 448.9 Excess(+)/ shortfall(-) -6.9 4.6 -52.6 -2.6 -7.9 -42.8 -54.7 -67.7 -79.9 Provision maintenance Ratio (%) 95.4 103.0 78.3 99.0 97.2 86.1 84.9 84.7 84.9 Table 4.7 shows the aggregate amount of NPLs, the required loan loss provision and the actual provision maintained by the banks from 2010 to 2018. The Table show that
- 45. A Study on Non-Performing Loan: From the Perspective of the Banking Industry in Bangladesh 45 | P a g e Chittagong Independent University in aggregate, the banks continuously failed to maintain the required level of provision against their NPLs from 2010 to 2018. Banks maintained 103.0 percent in 2011. But in the recent years the provision maintenance ratio showed declining trend and in 2018 it stood at 84.9 percent. 4.4.6: Comparative Position of Provision Adequacy by Types of Banks Table 4.8 : Comparative Position of Provision Adequacy by Types of Banks (in billion BDT) Year Items SCBs DFIs PCBs FCBs June 2010 Required provision 70.64 19.07 53.31 6.19 Provision maintained 69.87 13.29 51.78 7.39 Provision maintenance ratio (%) 98.9 69.7 97.1 119.4 June 2011 Required provision 69.8 20.6 60.0 7.5 Provision maintained 69.8 14.3 60.0 8.2 Provision maintenance ratio (%) 100.0 69.4 100.0 109.3 June 2012 Required provision 119.2 29.8 84.4 8.9 Provision maintained 81.9 13.6 84.9 9.3 Provision maintenance ratio (%) 68.7 45.7 100.6 104.3 June 2013 Required provision 107.8 38.3 94.8 11.6 Provision maintained 122.3 17.4 97.8 12.3 Provision maintenance ratio (%) 113.5 45.5 103.2 106.0 June 2014 Required provision 124.2 49.3 114.4 12.5 Provision maintained 110.7 19.3 117.9 12.5 Provision maintenance ratio (%) 89.1 39.2 103.1 100.1 June 2015 Required provision 140.4 26.4 126.0 126.0 Provision maintained 94.7 28.4 126.6 16.5 Provision maintenance ratio (%) 67.5 107.6 100.5 102.5 June 2016 Required provision 174.0 27.8 144.2 16.0 Provision maintained 113.2 28.4 149.4 16.4 Provision maintenance ratio (%) 65.1 102.2 103.6 102.5
- 46. A Study on Non-Performing Loan: From the Perspective of the Banking Industry in Bangladesh 46 | P a g e Chittagong Independent University June 2017 Required provision 216.9 26.1 184.3 15.6 Provision maintained 134.3 26.2 198.2 16.5 Provision maintenance ratio (%) 61.9 100.4 107.5 105.8 2018 June Required provision 252.9 25.0 234.6 16.2 Provision maintained 162.0 27.9 242.0 16.9 Provision maintenance ratio (%) 64.1 111.6 103.2 104.3 The main reason for the shortfall in provision was the inability of some SCBs and PCBs, including those in the problem bank category due to increase in classified loans, poor quality and inadequacy of collaterals, low profit and provision transfer for write- offs. On the other hand, the FCBs were in a much better position since they were able to keep adequate provisions. A comparative position of loan loss provisions of four types of banks as of end 2010 to 2018 is shown in Table 4.8. Provision maintenance ratio of SCBs was decreasing from 2013-2018 and other types of bank was increasing their provision maintained. 4.4.7: Writing-off Bad Debts by Types of Bank Table 4.9: Writing-off Bad Debts by Types of Bank (In billion BDT) Bank Types June 2010 June 2011 June 2012 June 2013 June 2014 June 2015 June 2016 June 2017 June 2018 SCBs 70.5 82.4 72.9 107.2 154.8 210.3 220.4 224.4 226.2 DFIs 31.8 32.0 24.5 32.6 34.2 5.6 5.6 5.6 5.6 PCBs 69.6 77.1 64.9 109.7 127.7 155.5 189.4 216.7 239.9 FCBs 2.1 2.4 2.6 3.7 4.4 5.1 7.2 8.6 10.3 Total 174.0 193.9 164.9 253.3 321.1 376.5 423.2 455.3 482.0 In order to rectify an unnecessarily and artificially inflated size of the balance sheet, a uniform guideline for write-off was introduced in 2003. Banks may write off bad/loss
- 47. A Study on Non-Performing Loan: From the Perspective of the Banking Industry in Bangladesh 47 | P a g e Chittagong Independent University loans complying with the conditions covered by the guideline. The total amount of written-off loans by different bank categories is given in Table 4.9. Graph 4.9: Writing-off Bad Debts by Types of Bank Out of 40 PCBs 35 PCBs were able to maintain the required provision at the end of June 2018, but the remaining five banks failed due to their poor asset portfolios and earning levels. The provision maintenance ratios of PCBs and FCBs show its increasing trend, whereas that of SCBs and DFIs show the declining trend in the recent years. Trend shows the increasing amount of writing off bad debts which means NPL was increasing and it wasn’t unable to recover. 4.4.8: Geographical NPL Distribution Both loans outstanding and NPLs had high geographical concentration in Dhaka and Chattogram regions. Among different sectors, proportionately higher NPLs in trade and commerce appeared to be one of the key reasons behind the higher NPLs in the industry. Table 4.10: Geographical NPL Distribution of 2018 Division Total Loan NPL Dhaka 67.2% 67.5% Chattogram 18.7% 17.5% 0 50 100 150 200 250 300 350 400 450 500 2010 2011 2012 2013 2014 2015 2016 2017 2018 SCBs DFIs PCBs FCBs Total
- 48. A Study on Non-Performing Loan: From the Perspective of the Banking Industry in Bangladesh 48 | P a g e Chittagong Independent University Barisal 1.3% 1.1% KHULNA 4.0% 4.2% MYMENSINGH 1.4% 2.2% RAJSHAHI 3.8% 3.4% RANGPUR 2.3% 2.5% SYLHET 1.2% 1.6% From Table, it is observed that loans were mainly concentrated in Dhaka (67.2 percent) followed by Chattogram (18.7 percent). Considering these two regions, they comprised almost 86 percent of total outstanding loans in banking sector. Geographical concentration of NPLs also follow this trend as Dhaka had 67.5 percent while Chattogram had 17.5 percent of classified loans. These statistics indicate that the current geographical concentration of loans does not seem to be a critical reason behind the rise in NPLs as NPL concentration matched with the loan concentration in these regions. Most of the sectors had similar or lower share of total NPLs against their share of total loans except trade and commerce as of end-June 2018. NPLs in trade and commerce sector were proportionately higher than their share in total industry’s loans in 2018. 4.4.9: The sector-wise NPL distributions Table 4.11 shows a modest concentration of NPL s across different sectors of the economy in 2018. However, NPL concentration increased in trade and commercial loans. Compared to 2017, the share of loans to trade and commerce sectors decreased by 0.7 percentage point in 2018 while the share of NPL to this sector increased by 4.4 percentage points. Loan disbursement to this sector needs to be monitored intensively due to its deteriorating asset quality. TABLE 4.11 : SECTOR-WISE NONPERFORMING LOANS DISTRIBUTION (2018)
- 49. A Study on Non-Performing Loan: From the Perspective of the Banking Industry in Bangladesh 49 | P a g e Chittagong Independent University (Amount in billion BDT) Sl. No. Name of Sector Total loans outstanding (Amount) Gross NPL (Amount) Gross NPL Ratio % share of loans extended to a particular sector % share of NPLs of a particula r sector 1 Agriculture 374.5 47.3 12.63% 4.1% 5.0% 2 Industrial (Manufacturing): 2.1 RMG 1079.2 116.2 10.77% 11.8% 12.4% 2.2 Textile 710.4 62.3 8.77% 7.8% 6.6% 2.3 Ship building and Ship breaking 135.0 26.8 19.84% 1.5% 2.9% 2.4 Agro-based Industry 585.6 64.6 11.04% 6.4% 6.9% 2.5 Other Industries (Large Scale) 1451.6 110.7 7.63% 15.9% 11.8% 2.6 Other Industries (Small, Medium and Cottage) 396.1 52.0 13.12% 4.3% 5.5% 3 Industrial (Services): 3.1 Construction 614.3 58.3 9.49% 6.7% 6.2% 3.2 Transport and Communication 150.9 17.9 11.83% 1.7% 1.9% 3.3 Other Service Industries 326.6 25.3 7.74% 3.6% 2.7% 4 Consumer Credit:
- 50. A Study on Non-Performing Loan: From the Perspective of the Banking Industry in Bangladesh 50 | P a g e Chittagong Independent University 4.1 Credit Card 45.3 2.8 6.09% 0.5% 0.3% 4.2 Auto (Car) 25.8 0.6 2.26% 0.3% 0.1% 4.3 Housing Finance 159.3 11.3 7.11% 1.7% 1.2% 4.4 Personal 246.0 9.2 3.73% 2.7% 1.0% 5 Trade and Commerce (Commercial Loans) 2037.3 265.9 13.05% 22.4% 28.3% 6 Credit to NBFI 77.8 2.3 2.97% 0.9% 0.2% 7 Loans to Capital Market: 7.1 Merchant Banks 23.8 0.4 1.68% 0.3% 0.0% 7.2 Other than Merchant Banks 19.1 0.1 0.57% 0.2% 0.0% 8 Other Loans 656.4 65.1 9.91% 7.2% 6.9% Total 9115.1 939.1 10.3% 100.0% 100.0% The sector-wise share of the loan disbursement consists of eight sectors with some few sub-sectors. In the 2018, five major sectors (e.g., commercial loans, working capital, industrial loan, RMG & textile and construction) had availed around 68% of the total loan disbursement. Regarding the sector-wise share of loan, there was large variability in different sectors. TABLE 4.12: SECTOR-WISE NONPERFORMING LOANS DISTRIBUTION (2013-218) (Percentage) Sl. No. Name of Sector 2013 2014 2015 2016 2017 2018 1 Agriculture 14.10% 12.64% 7.8% 8.9% 8.5% 5.0%
- 51. A Study on Non-Performing Loan: From the Perspective of the Banking Industry in Bangladesh 51 | P a g e Chittagong Independent University 2 Industrial (Manufacturing): 2.1 RMG & Textile 16.70% 15.64% 11.9% 21% 24.6% 19% 2.2 Ship building and Ship breaking 1.30% 1.54% 26.8 2.9% 2.6% 2.9% 2.4 Other Industries (Large Scale) 10.80% 12.41% 14.6% 9.8% 8.2% 11.8% 2.5 Other Industries (Small, Medium and Cottage) 1.80% 1.43% 2.9% 7.0% 5.8% 5.5% 3 Industrial (Services): 3.1 Construction 3.9% 4.54% 4.6% 6.4% 5.7% 6.2% 3.2 Transport and Communication 1.60% 2.00% 2.1% 2.8% 2.0% 1.9% 4 Consumer Credit: 2.90% 3.00% 3.0% 3.3% 2.7% 2.6% 5 Trade and Commerce (Commercial Loans) 12.60% 17.14% 16.7% 23.4% 23.9% 28.3% 6 Other Loans 6.90% 6.14% 7.8% 7.2% 5.9% 6.9% Table show percentage share of NPLs of a particular sector during 2013- 2018. The non-performing loan of agriculture sector in decreasing year to year. In manufacturing industrial sectors, NPL was decrease from 2017 to 2018, but Overall NPL position is very high. We can see that Trade and commerce sector cover highest percentage of NPL in last Five years and it is increasing continuously. In 2018, it was 28.3% which is 23.9 in 2017. Table show a comparative nonperforming loan of Different sector from 2013-2018.
- 52. A Study on Non-Performing Loan: From the Perspective of the Banking Industry in Bangladesh 52 | P a g e Chittagong Independent University 4.5: Consequences of NPL on Banks' Profitability and Financial Stability The recent rising trends of NPLs in the overall banking system in Bangladesh are major concerned for policymakers and the stakeholders, because high NPLs give huge stress in the banks to earn profit and weaken the financial stability. Chart and table show the trends of NPLs and two key profitability indicators; the Returns on Assets (ROA) and Returns of Equity (ROE) during the 2010-2018. It is observed from the table that there is a negative relationship NPLs and ROA /ROE. The negative relationship between NPLs and banks' profitability is a major concern for the policymakers. Table 4.13: NPL on Banks' Profitability and Financial Stability (percentage) 2010 2011 2012 2013 2014 2015 2016 2017 2018 NPL Ratio 7.3 6.1 10.0 8.9 9.7 8.8 9.2 9.3 10.4 ROA 1.8 1.5 0.64 0.90 0.64 0.77 0.68 0.74 0.29 ROE 21.0 17.0 8.20 11.10 8.09 10.51 9.42 10.60 4.44
- 53. A Study on Non-Performing Loan: From the Perspective of the Banking Industry in Bangladesh 53 | P a g e Chittagong Independent University Graph 4.13: NPL on Banks' Profitability and Financial Stability 4.5.1: Consequences of NPL on banks' profitability Bank needs to keep higher provision as its NPL increases hence it pressure on, banks’ profitability. Returns on Assets (ROA) and Returns of Equity (ROE) tend to fall down Higher NPL would also compel the banks to extending their efforts in recovering the loans from those 'bad' borrowers. In this process, the operational expense (for recovery/ litigation) is assumed to go up Vicious cycle: NPL results into economic slowdown as the borrowing firm/individual gradually loses its capability to generate enough earning to pay back the loan. Further injection of money to overcome the crisis is also halted as the borrower is marked as a defaulter in the regulator's record. Eventually, the firm moves into further dire state; and the probability of getting back the money is getting lower for the lending bank. Low public confidence: Higher NPL may also lower the public confidence on the bank. In that case, attracting deposit would get even harder which may result the cost of deposit (or borrowing) to increase. Once the cost of fund goes up, the profitability margin tends to shrink. 4.5.2: Consequences of NPL on financial stability 7.3 6.1 10 8.9 9.7 8.8 9.2 9.3 10.4 1.8 1.5 0.64 0.9 0.64 0.77 0.68 0.74 0.29 21 17 8.2 11.1 8.09 10.51 9.42 10.6 4.44 0 5 10 15 20 25 2010 2011 2012 2013 2014 2015 2016 2017 2018 NPL ratio ROA ROE
- 54. A Study on Non-Performing Loan: From the Perspective of the Banking Industry in Bangladesh 54 | P a g e Chittagong Independent University Due to the irregularity (or stuck) in pay back from the NPLs, there is a strong tendency of sprouting up the liquidity mismatch that results into a higher liquidity risk for the bank. With increasing NPLs, Risk-weighted Assets (RWA) would increase; which, in turn, would create pressure on maintaining the regulatory capital adequacy requirement. As the Financial Stability Report (2018) refers, increase in NPLs would have the most adverse impact on the banking sector's Capital-to-Risk weighted Asset Ratio (CRAR). Higher NPL has substantial impact in disturbing the overall resilience of the banking sector through disorienting the combined risk management efforts of the banks. FSR (2018) also reveals that under different stress scenarios, banking system finds itself resilient at interest rate, exchange rate and equity price shocks but remains vulnerable with credit defaults (i.e., NPLs), especially default of large borrowers. Higher NPLs in one or more banks would expose the risk of contagion (also referred to as systemic risk) to the banking system. Such financial difficulties at one or more banks may easily spill over to a large number of other banks, and subsequently, to the financial system as a whole. Moreover, the high level of NPLs would affect the micro (i.e., bank level) and macro (i.e., central bank/monetary authority) strategies in the lending sector, which makes the job of the policymakers even harder. Bangladesh Bank revised the loan classification and provisioning policy and made it more stringent through Circular No.14 of 2012 in order to comply with the international best practices and Basel core principle and with a view to increasing the stability of the banking sector in the long run. Other relevant policy supports and intense monitoring are also followed for ensuring a better macro-prudential regulatory system in managing the non-performing loans in the banking sector of the country. 4.6: Non-performing Loans in the South Asian countries It is evident from the table 4.13 that the banking system of Bangladesh is badly impacted by NPL. Likewise, countries of South Asia are also experiencing the same
- 55. A Study on Non-Performing Loan: From the Perspective of the Banking Industry in Bangladesh 55 | P a g e Chittagong Independent University problem of lack of recycling fund due to NPL though it varies across the countries. The position of NPLs in South Asia is given bellow: Table 4.14: The position of NPLs in South Asia (percentage) Country 2010 2011 2012 2013 2014 2015 2016 2017 2018 Bangladesh 7.3 6.1 10.0 8.9 9.7 8.8 9.2 9.3 10.4 India 2.4 2.3 2.8 3.2 3.8 4.3 7.5 9.3 11.18 Pakistan 14.7 15.7 14.6 13.3 12.3 11.4 10.1 8.4 8.2 Bhutan 5.2 3.9 5.4 7.0 6.8 6.6 7.2 8.4 11.5 Maldives 17 19 20.9 17.6 17.5 14.1 10.6 10.5 9 Sri Lanka 5.4 3.8 3.7 5.6 4.2 3.2 2.6 2.5 3.4 In the 2018, Bhutan experienced a larger share of nonperforming loans to total loans compared to other countries in South Asia. The percentage of nonperforming loans to total outstanding loans was 11.5% for Bhutan. On the contrary, Sri Lanka faced the lowest percentage of non-performing loans to total outstanding loans which stood at only 3.4% during the same period. Regarding the share of non-performing loans to the total outstanding loans, there was large variability among countries. Pondering Ten years standard deviation from 2010 to 2018, largest change took place in Bangladesh, India and Bhutan. It was increasing year by year. On the other hand, Pakistan, Maldives decreased their NPL. It would be good indication to have ten years average percent-wise comparison among the countries because it show real condition of banking sector among countries. In this regard, the economy of Maldives interrupted by 13.6% at ten years average ratio of non-performing loans to total outstanding during 2010 to 2018 which was the largest percentage of classified loan compared to other South Asian countries. In contrast, Sri Lanka was able to maintain lower level of five years average ratio of NPLs to total outstanding at 3.4% during the same period. The ten years average ratio of gross NPLs to total outstanding loans for India was 4.7% which is appreciable. In the case of Bangladesh, the ratio was 7%. Graph 4.14: The position of NPLs in South Asia
- 56. A Study on Non-Performing Loan: From the Perspective of the Banking Industry in Bangladesh 56 | P a g e Chittagong Independent University Regarding all aspects of the measurements, Sri Lanka was in good position. They maintained both the variability of NPL as well as the level of NPL well below the internationally acceptable limit. The goal of this study is to find out the impact of inadequate collateral on NPL although there are lots of determinants of NPL. It would be good to explore, which determinants are liable for NPL in South Asian countries especially in case of Maldives and Sri Lanka. If any field survey is undertaken in future to understand the magnitude and determinants of NPL in those countries, Bangladesh might be benefited. 0 5 10 15 20 25 Bangladesh India Pakistan Bhutan Maldives Sri Lanka Chart Title 2010 2011 2012 2013 2014 2015 2016 2017 2018
- 57. A Study on Non-Performing Loan: From the Perspective of the Banking Industry in Bangladesh 57 | P a g e Chittagong Independent University PART V FINDINGS, RECOMMENDATION & CONCLUSION
- 58. A Study on Non-Performing Loan: From the Perspective of the Banking Industry in Bangladesh 58 | P a g e Chittagong Independent University 5.0: Findings Non-performing loans are always negative for any banks performance, which eventually affects the country’s economy. While working with this topic the following subjects seemed most important about NPL and the profitability of banks. Increase of the NPL Amount: Over the years, the NPL amount has been increasing which is negatively affecting country’s banking sector. The main causes of increasing NPLs are- Not monitoring the loans properly Misuse of the political power A large number of competitors in banking sector Willful defaulter Unattractive business industry Large Number of Banks and Financial Institutions Compared to our Economy: Right now Bangladesh has 57 banks, which has a lot of branches all over the country. There are many non-banking financial institutions, leasing companies etc. which are also playing important role in country’s financial sector. To be in the competition and to be the leader in the industry, some banks become too much flexible while giving the loans without taking proper documents of the borrower whether s/he can repay back the loan or not. Sometime to encourage people to do business, like SME, some banks also give extra benefits of taking loans. However, research shows that most of these loans become NPL. Bank’s Policy of NPL: SCBs is very cautious about giving loans and monitoring the loans. While disbursing any loan SCBs takes all the needed documents and check their financial situation properly. After disbursing the loan, the correspondent officers always monitor the loan and get up to date with the borrower and the loan situation. NPL’s Effect on bank’s Performance: NPL ratio effect negatively on overalls banking profitability. The effects of NPL were- Decreasing in net profit due to loan loss provision. Decrease in ROA and ROE in last 10 years due to lower Net Profit and greater total Asset amount.
- 59. A Study on Non-Performing Loan: From the Perspective of the Banking Industry in Bangladesh 59 | P a g e Chittagong Independent University Likewise, countries of South Asia are also experiencing the same problem of lack of recycling fund due to NPL though it varies across the countries.
- 60. A Study on Non-Performing Loan: From the Perspective of the Banking Industry in Bangladesh 60 | P a g e Chittagong Independent University 6.0: Recommendations Non-performing loan as a major problem of the banking industry should be treated more seriously by all the banks in the industry. This study found some initiatives to control the adverse impact of NPL on the bank’s performance. The key initiatives are recommended below to reduce NPL: Lessen the Interference of Political Parties: BB should apply the quasi- judicial power to prevent corrupted parties from becoming the BODs of a bank even if the government appoints any. Ensuring Accountability of Employees: Employees associated with loan sanctioning and disbursement procedure should be accountable for his/her work. Banks should monitor the employees within the office so that any employee cannot fraudulently provide any loan to any false customer. Reducing Recapitalization: The Govt. should stop recapitalization facilities from the taxpayer’s money as it establishes poor professionalism and accountability among the bank’s personnel. Adapting Improved Loan Recovery Procedure: Collateral collected against loans should regularly be checked whether it has sufficient value or legal ownership so that no delay occurs while selling them for recovery. Strictly Follow Rules and Regulation Provided by BB for NPL Management: To prevent the risk of default, banks should strictly follow guidelines and regulations provided by BB time to time. Intensify the Internal Risk Management of Banks: Banks should maintain the database for large credit to identify vulnerabilities associated with a large amount of credit disbursement, default and recovery. Proper Lending Practices: Significant amount of loans should be disbursed to the productive sector so that the borrowers can have the ability to repay the loan on time. To avoid the risk associated with lending large amount, banks should provide loan by syndication. Judicial Use of Rescheduling and Write-off: Bank should provide rescheduling facility only to those who has proper justification and follows the guidelines for rescheduling appropriately.
- 61. A Study on Non-Performing Loan: From the Perspective of the Banking Industry in Bangladesh 61 | P a g e Chittagong Independent University Punishing Willful Defaulters through Legal Proceedings: The prevailing corruption practices in our banking industry should be controlled through applying legal action against convicted defaulters and corrupted persons as quickly as possible. Structured and Regular Monitoring: Bank should periodically monitor its outstanding loans and arrange visits and making reports by the officials regularly to ensure proper utilization of funds. Client Profile & Documentation: For safeguarding bank’s interest bank officials should properly maintain loan documentation and collect sufficient data of borrower time to time and update them in a regular fashion. Incentive and Training Programs for Employees: Employees should get incentive based on their performance for achieving recovery target and should get training facilities. 7.0: Conclusion It is clear that a poor banking system cannot help for the economic development in a country. Before liberation poor banking system was continuing in Bangladesh.Sound management is the most important and inescapable pre-requisite for the strength and concrete growth of any financial institution. It is found form the above discussion that the average recovery performance of private commercial banks is higher than that of state-owned commercial banks. Both the preventive and resolution measures are essential for the NPL management strategy. The provision or the write off may not be the right solution rather it will hamper the profitability and financial soundness of the banks. The banks should ensure cooperation, sincerity and accountability in the credit policy and the risk management process. The loan should be sanction with the verbal direction of higher management only for nepotism or good relation. Central Banks’ supervisory and monitoring functions have to be strengthened so that all the banks must comply with credit policy, even in some case the precautionary advice or alert can help to reduce the NPL possibility. The central banks can established a central information database of all the clients, so that any bank can find the credit worthiness or historical loan repayment trend of a client before disbursing loan.
- 62. A Study on Non-Performing Loan: From the Perspective of the Banking Industry in Bangladesh 62 | P a g e Chittagong Independent University Banks should assign high quality person with excellent capability of independent review to the credit review positions. The management should recruit the appropriate person to assess the risk involved with the loan and the pre-assessment is very much important. The experienced personnel should be recruit in the credit assessment department who can show the exact risk with the loan and the direction towards the recovery. Sound market competition and appropriate prudential regulation can act as the vita points as a remedy for reducing NPLs trend. Banking profitability in the long run depends on a bank’s ability to collect and analyze information and to put optimal conditions to its loan supply. The stated global experiences can be a great resource of measures to formulate the policy regarding NPLs problems. As per the suggested priorities of Jassaud & Kang (2015) the policymakers should: (i) tighten supervisory policies on provisioning and write-offs to speed up NPL resolution and restructuring; (ii) remove tax and regulatory impediments to debt restructuring; and (iii) improve further the insolvency framework and encourage more out-of court workouts. Finally, facilitating the creation of NPL AMCs and corporate restructuring vehicles would give banks more instruments to restructure, while expanding financing for distressed firms. Technology based banking system has helped the bank management to solve some of the inherent problems. Digitalization can further help the management in getting required information in order to take proper decisions while granting loans/advances. The demographic and economic view of customer can provide sound knowledge/information regarding the creditworthiness of the customers. So, the bank should evolve appropriate systems to detect deficiencies in the management of credit operations well before it calls for classification. In this regard an effective on-site and off-site supervision system should be in place both in the schedule banks and central banks. Further, timely resolve of problem loans will improve bank’s balance sheets and support new lending in the recovery. The securitization is, a very recent financial product, being used in the many developed and developing countries as a better solution for the NPL problem rather than just removing from balance sheet as loan loss. Securitization is a structured finance process which involves pooling and repackaging of cash flow producing financial assets into securities that are then sold to investors. This can give a better solution to solve the NPL problems as well as introduction of new financial market in the economy rather than writing off the NPL from balance sheet.
- 63. A Study on Non-Performing Loan: From the Perspective of the Banking Industry in Bangladesh 63 | P a g e Chittagong Independent University 8.0: References: Akter, R. & Roy, J.K. (2017), “The impacts of Nonperforming Loan on Profitability: An Empirical Study on Banking Sector of Dhaka Stock Exchange”, International Journal of Economics and Finance, Volume 9, Issue 3, pp (126- 132). Balango, T.K. & K, M.R. (2017), “The effect of NPL on profitability of banks with reference to commercial bank of Ethiopia”, Business and Management Research Journal, Volume 7, Issue 5, pp. (45 – 50). Bhattarai, Y.R. (2016), “Effect of Non-Performing Loan on the Profitability of Commercial Banks in Nepal”, International Journal of Business & Management, Volume 4 Issue 6, pp (435-442). Islam, M.A. & Rana, R.H. (2017), “Determinants of Bank Profitability for the Selected Private Commercial Banks in Bangladesh: A Panel Data Analysis”, Banks and Bank Systems, Volume 12 Issue 3, pp (179-192). Kingu, P.S., Macha, D.S. & Gwahula, D.R. (2018), “Impact of Non-Performing Loans on Bank’s Profitability: Empirical Evidence from Commercial Banks in Tanzania”, International Journal of Scientific Research and Management, Volume 6 Issue 1, pp (71-78). Kiran, K.P. & Jones, T.M. (2016), “Effect of Nonperforming Assets on the Profitability of Banks: A Selective Study”, International Journal of Business and General Management, Volume 5 Issue 2, pp (53-60). Lata, R. S. (2015), “Non-Performing Loan and Profitability: The Case of State Owned Commercial Banks in Bangladesh”, World Review of Business Research, Volume 5 Issue 3, pp (171-182). Haneef and et al (2011), ―Impact of Risk Management on Non-Performing Loans and Profitability of Banking Sector of Pakistan‖ International Journal of Business and Social Science, Vol. 3 No. 7; April 2012. Lata, Rabeya Sultana (2015), ―Non-Performing Loan and Profitability: The Case of State Owned Commercial Banks in Bangladesh‖, World Review of Business Research, Vol. 5. No. 3. September 2015 Issue. pp. 171 – 182 Bhattarai, Y.R. 2016,‘Effect of Credit Risk on the Performance of Nepalese Commercial Banks’, NRB Economic Review, Pp. 41-64.