1. Tenant View
Manhattan Office Q4 2012
The year ends with sluggish activity
hh
It seems likely that 2012 will be remembered as a year where large transactions
January 2013 nearly disappeared and overall leasing activity became sluggish, but most other
fundamentals held up well. Manhattan is still seen by many corporations,
Contents professional services firms and investors as this country’s most global city, a key
hub for talent and critical to their long term business strategy.
Economic Overview 2 Overall in 2012, total leasing activity registered 21.8 million square feet, 25 %
Market Overview 3 less than that for 2011. Most experts agreed the drop off was due largely to
Downtown 4 large companies’ concerns about committing to space during what was a year of
Midtown 5 insecurity given the presidential election, the Euro Zone crisis, an economy that
was sluggish throughout much of the year, the so-called “fiscal cliff,”
Midtown South 6
uncertainties in Manhattan’s bellwether financial services industry and so on.
Contacts 11 Our forecast for the first half of 2013 calls for continued modest declines in the
vacancy rate, marginally higher average asking rents, a further drop in the city’s
unemployment rate and some improvement in leasing volume. However, we
Author
anticipate smaller-sized deals continuing to predominate and office employment
Xueying Li possibly not keeping pace with other sectors due to cutbacks in financial services
Senior Research Analyst and banking. A further slowdown in venture capital funding may also inhibit the
+1 212 328 4212 growth previously enjoyed by the technology sector.
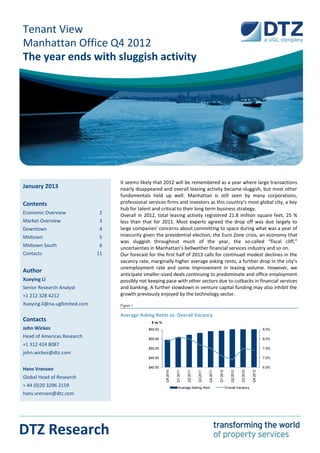
Xueying.li@na.ugllimited.com Figure 1
Average Asking Rents vs. Overall Vacancy
Contacts $ vs %
John Wickes $60.00 8.5%
Head of Americas Research $55.00 8.0%
+1 312 424 8087
$50.00 7.5%
john.wickes@dtz.com
$45.00 7.0%
$40.00 6.5%
Hans Vrensen
Q4 2010
Q1 2011
Q2 2011
Q3 2011
Q4 2011
Q1 2012
Q3 2012
Q2 2012
Q4 2012
Global Head of Research
+ 44 (0)20 3296 2159 Average Asking Rent Overall Vacancy
hans.vrensen@dtz.com
DTZ Research
2. Manhattan Q4 2012
Figure 2
Economic Overview
Despite Sandy, New York’s unemployment rate fell Unemployment
The U.S. economy added 155,000 jobs in December and the
unemployment rate remained unchanged at 7.8%, %
according to the Bureau of Labor Statistics. During 2012, the
8.2%
68,000 jobs were lost in the public sector; however, the Dec 12
private sector added 1.9 million jobs, notably in health care, 8.8%
food and beverage service, construction and manufacturing 8.2%
Dec 11
sectors. 9.1%
The New York State unemployment rate fell from 8.7% to 8.3%
8.2% between October and December 2012. As a result of Dec 10
9.0%
Hurricane Sandy, more than 29,000 private sector jobs were
8.8%
lost in November. Despite the negative impact of the storm Dec 09
to the state’s economy, New York State added 83,500 10.0%
private sector jobs in 2012, a sign of moderate economic 6.7%
Dec 08
recovery. 7.0%
According to the New York State Labor Department, in the 4.7%
12 month period leading up to November, the New York Dec 07
4.8%
City economy added more than 66,000 jobs. Additionally,
the unemployment rate in New York City fell to 8.8% in State NYC
December from its peak in both June and July staying at
10.0%, still a decline from 9.3% at the beginning of 2012.
Several sectors saw large gains in employment in over 2012, Figure 3
including professional and business services, education and
health services, however, there were job losses in financial Leasing Activity
services, natural resources, mining, construction and
manufacturing. As the nation’s economy grew moderately SF
in the second half of the year, the consensus is that this 14,000,000
reflected increased business confidence and would 12,000,000
continue to translate into a stronger job market in 2013.
10,000,000
According to a report by the Independent Budget Office of
8,000,000
New York City, by 2016, the city is expected to continue
increased employment and a decreased unemployment 6,000,000
rate from 8.8% to 6.1% by adding jobs in health care, 4,000,000
education and technology sectors. Near term, however, the
Q4 2010
Q1 2011
Q2 2011
Q3 2011
Q4 2011
Q1 2012
Q2 2012
Q3 2012
Q4 2012
job market recovery is expected to be slow due to the well
known problems being experienced by financial firms.
Direct Leasing Sublet Leasing
www.dtz.com Tenant View 2
3. Manhattan Q4 2012
Figure 4
Market Overview
Rental Rates Average Asking Rents
For the Manhattan office market overall, average asking
PSF
rents increased quarter-over-quarter, rising by $0.45 to $70.00
$60.62. Most of the increase was due to continued growth
in Class B rents, which rose to $46.06, $3.00 higher than the $60.00
third quarter 2011.
The Class A rental rate rose by $0.15 following a $0.37 $50.00
decrease in the third quarter. $40.00
The Class B rental rate climbed from $45.55 to $46.06,
reflecting value hunting by firms seeking to offset $30.00
Q1 2011
Q2 2011
Q3 2011
Q1 2012
Q2 2012
Q4 2010
Q4 2011
Q3 2012
Q4 2012
persistent high rates in Class A assets.
Vacancy
All Classes Class A Class B
The overall vacancy rate dropped 10 basis points to 7.4%
after having spiked upward in the third quarter. It is now
back below the level of a year ago. Figure 5
The Class A vacancy rate fell from 8.5% to 8.4%, while the
Class B rate remained the same. Overall Vacancy
The overall vacancy rate was highest in Midtown and
lowest in Midtown South. %
10.0%
Supply
The total availability rate dropped to 11.7% in the fourth 8.0%
quarter 2012, the lowest level in the last three years. Both
6.0%
direct and sublet availability decreased from the third
quarter. 4.0%
Direct availability decreased 20 basis points quarter-over-
quarter to 9.7% 2.0%
Q4 2010
Q2 2011
Q3 2011
Q4 2011
Q1 2012
Q3 2012
Q1 2011
Q2 2012
Q4 2012
Sublet availability fell to 2.0%, a decrease of 10 basis
points.
All Classes Class A Class B
Net Absorption
Notwithstanding the stagnant economy and a slowdown in
leasing volume, net absorption turned positive for the fifth
time in the past six quarters. Figure 6
Total net absorption for 2012 registered 2.3 million square
feet, nearly double the 1.2 million square feet recorded in Deliveries vs. Net Absorption
2011.
This underlines the fundamental strength of the New York SF
economy and Manhattan leasing market. 2,000,000
1,500,000
1,000,000
500,000
0
Q1 2011
Q2 2011
Q3 2011
Q4 2011
Q1 2012
Q2 2012
Q3 2012
Q4 2012
Q4 2010
(500,000)
(1,000,000)
(1,500,000)
(2,000,000)
(2,500,000)
(3,000,000)
Deliveries Net Absorption
www.dtz.com Tenant View 3
4. Manhattan Q4 2012
Figure 7
Downtown
Rental Rates Average Asking Rents vs. Overall Vacancy
For Downtown landlords, 2012 was a good year with every $ vs %
quarter surpassing average rental rates achieved in the $45.00 10.0%
same period a year earlier.
Overall, Downtown saw its rental rate rise by 4% year over $40.00 8.0%
year, with a yearend average asking price of $41.45.
$35.00 6.0%
These increases may not be sustainable however, due to
the impact of Hurricane Sandy, as well as upcoming $30.00 4.0%
availabilities in the downtown area.
Both Class A and Class B space displayed modest quarter- $25.00 2.0%
Q1 2011
Q2 2011
Q3 2011
Q4 2011
Q4 2012
Q4 2010
Q1 2012
Q2 2012
Q3 2012
over-quarter rental growth.
Class A asking rents rose by $0.10, going from $41.41 to
Average Asking Rents Overall Vacancy
$41.51.
Class B asking rents inflated by $0.51, rising from $37.36 to
$37.87.
Figure 8
Vacancy
Average Asking Rents
The overall vacancy rate Downtown dropped to an
historical low of 6.4% in the fourth quarter 2012.
The Class A vacancy rate edged down slightly relative to
PSF
the last quarter, falling from 6.9% to 6.8%.
Class B buildings, as the assets most of interest to growing
$50.00
media and technology companies, showed a further $40.00
decline in the vacancy rate, which fell from 5.5% to 5.2%
quarter-over-quarter. $30.00
Leasing Activity $20.00
Numerous media and technology companies left Midtown $10.00
Q2 2012
Q3 2012
Q4 2012
Q4 2010
Q1 2011
Q2 2011
Q3 2011
Q4 2011
Q1 2012
South for Downtown, seeking cheaper rents. Thus, leasing
activity Downtown remained at the level of 1 million square
feet per quarter in 2012. Class A Class B
By the end of 2012, total leasing activity downtown
totalled 6.5 million square feet. In the fourth quarter,
however, total leasing activity registered just 1.1 million
Figure 9
square feet.
Nielsen, the well known media company, signed a lease Overall Vacancy
for 160,000 square feet in a relocation of their offices to
Goldman Sachs' former headquarters at 85 Broad Street in
the Financial District. %
10.0%
8.0%
6.0%
4.0%
2.0%
Q1 2011
Q2 2011
Q3 2011
Q4 2011
Q2 2012
Q4 2012
Q4 2010
Q1 2012
Q3 2012
Class A Class B
www.dtz.com Tenant View 4
5. Manhattan Q4 2012
Figure 10
Midtown
Rental Rates Average Asking Rents vs. Overall Vacancy
Average asking rents in Midtown were up $1.20 for the year
$ vs %
and $0.36 quarter-over-quarter. By contrast, overall asking
$70.00 10.0%
rents ballooned by $4.61 in 2011.
With the exception of the Plaza District, all submarkets $60.00 8.0%
saw a quarter-over-quarter rise in asking rents. Plaza
District, which remains Manhattan’s priciest submarket, $50.00 6.0%
saw rents fall from $88.97 in the third quarter to $87.75.
$40.00 4.0%
Class B asking rates rose for the fifth consecutive quarter,
increasing by $0.41 to $48.11 per square foot. $30.00 2.0%
The combined average asking rental rate in Midtown rose
Q1 2011
Q2 2011
Q3 2011
Q4 2011
Q4 2012
Q4 2010
Q1 2012
Q2 2012
Q3 2012
to $69.88 in the fourth quarter from $69.52 in the
previous quarter. Class A rates averaged $79.78, once Average Asking Rents Overall Vacancy
again nearing the $80.00 barrier.
Vacancy
The overall vacancy rate in Midtown ticked down quarter- Figure 11
over-quarter, falling by 0.1% to 8.2%. This was higher Average Asking Rents
however, than the 7.7% recorded in the fourth quarter last
PSF
year.
$100.00
For Class A buildings, the vacancy rate declined 0.1% to
9.1% in the third quarter. $80.00
Class B buildings however, saw their vacancy rate remain
level at 6.6%. $60.00
From the beginning of 2012, Midtown replaced Downtown
$40.00
as having the highest vacancy rate among the three
submarket clusters. $20.00
Q4 2010
Q1 2011
Q2 2011
Q3 2011
Q4 2011
Q1 2012
Q2 2012
Q3 2012
Q4 2012
Leasing Activity
Overall leasing activity totalled 4.2 million square feet, a Class A Class B
quarter-over-quarter decline of 1 million square feet.
Smaller deals predominated, although two large renewals
at year’s end boosted the market.
Figure 12
UBS renewed and expanded for 890,000 square feet at
1285 Avenue of the Americas, an increase of 190,000 Overall Vacancy
square feet and Jefferies & Company signed a 15-year %
renewal for 345,000 square feet at 520 Madison Avenue. 10.0%
8.0%
6.0%
4.0%
2.0%
Q4 2010
Q1 2011
Q2 2011
Q4 2011
Q1 2012
Q3 2012
Q3 2011
Q2 2012
Q4 2012
Class A Class B
www.dtz.com Tenant View 5
6. Manhattan Q4 2012
Figure 13
Midtown South
Rental Rates Average Asking Rents vs. Overall Vacancy
Midtown South’s average rental rate grew by $0.88 during
$ vs %
the fourth quarter, rising to $49.44 per square foot. This
$50.00 10.0%
was the largest increase among the three market clusters.
Rental rates for Class A buildings in Midtown South picked $40.00 8.0%
up by $0.73 in the fourth quarter after having held firm at
$52.48 for the first three quarters of the year, closing at $30.00 6.0%
$53.21 per square foot.
$20.00 4.0%
Class B rental rates continued their trend of increasing
every quarter, as they have throughout the past two $10.00 2.0%
Q1 2011
Q2 2011
Q3 2011
Q4 2011
Q4 2012
Q4 2010
Q1 2012
Q2 2012
Q3 2012
years, climbing by $0.54 to $48.68 per square foot in the
fourth quarter.
As a result of the steady increases, many technology and Average Asking Rents Overall Vacancy
media companies, which have long favored Midtown
South, have been forced to look at other markets both in
and outside Manhattan.
Figure 14
Vacancy
Midtown South’s overall vacancy rate returned to the same Average Asking Rents
level recorded in the fourth quarter of 2011, standing at PSF
5.9%. As prices have nonetheless continued to climb, many $60.00
tenants have been priced out of the market.
The Class A vacancy rate moved up from 6.5 to 7.1% $50.00
Class B vacancy rate grew from 4.0% to 4.2% $40.00
Supply and Demand
$30.00
Despite a decrease in sublet availability, the overall
availability rate rose from 8.8% in the third quarter to 9.0%, $20.00
as the result of an even greater increase in direct available
Q4 2010
Q3 2011
Q4 2011
Q2 2012
Q3 2012
Q4 2012
Q1 2011
Q2 2011
Q1 2012
space.
The largest deal in Midtown South this quarter was signed Class A Class B
by Medidata Solutions, which took 98,585 square feet at
350 Hudson Street in the Hudson Square submarket.
In addition, Inventiv Health renewed and expanded at 450
Figure 15
West 15th Street in Chelsea, by taking 75,000 square feet.
Overall Vacancy
%
10.0%
8.0%
6.0%
4.0%
2.0%
Q4 2010
Q1 2011
Q2 2011
Q4 2011
Q1 2012
Q3 2012
Q3 2011
Q2 2012
Q4 2012
Class A Class B
www.dtz.com Tenant View 6
7. Manhattan Q4 2012
Table 1
Leasing Fundamentals
Overall Vacancy Sublease Vacancy
Building Square Square Net Under Average
Submarket Count Feet Square feet Rate Feet Rate Absorption Construction Rent
City Hall 50 17,428,051 148,786 0.9% 3,154 0.0% 66,913 0 $42.65
Financial District 63 44,300,197 4,480,412 10.1% 510,118 1.2% 85,570 0 $40.83
Insurance District 38 12,863,563 651,695 5.1% 13,769 0.1% (8,614) 0 $37.00
Tribeca 25 8,443,070 465,097 5.5% 171,986 2.0% (17,336) 0 $46.68
World Trade
Center 41 30,447,173 1,523,346 5.0% 181,658 0.6% 126,654 8,265,630 $37.27
Downtown 217 113,482,054 7,269,336 6.4% 880,685 0.8% 253,187 8,265,630 $41.45
Columbus Circle 78 34,327,691 3,154,825 9.2% 1,013,104 3.0% (37,052) 1,052,150 $59.21
Grand Central 118 53,915,301 5,120,389 9.5% 836,870 1.6% 179,030 0 $77.33
Murray Hill 64 13,610,569 639,863 4.7% 56,785 0.4% 156,817 0 $52.68
Penn
Plaza/Garment 278 65,082,364 4,440,556 6.8% 421,461 0.6% 89,363 0 $52.40
Plaza District 215 83,213,079 6,695,127 8.0% 1,001,031 1.2% 248,644 0 $87.75
Times Square 87 44,823,601 4,281,341 9.6% 597,048 1.3% (69,971) 1,055,000 $67.97
U.N. Plaza 19 3,756,030 88,316 2.4% 0 0.0% (2,700) 0 $52.78
Midtown 859 298,728,635 24,420,417 8.2% 3,926,299 1.3% 564,131 2,107,150 $69.88
Chelsea 225 36,624,894 2,097,497 5.7% 113,810 0.3% 2,279 0 $50.06
Gramercy Park 111 24,007,667 865,298 3.6% 45,626 0.2% (435) 0 $47.09
Greenwich
Village 36 5,105,939 486,140 9.5% 19,100 0.4% (111,673) 400,000 $47.77
Hudson Square 37 12,599,925 1,294,957 10.3% 0 0.0% 40,980 0 $44.02
Soho 56 6,171,732 229,222 3.7% 18,347 0.3% 8,454 0 $48.99
Midtown South 465 84,510,157 4,973,114 5.9% 196,883 0.2% (60,395) 400,000 $49.44
Class A 433 302,792,337 25,417,848 8.4% 4,154,704 1.4% 408,012 10,772,780 $70.15
Class B 689 142,822,809 7,796,149 5.5% 767,070 0.5% 100,298 0 $46.06
Class C 419 51,105,700 3,448,870 6.7% 82,093 0.2% 248,613 0 $40.36
Manhattan 1,541 496,720,846 36,662,867 7.4% 5,003,867 1.0% 756,923 10,772,780 $60.62
www.dtz.com Tenant View 7
8. Manhattan Q4 2012
Table 2
Top Leasing Activity
Tenant Address, City Submarket Square feet Transaction Type
UBS 1285 Ave of the Americas Columbus Circle 830,000 Renewal
Microsoft 11 Times Sq Times Square 261,095 New
IPG 909 Third Ave Plaza District 220,359 New
Univision Communications 605 Third Ave Grand Central 136,000 Renewal
Nielsen 85 Broad St Financial District 115,207 New
Aon 299 Park Ave Plaza District 112,000 New
Cooley 1114 Ave of the Americas Times Square 111,000 Renewal
Hogan Lovells 875 Third Ave Plaza District 110,000 New
Medidata Solutions 350 Hudson St Hudson Square 98,585 New
Speyer Legacy School 400 W 59th St Columbus Circle 85,754 New
Table 3
Top Sales Activity
Address, City Seller Buyer Square feet Sale Price / PSF
1285 6th Ave Equitable Life Assurance AXA 1,749,000 $804.0m / $460
1440 Broadway Prudential RE Investors Rockpoint Group 740,000 $351.5m / $475
Tishman Speyer JV National
300 Park Ave AP2 718,700 $326.9m / $455
Pension Service
220 W 42nd St Epic UK Ltd Paramount Group 227,685 $261.0m / $1,146
RFR Realty JV East End Capital
285 Madison Ave WPP Group 550,000 $189.3m / $344
JV GreenOak Real Estate
www.dtz.com Tenant View 8
9. Manhattan Q4 2012
Definitions
Inventory: Existing Class A, B and C office properties
50,000 square foot minimum rentable base area
Non-owner occupied, non-medical use
Overall Vacancy: Inclusive of vacant direct and sublease space
Net Absorption: The change in physical occupancy from one period to the next
Average Asking Rents: Office rents are reported as gross per square foot, per year
Average asking rents are reported as direct
Average asking rents are weighted against the overall rentable building area
Under Construction: Properties that are under construction as physically evident by ground work
Deliveries: Completed construction projects as evident by issue of certificate of occupancy
Deliveries become part of inventory base
Leasing Activity: Completed lease executions that may impact future vacancy and net absorption
Sources: DTZ Research, Real Capital Analytics, CoStar Group, Bureau of Labor Statistics
Disclaimer: This report should not be relied upon as a basis for entering into transactions without seeking
specific, qualified, professional advice. Whilst facts have been rigorously checked, DTZ can take
no responsibility for any damage or loss suffered as a result of any inadvertent inaccuracy
within this report. Information contained herein should not, in whole or part, be published,
reproduced or referred to without prior approval. Any such reproduction should be credited to
DTZ.
www.dtz.com Tenant View 9
10. Manhattan Q4 2012
Other DTZ Research Reports
Other research reports can be downloaded from www.dtz.com/research. These include:
Occupier Perspective Insight
Updates on occupational markets from an occupier Thematic, ad hoc, topical and thought leading reports on
perspective, with commentary, analysis, charts and data. areas and issues of specific interest and relevance to real
estate markets.
Global Occupancy Costs Offices
Obligations of Occupation Americas Great Wall of Money
Obligations of Occupation Asia Pacific Property Market Correlations
Obligations of Occupation EMEA J-Reit
Rise of City Clusters
Singapore luxury condominiums
Property Times China Hongqiao Transportation Exchange
Regular updates on occupational markets from a landlord Global Debt Funding Gap
perspective, with commentary, charts, data and forecasts.
Coverage includes Asia Pacific, Bangkok, Beijing, Berlin,
Brisbane, Bristol, Brussels, Budapest, Central London,
Chengdu, Chongqing, Dalian, Edinburgh, Europe, Frankfurt,
Glasgow, Guangzhou, Hangzhou, Ho Chi Minh City, Hong DTZ Research Data Services
Kong, India, Jakarta, Japan, Kuala Lumpur, Luxembourg,
Madrid, Manchester, Melbourne, Milan, Nanjing, For more detailed data and information, the
Newcastle, Paris, Poland, Prague, Qingdao, Rome, Seoul, following are available for subscription. Please
Shanghai, Shenyang, Shenzhen, Singapore, Stockholm, contact graham.bruty@dtz.com for more
Sydney, Taipei, Tianjin, Ukraine, Warsaw, Wuhan, Xian. information.
Property Market Indicators
Investment Market Update Time series of commercial and industrial
Regular updates on investment market activity, with market data in Asia Pacific and Europe.
commentary, significant deals, charts, data and forecasts.
Coverage includes Asia Pacific, Australia, Belgium, Czech Real Estate Forecasts, including the DTZ
Republic, Europe, France, Germany, Italy, Japan, Mainland Fair Value IndexTM
China, South East Asia, Spain, Sweden, UK. Five-year rolling forecasts of commercial
and industrial markets in Asia Pacific,
Europe and the USA.
Money into Property
For more than 35 years, this has been DTZ's flagship Investment Transaction Database
research report, analysing invested stock and capital flows Aggregated overview of investment activity
into real estate markets across the world. It measures the in Asia Pacific and Europe.
development and structure of the global investment
market. Available for Global, Asia Pacific, Europe and UK. Money into Property
DTZ’s flagship research product for over 35
years providing capital markets data
Foresight covering capital flows, size, structure,
Quarterly commentary, analysis and insight into our in- ownership, developments and trends, and
house data forecasts, including the DTZ Fair Value Index™. findings of annual investor and lender
Available for Global, Asia Pacific, Europe and UK. In intention surveys.
addition we publish an annual outlook report.
www.dtz.com Tenant View 10