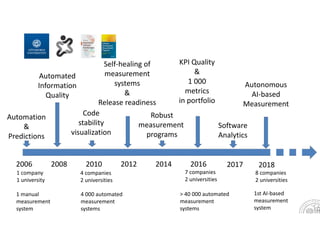
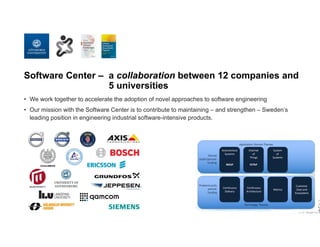
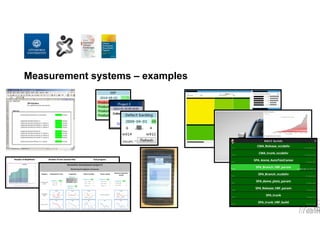
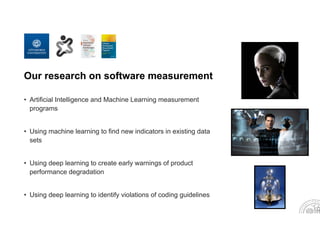
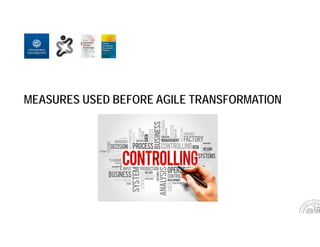
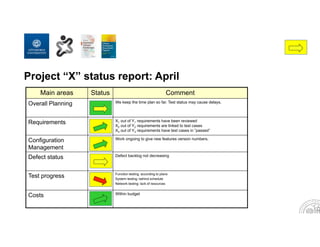
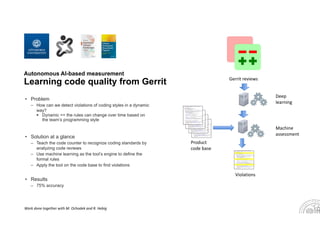
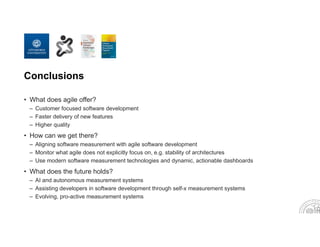
MEASURING AGILE SOFTWARE DEVELOPMENT
MIROSLAW STARON,
PROFESSOR IN SOFTWARE ENGINEERING,
UNIVERSITY OF GOTHENBURG
WILHELM MEDING,
SENIOR MEASUREMENT PROGRAM LEADER,
ERICSSON
About us
Miroslaw Staron
• Professor in Software Engineering at Chalmers | University of Gothenburg
– Specialization in software measurement
 Autonomous artificial intelligence based measurement
 Measurement knowledge discovery
 Simulation of outcome before decision formulation
 Metrological foundations of measurement reference etalons
– Over 200 publications
– Two books
Wilhelm Meding
• Senior measurement program leader at Ericsson
– Leader of a metrics team and an analytics team
– 20% metrics research
– Ca. 50 papers published
– One book
2006
1 company 
1 university
1 manual
measurement 
system
Automation
&
Predictions
2008
Automated 
Information 
Quality
2010
4 companies 
2 universities
4 000 automated
measurement
systems
Code 
stability 
visualization
2012
Self‐healing of 
measurement
systems
& 
Release readiness
2014
Robust
measurement 
programs
2016
7 companies 
2 universities
> 40 000 automated
measurement
systems
KPI Quality 
&
1 000 
metrics
in portfolio
2017
Software 
Analytics
2018
8 companies 
2 universities
Autonomous
AI‐based 
Measurement
1st AI‐based 
measurement
system
Software Center – a collaboration between 12 companies and
5 universities
• We work together to accelerate the adoption of novel approaches to software engineering
• Our mission with the Software Center is to contribute to maintaining – and strengthen – Sweden’s
leading position in engineering industrial software-intensive products.
Measurement systems – examples
Our research on software measurement
• Artificial Intelligence and Machine Learning measurement
programs
• Using machine learning to find new indicators in existing data
sets
• Using deep learning to create early warnings of product
performance degradation
• Using deep learning to identify violations of coding guidelines
MEASURES USED BEFORE AGILE TRANSFORMATION
Main areas Status Comment
Overall Planning We keep the time plan so far. Test status may cause delays.
Requirements X1 out of Y1 requirements have been reviewed
X2 out of Y2 requirements are linked to test cases
X3 out of Y3 requirements have test cases in ”passed”
Configuration
Management
Work ongoing to give new features version numbers.
Defect status Defect backlog not decreasing
Test progress Function testing: according to plans
System testing: behind schedule
Network testing: lack of resources
Costs Within budget
Project “X” status report: April
Monitoring TR Backlog and test progress
Defect inflow predictions
0
0,1
0,2
0,3
0,4
0,5
0,6
0,7
0,8
0,9
1
month-6
month-5
month-4
month-3
month-2
month-1
Design-ready
month1
month2
month3
month4
Percentageofdefects(scaledtothepeak)
Release: baseline-2
Release: baseline-1
Release: baseline
Rayleigh model
1 week
0,00
20,00
40,00
60,00
80,00
100,00
120,00
140,00
1 3 5 7 9 11 13 15 17 19 21 23 25 27 29 31 33 35 37 39 41 43 45
Prediction
LCI-mean
UCI-mean
LCI-individual
UCI-individual
Actual
MEASURES DURING AGILE TRANSFORMATION
”Embrace flow”
”Optimize for speed”
”Empower teams”
”Nurse main branch”
”Unleash releases”
Bottlenecks aka Things in Queue
Finding legacy practices – Project’s DNA
Agile
tranformation
Project’s DNA (commits, defects) before Agile Project’s DNA (commits, defects) After Agile
Similarity: 20% of activities after the transformation are the same as before
Velocity
• Definition of velocity (from Agile)
– Velocity: work completed in a given time period
– Measure: # story points per sprint
Stable teams
• Definition
– How many times did any individual in the organization change team within the measurement period?
– Average per organization
Standard SAFe measures (examples)
• Program velocity
• Predicability
• Number of features planned
• Number of features accepted
• Number of enabler features planned
• Number of enabler features accepted
• Number of non-functional tests
• Number of stories planned
• Number of stories accepted
• Unit test coverage
• Number of defects
• Number of total tests
• Percent of automated test
• Velocity planned
• Velocity actual
• Number of refactors
Meding W (2017): Sustainable measurement programs for 
software development companies ‐ What to measure. 
IWSM Mensura, Gothenburg, Sweden
Software defect related measures
AGILE MEASURES
INDIVIDUALS AND INTERACTIONS OVER PROCESSES AND TOOLS
WORKING SOFTWARE OVER COMPREHENSIVE DOCUMENTATION
CUSTOMER COLLABORATION OVER CONTRACT NEGOTIATION
RESPONDING TO CHANGE OVER FOLLOWING A PLAN
Progress of software development teams, cont.
Picture taken from book:
“Software Development Measurement Programs. 
Development, management and evolution”
Publisher: Springer
ISBN: 978‐3‐319‐91835‐8
X
Release readiness, example 1
Picture taken from book:
“Software Development Measurement Programs. 
Development, management and evolution”
Publisher: Springer
ISBN: 978‐3‐319‐91835‐8
No of defects
Defect removal rate – (Test execution rate – Test pass rate)
Release readiness =
Indicator forecasts when the product is ready for release
given the current development speed
Release readiness, example 2
Picture taken from book:
“Software Development Measurement Programs. 
Development, management and evolution”
Publisher: Springer
ISBN: 978‐3‐319‐91835‐8
456
4,072
4,072
4,072
0
Integration related measures
Measure Measurement Function Stakeholder Information Need
Integration
effectiveness
(number of builds successfully integrated to
the main branch) over (number of builds
delivered to the main branch) * 100 (in %)
per week
Integration leader - What is the quality of the builds
delivered to the main branch?
- What is the quality of the
performance of the building tools?
Integration waste average time a build has to wait before it
can be integrated to the main branch (in
minutes)
Integration leader What is the waste in the integration
process?
Integration speed average time it takes for a build to be
integrated to the main branch (in minutes)
Integration leader How efficient is the building process?
Meding W (2017): Sustainable measurement programs for 
software development companies ‐ What to measure. 
IWSM Mensura, Gothenburg, Sweden
Integration effectiveness Integration waste & Integration speed 
Defects into integration
Architectural dependencies
— Architecture weight
— Architecture preservation factor
— Degree of impact of change
— Coupling
— Cohesion
— Number of components
— Number of connectors
— Number of symbols
How good is our architecture?
How maintainable is our architecture?
How ”big” is our architecture?
Staron M, Meding W (2016): 
A portfolio of internal quality metrics for 
software architects (SWQD2017)
Customer defect inflow
Picture taken from book:
“Software Development Measurement Programs. 
Development, management and evolution”
Publisher: Springer
ISBN: 978‐3‐319‐91835‐8
Speed over velocity
Requirements Coding Code review
Code
integration
Testing Deployment
• Speed: time from start of review to end of 
review (+2 in Gerrit)
• Size: numbers of files in a batch
• Complexity: 
• Number of reviewers
• Number of reviews
• Speed: time from start of testing to ready‐
for‐deployment
• Size
• Number of files
• Number of test cases
• Complexity
• McCabe 
• # of assertions
• Speed: time from commit until build is 
ready for testing
• Compile speed
• UT speed
• FT speed
• Size: numbers of files in a batch
AGILE MEASURES IN REALITY
Theory vs Companies’ need (excerpt from our study)
Measure Theory Company A Company B
Velocity ++ ‐‐ ‐‐
Speed ‐‐ ++ ++
Number of releases per year ++ ‐‐ ‐‐
Release readiness ‐‐ ++ ‐‐
Team velocity vs. Capacity ++ ‐‐ ‐‐
Scope creep ‐‐ ‐‐ ++
Burn‐up ‐‐ ++ ++
Number of *‐tests ++ ++ ++
Number of defects ‐‐ ++ ++
Tool status (Up‐time, ISP) ‐‐ ++ ++
Integration status (commits/broken builds) ‐‐ ++ ++
Depth of using measures
(degrees of acceptance)
Breadth of using measures
(types of measures)
Behavior
(knowledge of)
Performance
(to which degree
the behavior is 
performed) 
Preference
(like or dislike)
Normative 
consensus
(appropriateness)
Value
(good or bad 
behavior)
Current status
Potential
Used Good practice Low hanging fruits
Beyond Agile Measures
Autonomous AI based measurement systems
• Autonomous AI based measurement systems
• AI based measures discovery
• Automated minig of sw measures
• Low-code/no-code sw development programs
• In-tools sw measurements
Autonomous AI-based measurement
Learning code quality from Gerrit
• Problem
– How can we detect violations of coding styles in a dynamic
way?
 Dynamic == the rules can change over time based on
the team’s programming style
• Solution at a glance
– Teach the code counter to recognize coding standards by
analyzing code reviews
– Use machine learning as the tool’s engine to define the
formal rules
– Apply the tool on the code base to find violations
• Results
– 75% accuracy
Violations
Gerrit reviews
Product 
code base
Deep 
learning
Work done together with M. Ochodek and R. Hebig
Machine 
assessment
Feature acquisition
33
File type #Characters If …
Decision
class
java 25 TRUE … Violation
… … … … …
Feature engineering
and extraction engine
Source code: training set
Source code: ML encoded training set
Data set expansion:
Ca. 1,000 LOC ‐> 180,000 LOC
Input 
layer
…………………………………….…
Recurrent
layer
…………………………………….…
Convolution
layer
………………………….…
Recognize 
low level patterns 
(e.g. non‐standard ”for”)
Output 
layer
Recognize 
high level patterns 
(e.g. non‐compiled code)
90% probability of violation
9.9% probability of non‐violation
0.1% probability of undecided
Encoded lines
Using deep learning to find patterns
180,000 lines of Gerrit 
reviews
Results Recurrent NN
Layer (type)                 Output Shape              Param #    
================================================================= 
input (InputLayer)           (None, 6000)              0          
_________________________________________________________________ 
embedding_1 (Embedding)      (None, 6000, 50)          7650        
_________________________________________________________________ 
conv1d_1 (Conv1D)            (None, 6000, 32)          4832        
_________________________________________________________________ 
max_pooling1d_1 (MaxPooling1 (None, 3000, 32)          0          
_________________________________________________________________ 
conv1d_2 (Conv1D)            (None, 3000, 32)          3104        
_________________________________________________________________ 
max_pooling1d_2 (MaxPooling1 (None, 1500, 32)          0          
_________________________________________________________________ 
conv1d_3 (Conv1D)            (None, 1500, 32)          3104        
_________________________________________________________________ 
max_pooling1d_3 (MaxPooling1 (None, 750, 32)           0          
_________________________________________________________________ 
conv1d_4 (Conv1D)            (None, 750, 32)           3104       
_________________________________________________________________ 
max_pooling1d_4 (MaxPooling1 (None, 375, 32)           0          
_________________________________________________________________ 
conv1d_5 (Conv1D)            (None, 375, 32)           3104       
_________________________________________________________________ 
dropout_1 (Dropout)          (None, 375, 32)           0          
_________________________________________________________________ 
conv1d_6 (Conv1D)            (None, 375, 2)            66         
_________________________________________________________________ 
activation_1 (Activation)    (None, 375, 2)            0          
_________________________________________________________________ 
global_average_pooling1d_1 ( (None, 2)                 0          
_________________________________________________________________ 
loss (Activation)            (None, 2)                 0          
================================================================= 
Total params: 24,964 
Trainable params: 17,314 
Non‐trainable params: 7,650 
Conclusions
• What does agile offer?
– Customer focused software development
– Faster delivery of new features
– Higher quality
• How can we get there?
– Aligning software measurement with agile software development
– Monitor what agile does not explicitly focus on, e.g. stability of architectures
– Use modern software measurement technologies and dynamic, actionable dashboards
• What does the future holds?
– AI and autonomous measurement systems
– Assisting developers in software development through self-x measurement systems
– Evolving, pro-active measurement systems
Measuring Agile Software Development

Measuring Agile Software Development