1. NNOORRTTHHWWEESSTT MMIINNEERRAALL MMEEXXIICCOO SS..AA.. ddee CC..VV..
2007 EXPLORATION RESULTS FOR THE LOS COCHIS
BULK- TON SILVER-ZINC PROSPECT, and 2008
EXPLORATION BUDGET, “PICACHOS” PROPERTY, SAN
DIMAS, DURANGO, MEXICO
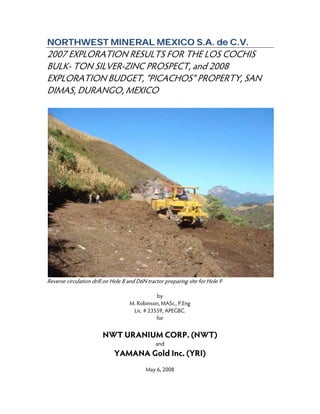
Reverse circulation drill on Hole 8 and D6N tractor preparing site for Hole 9
by
M. Robinson, MASc., P.Eng
Lic. # 23559, APEGBC.
for
NWT URANIUM CORP. (NWT)
and
YAMANA Gold Inc. (YRI)
May 6, 2008
2. PICACHOS 2007 TECHNICAL REPORT
NORTHWEST MINERAL MEXICO S.A. DE C.V.
2
1.0 SUMMARY..................................................................................................................... 4
2.0 INTRODUCTION AND TERMS OF REFERENCE ............................................................ 6
3.0 DISCLAIMER.................................................................................................................. 6
4.0 PROPERTY DESCRIPTION AND LOCATION ................................................................ 6
5.0 ACCESSIBILITY, CLIMATE, LOCAL RESOURCES, INFRASTRUCTURE AND
PHYSIOGRAPHY................................................................................................................. 9
6.0 HISTORY....................................................................................................................... 9
7.0 GEOLOGICAL SETTING............................................................................................... 11
7.1 REGIONAL GEOLOGY ......................................................................................................................................... 11
7.2 GEOLOGY OF THE PICACHOS PROPERTY ....................................................................................................... 13
7.3 LOS COCHIS........................................................................................................................................................ 14
Rhyolite Tuff (Unit 10BFX).............................................................................................................................14
Andesitic flows or dikes (Unit 11C).............................................................................................................14
Andesitic wackes (Unit 1C) ............................................................................................................................15
Quartz feldspar porphyritic monzonite dikes (Unit 21)...................................................................... 15
8.0 DEPOSIT TYPES--INTERMEDIATE SULFIDATION EPITHERMAL AG-AU DEPOSITS . 16
9.0 MINERALIZATION ...................................................................................................... 17
9.1 LOS COCHIS......................................................................................................................................................... 18
9.2 EL PINO................................................................................................................................................................. 20
9.3 GUADALUPE ......................................................................................................................................................... 23
10.0 EXPLORATION.......................................................................................................... 25
10.1 SOIL GEOCHEMISTRY....................................................................................................................................... 25
10.2 3-D IP, RESISTIVITY AND MAGNETIC SURVEY ............................................................................................. 27
11.0 REVERSE CIRCULATION DRILLING .......................................................................... 30
11.1 SITE PREPARATION AND MOBILIZATION...................................................................................................... 30
11.2 RC DRILLING RESULTS..................................................................................................................................... 31
11.2.1 Calasancio (Section 18000E)............................................................................................................33
11.2.2. Calerita (Section 18100 E) ...............................................................................................................34
11.2.3 La Tolva (Section 18200E)................................................................................................................36
11.2.4 Reyes (Section 18300E).....................................................................................................................37
11.2.5 Hole 13 (Section UTM 419 390E).................................................................................................38
11.2.6 El Fresno (Section 18400E)..............................................................................................................39
11.2.7 Canuto (Section 18500E).................................................................................................................40
11.2.8 Andres (Between Sections 18900 E and 18800E) ...................................................................41
SAMPLING METHOD AND APPROACH............................................................................ 43
12.1 SOIL SAMPLES.................................................................................................................................................... 43
12.2 SURFACE AND UNDERGROUND ROCK SAMPLES.......................................................................................... 43
12.3 DRY RC DRILLING............................................................................................................................................. 44
3. PICACHOS 2007 TECHNICAL REPORT
NORTHWEST MINERAL MEXICO S.A. DE C.V.
3
12.4 WET RC DRILLING ........................................................................................................................................... 44
13.0 SAMPLE PREPARATION, ANALYSIS AND SECURITY............................................... 44
14.0 DATA VERIFICATION ............................................................................................... 45
15.0 ADJACENT (INTERNAL) PROPERTIES ...................................................................... 45
16.0 MINERAL PROCESSING AND METALLURGICAL TESTING....................................... 45
17.0 MINERAL RESOURCE AND MINERAL RESERVE ESTIMATES.................................... 45
18.0 OTHER RELEVANT DATA AND INFORMATION...................................................... 45
19.0 INTERPRETATION AND CONCLUSIONS ................................................................. 45
20.0 RECOMMENDATIONS .............................................................................................. 47
21.0 REFERENCES.............................................................................................................. 59
LIST OF FIGURES
Fig. 4.1 Map showing the location of the Picachos Property............................................................................7
Fig. 4.2 Map of the Picachos Property Concessions............................................................................................8
Fig. 7.1 Regional Geology of the Western SMO province............................................................................. 12
Fig. 7.2. Stratigraphy of two siliceous volcanic centers in the Mexican Ignimbrite Belt........................13
Fig. 7.3. Surface geological map of the Picachos Property............................................................................ 14
Fig. 7.4 Photomicrograph of least-altered rhyolite tuff................................................................................... 15
Fig. 7. 5. Photomicrograph of andesitic flow....................................................................................................... 15
Fig. 7.6 Photomicrograph of Unit 1C..................................................................................................................... 15
Fig. 7.7 Photomicrograph of quartz-feldspar porphyritic monzonite dike.............................................. 15
Fig. 9.1. Map of Los Cochis ....................................................................................................................................... 19
Fig. 9.2 El Fresno........................................................................................................................................................... 20
Fig. 9.3. La Chivas. ........................................................................................................................................................ 20
Fig. 9.4 Propylitic altered andesite......................................................................................................................... 20
Fig. 9.5 Photo of roughly flat-lying sphalerite manto....................................................................................... 20
Fig. 9.6 Catalina showing of the El Pino Vein. ..................................................................................................... 21
Fig. 9.7.Upper Stope................................................................................................................................................... 21
Fig. 9.8. Prepared drill pads that were not drilled in 2003............................................................................ 21
Fig. 9.9 Photo of drill core from Hole Pino 2.. .................................................................................................... 21
Fig 9.11 Cross section of El Pino showing Diamond drill Holes 1 and 2.................................................... 23
Fig. 10.1. Map of silver geochemistry in soils for the Picachos Property................................................... 26
Fig. 10.3 Surface exposure of the lithocap that causes the strong IP response.. .................................... 28
Fig. 10.4 Photomicrograph of lithocap ................................................................................................................. 28
Fig.11.1. Photo of D6N tractor preparing Site #10......................................................................................... 30
Fig.11.2 Mobilization of Layne Drilling’s tire-mounted “buggy style” reverse circulation drill.......... 30
Fig. 11.3. Level plan of reverse circulation drill holes.................................................................................... 31
Fig. 11.4. Cross-section of COCH18 (Section 18000 E)................................................................................. 34
Fig. 11.5 Calerita: Section 18100 E, looking northwest.................................................................................. 36
Fig. 11.6. Section 18200, La Tolva......................................................................................................................... 37
4. PICACHOS 2007 TECHNICAL REPORT
NORTHWEST MINERAL MEXICO S.A. DE C.V.
4
Fig. 11.7 Section 18300, Reyes................................................................................................................................ 38
Fig.11.8. Microphotograph of sample 30795..................................................................................................... 38
Fig.11.9. Microphotograph of sample 30795..................................................................................................... 38
Fig. 11.10 Section 419 390 E.................................................................................................................................... 39
Figure 11.12 Cross-section of drilling results from Section 18500 E.......................................................... 41
Fig.11.13. Microphotograph of sample 31014.................................................................................................. 41
Fig.11.14. Microphotograph of sample 31053.................................................................................................. 41
Fig. 11.15. Cross-section Andres ........................................................................................................................... 42
Fig. 11.16. Photomicrograph of the mineralization in Hole 15 (sample 31229). .................................. 43
Fig. 20.2 Map of Drilling Plan for El Pino. ............................................................................................................. 50
Fig. 20.3. Cross-Section showing Proposed Holes 3 and 4........................................................................... 51
Fig. 20.5 Cross-Section of Proposed Holes Pino 6 to 11................................................................................ 54
Fig. 20.6 Cross-Section of Proposed Holes Pino 8 and 9. .............................................................................. 54
Fig. 20.7 Cross Section of Proposed Hole10...................................................................................................... 55
Fig. 20.8 Drilling Plan for Guadalupe..................................................................................................................... 56
Fig. 20.9 Cross Section of Proposed Hole 39..................................................................................................... 57
Fig. 20.10 Cross Section of Proposed Hole 40 .................................................................................................. 58
1.0 SUMMARY
The Picachos Property, in the southwestern part of the state of Durango, is centered about 100
km west-southwest of Durango City, and occurs north-northwest of the Durango--Mazatlán
highway about 8 km from Puerto Espinazo del Diablo (23o
43’ north, and 105o
48’ west; Fig. 4.1).
The Project area is in the Sierra Madre Occidental (SMO) Ignimbrite Belt, one of the largest silicic
volcanic fields in the world. The Belt is host to numerous epithermal gold and silver deposits such
as Tayoltita and Rosario. The Picachos Property occurs in the Zona Minera La Ventana, south of
Districto Minero Ventanas. The largest past producer in the immediate area is La Libertad with
300 000 tonnes of 0.6 g/t Au and 235 g/t Ag mined by Luismin between 1975 and 1985 along a
high-grade vein. Luismin defined a reserve on the Mala Noche vein of 326 000 tonnes of 365 g/t
Ag and 2.52 g/t Au, but they did not put the Project into production.
On the Picachos Property, four significant epithermal precious metal districts have been defined:
Guadalupe, El Pino, Los Cochis and El Toro. In 2005, Northwest Mineral Ventures completed a
regional-scale soil geochemical survey covering about 60% of the Property. Based on the results
of the survey, Los Cochis was selected as a priority target for its bulk-tonne potential and
straightforward logistics.
In late 2006 and early 2007, a 3-D IP and resistivity survey identified at least two chargeable
horizons, and several moderately chargeable zones of disseminated sulfide. Ore grade
mineralization is closely related to the resistivity features, whereas the strong chargeability occurs
in barren quartz-pyrite lithocaps that occur in permeable, reactive vitric tuff horizons.
In the fall of 2007, 3125.25 meters of drilling in 21 reverse circulation holes were completed,
mainly in the strong soil geochemical anomaly defined in 2005, and in one of the chargeability
5. PICACHOS 2007 TECHNICAL REPORT
NORTHWEST MINERAL MEXICO S.A. DE C.V.
5
anomalies. The samples were sent to ACME Laboratories 4 Dec. 2007, and the last certificate was
received 27 April 2008 (Table 1.1).
The drilling program was designed to test a “steeply dipping epithermal vein” model for Los
Cochis. The results actually imply that the principal control on the mineralization might be
stratigraphic. A second stage of reverse circulation drilling is recommended to better constrain
the geometry of the Los Cochis deposit as specified in the Figures of Section 11. The objective of
this stage of work would be to identify a body of about 600 meters strike length, 80 meters width
and 200 meters in the down-dip direction representing perhaps 27 million tonnes of mineralized
rock. Further work on the El Pino Vein is also recommended, as the exploration model implies a
steeply dipping high grade body on the order of 2.5 million tonnes, and most of the infrastructure
is already in place (road, camp and cement water tank). Finally, a few exploration holes on the
nearby Guadalupe deposit are also recommended to expand the development of this exciting
new precious metal camp. The drilling plan for a total of 5020 meters is in Table 20.1, and maps
are in Section 20. An additional 3.4 kilometers of road development are required for Los Cochis,
and about 800 meters for Guadalupe. Road development should start at least six weeks prior to
drilling. In addition to the drilling, air photography of the entire Property and detailed
topographic mapping of El Pino and Los Cochis should be completed. Overall costs of the work
are estimated at about $1.01 million.
Table 1.1 Principal Results from 2007 reverse circulation drill holes. Bulk tonne intercepts are in blue, and high-grade intervals are in
red.
HOLE_ID FROM
(meters)
TO
(meters)
Interval
(m)
Copper
(ppm)
Lead
(%)
Zinc
(%)
Silver
(g/t )
Gold
(ppb)
COCH1 0.00 15.20 15.20 55 0.11% 0.25% 9 3
COCH3 0.00 59.28 59.28 52 0.22% 0.48% 67 1
Including
COCH3 1.52 12.16 10.64 89 0.44% 0.90% 172 1
COCH3 18.24 27.36 9.12 141 0.66% 1.15% 198 1
COCH4 0.00 36.48 36.48 35 0.08% 0.23% 7 1
Including
COCH4 4.56 6.08 1.52 112 0.19% 0.99% 50 1
COCH6 0.00 72.96 38.00 65 0.17% 0.32% 50 1
Including
COCH6 1.52 16.72 15.20 171 0.54% 1.02% 196 1
COCH6 27.36 28.88 1.52 87 0.27% 0.60% 86 1
COCH8 130.72 147.44 16.72 329 0.36% 0.72% 74 25
Including
COCH8 138.32 141.36 3.04 1573 1.65% 3.11% 377 108
COCH8 185.44 218.88 33.44 237 0.55% 1.38% 34 383
Including
COCH8 186.96 190.00 3.04 373 0.33% 2.00% 32 85
COCH8 194.56 202.16 7.60 673 1.97% 4.51% 126 1528
COCH10 0.00 62.32 62.32 27 0.06% 0.16% 6 1
6. PICACHOS 2007 TECHNICAL REPORT
NORTHWEST MINERAL MEXICO S.A. DE C.V.
6
COCH13 0.00 62.32 62.32 55 0.15% 0.37% 36 1
Including 0.00% 0.00%
COCH13 0.00 3.04 3.04 122 0.23% 0.50% 65 1
COCH13 18.24 22.80 4.56 128 0.80% 1.49% 264 1
COCH15 6.06 7.58 1.52 283 0.28% 1.76% 8 127
COCH20 0.00 47.12 47.12 65 0.15% 0.27% 71 1
Including
COCH20 0.00 12.16 12.16 100 0.33% 0.61% 97 1
COCH20 22.80 24.32 1.52 116 0.28% 0.51% 95 1
COCH20 27.36 30.40 3.04 369 0.32% 0.24% 509 2
2.0 INTRODUCTION AND TERMS OF REFERENCE
This report was prepared by M. Robinson of Northwest Mineral Mexico S.A. de C.V. at the
request of Mr. Marek Kreczmer, President of NWT Uranium Corporation (NWT) to document the
exploration results of 2007. Annual Technical Reports are required under the terms of the
Agreement between NWT and YRI.
The author has been directly involved with most of the field operations on the Property since
1998. In late 2006 and 2007, geophysical surveys completed by SJ Geophysics were checked in
the field by the author. In the fall, M. Robinson directly supervised the reverse circulation drilling
campaign between 3 Nov. 2007 and 26 Nov 2007.
3.0 DISCLAIMER
The information, conclusions, opinions and estimates contained herein are based on information
available at the time of preparation of this report.
4.0 PROPERTY DESCRIPTION AND LOCATION
The Picachos Property, in the southwestern part of the state of Durango, is centered about 100
km west-southwest of Durango City, and occurs north-northwest of the Durango-Mazatlán
highway, about 8 km from Puerto Espinazo del Diablo (23o
43’ north, and 105o
48’ west; Fig. 1).
The Property consists of four concessions overlapping a contiguous surface area of 7778 Ha.
The concessions are owned by Minera Tango S.A. de CV. (“Tango”), a subsidiary of Seafield
Resources Ltd (SFF). Seafield purchased Minera Tango from Yamana Gold Inc. (YRI) 31 Dec. 2006.
NWT has the right to acquire a direct 70% interest in the Picachos property portfolio by: (i)
investing US$3,000,000 in exploration over three years, (ii) making cash payments in installments
totaling US$400,000.00 to YRI, and (iii) issuing 1,000,000 common shares (also to YRI) over a
three-year period.
7. PICACHOS 2007 TECHNICAL REPORT
NORTHWEST MINERAL MEXICO S.A. DE C.V.
7
Fig. 4.1 Map showing the location of the Picachos Property.
8. PICACHOS 2007 TECHNICAL REPORT
NORTHWEST MINERAL MEXICO S.A. DE C.V.
8
Fig. 4.2 Map of the Picachos Property Concessions. Camp is located at Las Aguilillas.
Mining concessions remain valid for 50 years from the date of title as long as bi-annual mining
duties are paid in July and January of every year, and minimum annual work requirements are met.
In 2008, mining duties of approximately $59,000 US are due in two installments, and the minimum
annual work requirement is approximately $500,000 US. As the concessions age, the duties and
work requirements increase according to schedules published by the Dirección General de Minas
every 6 months.
Table 4.1 Estimated schedule of tax payments required to maintain the Picachos Property (MEX $ PESOS).
Concession Title
Number
Title
Date
Surface
area in
Hectares.
Jan-Jun 2008 Jul-Dec
2008
Jan-Jun
2009
Jul-Dec
2009
Picachos 211194 11-Apr-
2000
4225.4414 $241,948.77 $241,948.77 $241,948.77 $241,948.77
Camargo 217367 9-Jul-2002 2561.871 $73,371.99 $73,371.99 $73,371.99 $73,371.99
Camargo-2 226380 13-Jan-
2006
865.6426 $5,955.62 $5,955.62 $ 5,955.62 $5,955.62
La Cruz 227828 22-Aug-
2006
122 $839.36 $839.36 $839.36 $839.36
Total in
Pesos
$322,115.74 $322,115.74 $322,115.74 $322,115.74
Total in US$ $29,551.90 $29,551.90 $ 29,551.90 $ 29,551.90
9. PICACHOS 2007 TECHNICAL REPORT
NORTHWEST MINERAL MEXICO S.A. DE C.V.
9
Table 4.2 Estimated minimum work requirements for the Picachos Property ($MEX PESOS).
Concession Title Date Surface area
in Ha.
2007 2008 2009
Picachos 11-Apr-00 4225.4414 $ 3,319,211.77 $ 3,319,211.77 $ 3,319,211.77
Camargo 9-Jul-02 2577.4593 $ 510,316.29 $ 2,026,584.05 $ 2,026,584.05
Camargo-2 15-Jan-06 865.6426 $ 83,077.10 $ 83,077.10 $ 83,077.10
La Cruz 22-Aug-06 122 $ 12,779.15 $ 12,779.15 $ 12,779.15
Total in Pesos $ 3,925,384.32 $ 5,441,652.07 $ 5,441,652.07
Total in US$ $ 360,127.00 $ 499,234.14 $ 499,234.14
There are no known environmental liabilities. Drilling and road building operations for Los Cochis
have been authorized by SEMARNAT under Permit Number SG/130. 2.1/001879. This Permit is
valid until 18 September 2010. Work outside the Los Cochis area requires additional permits, or
modifications to the existing permit.
5.0 ACCESSIBILITY, CLIMATE, LOCAL RESOURCES,
INFRASTRUCTURE AND PHYSIOGRAPHY
Access to the Property is via the Durango-Mazatlan highway, and a network of country roads that
links the villages of La Mesa, Huizar, La Ventana, Picachos, El Durazno, Neveros and Los
Desmontes. A 230 KV electrical transmission line runs parallel to Highway 40, and a branch line to
La Mesa de Los Negros. Rural satellite phones are installed in all of the villages. Water is readily
available from mountain streams that are re-charged in the summer rainy season between July and
October.
Elevations range from 1900 meters in the village of La Mesa to about 500 meters in the Rio Los
Tanques. Vegetation ranges from pine and oak above 1500 meters, to tropical brush and cactus
in the valleys. Cattle ranching, logging and subsistence farming are the main economic activities in
the region.
The rainy season is from July to September, with intermittent winter storms. Temperatures range
from freezing at higher elevations in the winter, to more than 45ºC in the valleys in summer.
The closest major city is the port of Mazatlán in southern Sinaloa, and the nearest industrial city is
Durango, Durango.
6.0 HISTORY
Picachos was one of the larger historic mining towns within Property and is located about 8 km
north of La Mesa de Los Negros. The Spanish reportedly built a smelter facility on the north bank
of the arroyo Picachos, just below one of the trails to the village of La Ventana. Smelter feed was
mainly from several stopes located in the El Toro target area, and perhaps from the mines on the
south flank of Copo El Pino (Pine Peak). Slag has also been found at a historic smelter site west of
the Las Chivas adit (Los Cochis area).
In 1997, Canamera Geological of Vancouver staked the 50, 000 Ha Flora concession. Between 20
April 1998 and 5 June 1998, over 200 rock samples were taken from the Flora claim. Of these, 151
occur within a caldera structure north of the Espinazo del Diablo on the northwest corner of the
10. PICACHOS 2007 TECHNICAL REPORT
NORTHWEST MINERAL MEXICO S.A. DE C.V.
10
Flora Property. In the summer of 1998, a reconnaissance-style soil geochemistry grid was
completed over Los Cochis, one of the most promising polymetallic epithermal precious metal
deposits in the caldera. A total of 116 rock samples and 489 soil samples were collected. The
program finished in November of 1998, but the assay results were never released from the lab
due to non-payment of assay bills incurred by Canamera on its Canadian projects.
In June of 1999, Minera Camargo was incorporated, and negotiations were opened with Eastern
Meridian Mining Corporation to start a joint venture in the Picachos area, a few kilometers north
of the Los Cochis prospects. During the negotiating period, the Picachos claim was staked. An
option agreement was signed with Eastern Meridian 31 July 1999.
Between 1 October 1999 and 25 February 2000, detailed mapping and sampling was done on the
larger stopes and tunnels, including El Toro, Los Angeles and El Pino. Overall, 135 chip-channel
samples were cut and sent to Bondar Clegg for analysis. All were fire-assayed for gold and silver,
and those with base metal mineralization were also assayed for Cu, Pb and Zn. Some of the best
overall results were from El Pino, where chip-channel samples from all three stopes imply an
average grade of 1.7 g/t Au and 364 g/t Ag across an average width of 7 m. Although El Pino had
clear potential to host a significant deposit, Eastern Meridian was unable to re-finance due to weak
precious metal prices. Their option agreement with Camargo defaulted 31 January 2002. In late
2001, the Flora Property was cancelled by the Mexican Government.
In March of 2002, Southern Africa Minerals and Minera Camargo started negotiating a deal for a
joint venture on the Picachos property, and the Camargo claim was staked as an addition to the
joint venture area. The Camargo Property hosts the Los Cochis and Guadalupe deposits (the Flora
title was cancelled in October of 2001 due to non-payment of mining duties). Southern Africa
Minerals changed its name to Tango Mineral Resources to reflect the new Latin American focus for
the Company.
In the summer of 2002, a limited soil sampling program was completed over the central part of the
El Pino deposit area, and additional prospecting was done along strike of the known vein. In the
fall, a permanent camp and road to the El Pino deposit was constructed, and two diamond core
holes were drilled to depths of 216 m and 171 m in early 2003. Although both holes intercepted
the vein, the drilling program was aborted pre-maturely due to mechanical problems with the drill.
The average result of two holes was 108 g/t Ag and 1.1 g/t Au across a true width of 4.2 m, and
continuity of the structure was proved for 70 meters down-dip. In late 2002, a deal was
negotiated with Chemex Laboratories to release the Los Cochis assays, and those results were
compiled in the first half of 2003. Geochemical results from El Pino and Los Cochis were clearly
starting to define the extents of several epithermal Districts on the Picachos Property.
Unfortunately, the lack of performance by the drillers did not deliver results, and Tango Mineral
Resources was taken over by RNC Gold in late 2003.
In early 2004, RNC Gold optioned the Property to Northwestern Mineral Ventures. To earn the
first 50%, NWT agreed to: (i) invest $500 000 in Year 1, (ii) $1,000,000 in Year 2, and (iii) produce
a feasibility study for a minimum of 25,000 ounces of gold per year. NWT hired Watts, Griffiths
and McOuat to write an NI-43-101 Report and recommend the Work program. Their main
recommendations were:
11. PICACHOS 2007 TECHNICAL REPORT
NORTHWEST MINERAL MEXICO S.A. DE C.V.
11
(i) Complete a Property-wide soil geochemical survey to provide continuity between the
different epithermal districts.
(ii) Explore the El Pino Vein by diamond drilling from an underground exploration adit.
(iii) Acquire LandSAT and IKONOS imagery to help identify regional controls on
mineralization.
(iv) Complete an airborne magnetometer survey, also to help identify structures and
intrusions of potential economic interest.
A budget of $526 000 was recommended to complete the work.
In late 2004, Northwest Mineral Ventures acquired the satellite imagery and Minera Camargo
started the Property-wide soil geochemical program on behalf of Northwestern. In May of 2005,
NWT announced it would be acquiring 100% of the Property from RNC for 100 000 shares, and
$20,000,000 (twenty million) USD in staged payments starting at feasibility. The soil geochemistry
was completed by June of 2005. About 2000 meters of hand-trenching under some of the
geochemical anomalies west of Guadalupe and across the Los Angeles Stope area was completed
in July 2005, prior to the summer rains. Results of the field work were evaluated over the summer,
and an exploration drilling campaign of about 8400 meters was proposed in October of 2005 to
test all four epithermal districts delineated as part of the soil geochemical program.
YRI took over RNC Gold in late 2005, and field work was suspended pending re-negotiation of all
the Agreements. In late 2006, NWT hired SJ Geophysics to complete a 3-D IP survey of Los
Cochis. Los Cochis was selected as a priority target as the logistics of working from La Mesa are
straightforward, and geochemical results from some outcrops imply the presence of disseminated
mineralization that may be amenable to bulk mining. The geophysical results were prepared by
March of 2007, and NWT authorized 3000 meters of reverse circulation drilling to test some of
the most compelling geochemical targets near the existing road 21 Sept 2007. The road required
to test the main geophysical anomalies would have required additional funds beyond the
$400,000 Budget specified by NWT for 2007.
7.0 GEOLOGICAL SETTING
7.1 REGIONAL GEOLOGY
The Picachos Property is in the Sierra Madre Occidental (SMO), one of the largest silicic volcanic
fields in the world. The Belt is host to numerous epithermal gold and silver deposits such as
Tayoltita and Rosario (Fig. 4.1). The SMO formed between the Cretaceous and the Tertiary when
the last remnants of the Farallon plate were consumed below the western margin of Mexico, and
the Sea of Cortez opened between Baja California and continental Mexico. The SMO consists of
five igneous complexes (Ferrari et al., 2005): (1) Late Cretaceous to Paleocene volcanic and
plutonic rocks, (2) Eocene rhyolites and andesites, (3) bimodal Oligocene ignimbrites (32-28 Ma)
and basaltic lavas, (4) bimodal Miocene ignimbrites (24-20 Ma) and basaltic lavas, and (5) late
Miocene bimodal alkaline basalts and ignimbrites. These new divisions are a modern refinement
of McDowell’s and Clabaugh’s (1979) work which divided the SMO into a “Lower Volcanic
Complex” dominated by andesitic rocks of Cretaceous to Tertiary ages deposited in a
compressive tectonic environment, and an “Upper Volcanic Series” of Oligocene to Miocene age
12. PICACHOS 2007 TECHNICAL REPORT
NORTHWEST MINERAL MEXICO S.A. DE C.V.
12
dominated by ignimbrites related to extensional tectonics. According to McDowell and Keizer
(1977), most of the mineralization of the SMO province was in the “Lower Volcanic Complex”
(Volcanic Complex 2 of Ferrari et. al, 2005). It is now recognized that all five Volcanic Complexes
are mineralized, and work is on-going to better understand the metallogeny of each Complex. In
the Property area, regional stratigraphic correlations imply that the geology of the Picachos
Property is similar to the geology of Tayoltita, one of the largest precious metal districts in the
world (Fig. 7.2).
Fig. 7.1 Regional Geology of the Western SMO province in the area of the Picachos Property.
13. PICACHOS 2007 TECHNICAL REPORT
NORTHWEST MINERAL MEXICO S.A. DE C.V.
13
Fig. 7.2. Stratigraphy of two siliceous volcanic centers in the Mexican Ignimbrite Belt. At Tayoltita, the Buelna andesite is a water-lain
tuff. At the Espinazo del Diablo, peperites and hyaloclastites in the feldspar-phyric ignimbrite and co-genetic La Ventana Flow-dome
complex indicate that part of the volcanic sequence there was also deposited subaqueously.
7.2 GEOLOGY OF THE PICACHOS PROPERTY
From the base upwards, units within the supracrustal rock column are: (i) densely feldspar
porphyritic andesite flows and breccias, (ii) feldspar-phyric felsic lapilli tuff, (iii) the La Ventana
flow-dome complex, and (iv) feldspar-phyric andesite flows and breccias. These rocks are
intruded by: (i) a quartz monzonite batholith, (ii) quartz-feldspar porphyry dikes and stocks, (iii)
clinopyroxene phyric diorite dikes, (iv) hornblende phyric diorite porphyry, (v) aphyric mafic
dikes, and (vi) quartz-phyric “ignimbrite dikes” (Fig. 7.3). Detailed descriptions of these lithologic
units are provided in Robinson, 2005. Los Cochis is hosted mainly in feldspar phyric andesitic
volcaniclastic rocks and flows with local intrusions of quartz-feldspar porphyritic monzonite.
14. PICACHOS 2007 TECHNICAL REPORT
NORTHWEST MINERAL MEXICO S.A. DE C.V.
14
Fig. 7.3. Surface geological map of the Picachos Property.
7.3 LOS COCHIS
Four geological units were intercepted in the drilling: (i) rhyolite tuff, (ii) andesitic flows or dikes,
(iii) andesitic volcaniclastics and wackes (iv), and quartz-feldspar porphyritic dikes.
RHYOLITE TUFF (UNIT 10BFX)
One horizon of rhyolite tuff about 25 meters thick was intercepted in Holes 15 (97.26-120.6 m),
19 (177.84-188.48 m), and 21 (60.8-121.6m). These rocks are composed of angular lapilli,
feldspar phenocrysts, pumice fragments and vitric shards. Spherulites and perlite, both de-
vitrification textures, are locally apparent. Volcanic glass is easily replaced by secondary minerals,
and this horizon is mostly replaced by quartz, phyllosilicates and pyrite (Holes 15 and 21). A
three-point solution of the top of the tuff horizon based on the drill hole intercepts yields a true
bedding orientation of 226º/48ºNW.
ANDESITIC FLOWS OR DIKES (UNIT 11C)
Andesitic flows or dikes are maroon when not altered, and green where altered to propylite in the
vicinity of mineralized zones. They are porphyritic, with 1-3% very small, sub millimeter sized
hornblende and feldspar phenocrysts. Amygdules filled with epidote, quartz and/or chlorite are
15. PICACHOS 2007 TECHNICAL REPORT
NORTHWEST MINERAL MEXICO S.A. DE C.V.
15
common in this unit, and not present in fragmental equivalents (e.g. Unit 1C). The thickest
intercept of Unit 11C occurs in Hole 9 (74.48-176.32 meters).
ANDESITIC WACKES (UNIT 1C)
Most of the host rocks to the Los Cochis deposit are immature to slightly re-worked wackes and
sandstones of the same composition as Unit 11C. The texture is most obvious in slightly altered
rocks where unaltered maroon fragments are supported in a muddy, silicified matrix of greenish
color (Fig. 7.7). In unaltered rocks, the matrix is also maroon, and it can be difficult to distinguish
the fragments.
Fig. 7.4 Photomicrograph of least-altered rhyolite tuff with
secondary silica between fragments. Sample 32052, Hole 19,
185.44-186.96 meters.
Fig. 7. 5. Photomicrograph of andesitic flow. Sample 31164, Hole
9, 91.2 to 92.72 meters.
Fig. 7.6 Photomicrograph of Unit 1C. Sample 31115, Hole 9,
19.76-21.28 meters.
Fig. 7.7 Photomicrograph of quartz-feldspar porphyritic
monzonite dike. Sample 31111; Hole 9; 13.68-15.2 meters.
QUARTZ FELDSPAR PORPHYRITIC MONZONITE DIKES (UNIT 21)
QFP dikes are most abundant in Hole 16 and the top of Hole 9 where they probably intrude a
major northwest trending fault zone. In this area, the dikes range from 1 meter to 10 meters thick.
No surface outcrops were found, mainly due to thick overburden in this area. The rocks are
characterized by 3-5% quartz phenocrysts 0.5 to 2 mm across, and small feldspar phenocrysts .5-2
mm long. The feldspars are mostly altered to clay, and the rock matrix is silicified to a white color.
16. PICACHOS 2007 TECHNICAL REPORT
NORTHWEST MINERAL MEXICO S.A. DE C.V.
16
8.0 DEPOSIT TYPES--INTERMEDIATE SULFIDATION
EPITHERMAL AG-AU DEPOSITS
Most of the known economic epithermal precious metal deposits occur in Tertiary volcanic rocks,
both in arcs and in post-arc extensional settings. Important characteristics of epithermal deposits
in general include:
(i) High grades of Au and Ag.
(ii) Anomalous concentrations of Sb, As, Hg, Pb, Zn, Cu, Mo and other metals.
(iii) Ore minerals include native gold, electrum, acanthite, tetrahedrite, ruby silver,
sphalerite, galena and chalcopyrite.
(iv) Gangue minerals include quartz, calcite, barite, clay, sericite, epidote.
(v) Most known deposits are vetiform, but stockworks, breccias and disseminated
deposits also occur.
(vi) They are associated with significant alteration zones (“color anomalies”) and lithocaps.
(vii) Exposure of ore zones is usually poor as the dominant dimension is down-dip or down
plunge of the ore shoot.
(viii) Minerals are deposited in open spaces, and have characteristic textures (e.g. colloform
banded and cockscomb textures are typical).
(ix) Alteration mineral assemblages indicate temperatures of deposition between 100 and
300ºC. Typical alteration types include: (i) proximal propylite, (ii) distal zones of clay
alteration and (iii) unmineralized, but related zones of steam-heated alteration or
“lithocaps”.
Several sub-classes of epithermal deposits are recognized (Hedenquist, 2000): (i) low sulfidation,
(ii) intermediate sulfidation and (iii) high sulfidation.
Table 8.1 Some defining characteristics of the different sub-classes of epithermal deposits (Hedenquist, 2000).
Low Sulfidation Intermediate Sulfidation High Sulfidation
Tectonics Extension Transpression-Neutral Compression
Host Rocks Bimodal rhyolite and basalt.
Alkalic rocks common.
Calc-alkalic to subalkaline
rhyodacite
Andesitic rocks
Fluids Near neutral, weakly saline
(<1% NaCl), high CO2, H2S
Moderately saline (10-20%
NaCl), somewhat acid
Variably saline (1-40%
NaCl), strong acid (pH=1)
Characteristic gangue
minerals
Illite, clay, chalcedony,
adularia, calcite
Sericite, quartz,
rhodochrosite, barite,
anhydrite
Residual quartz, alunite,
barite, anhydrite
Characteristic ore
Minerals
Gold, electrum, tellurides in
alkalic rocks.
Electrum, tetrahedrite,
sphalerite, galena.
Enargite, gold, tennantite.
Relationship to
intrusions
Distal, sometimes none. Magmatic fluids important. Magmatic fluids important.
Size of orebodies 100-300 m deep (small) Up to 1200 meters deep
(robust)
Mostly small high grade
bodies, but some large
disseminated bodies.
Examples Sleeper, Hishikari Comstock, Tayoltita El Indio, Yanacocha
The Picachos Property overlaps rhyodacitic rocks of the SMO province, and is considered to have
significant potential for intermediate sulfidation epithermal Ag-Au deposits.
17. PICACHOS 2007 TECHNICAL REPORT
NORTHWEST MINERAL MEXICO S.A. DE C.V.
17
9.0 MINERALIZATION
Over 100 prospects and mine workings occur on the Picachos Property, but most historic
production is from El Toro, Guadalupe, Buenas Aires, La Tolva, Los Angeles, Las Palomas and El
Pino (Table 9.1). Most of these workings have been mapped, sampled and documented in
previous Reports (Robinson 2000, 2002, 2005). Mineralization along the El Toro Fault corridor is
polymetallic, with significant lead, zinc and copper values as well as gold and silver. To the east,
the Guadalupe and El Pino Veins mainly carry gold and silver as native gold, electrum and
acanthite, with very little pyrite or other base metal sulfides. Only targets drilled on 2007 or
slated for drilling in 2008 are discussed briefly here.
Table 9.1. List of historic mine workings and results from chip-channel sampling.
Name Type of
Working
Length
(m)
Tonnes Mined
(ESTIMATED)
Vein
Orientation
Width1
No. of
Samples
Au
g/t
Ag
g/t
Pb
%
Zn
%
Magistral Small Stope 18 500 235º/65º
NW
1 2 1.1 777 2.1 1.9
Macedonio I Prospect 4 20 245º/78º
NW
0.6 1 5.2 560 N/A N/A
Mina de La Paz Open Stope 22 1500 236º/75º
NW
0.3 1 0.7 639 0.1 0.3
Macedonio II Prospect 10 60 237º/57º
NW
0.5 1 0.2 185 0.3 0.2
El Cochi Prospect 6 30 251º/68º
NW
0.5 1 0.3 59 2.9 3.2
Santa Anita Prospect 12 250 230º/52º
NW
2.5 4 2.2 94 <0.1 <0.1
La Escondida Small Stope 8 200 264º/74º
NW
1.8 4 0.5 55 0.3 0.4
La
Descubriadora
Exploration
Tunnel
38 240 N/A N/A 1 - 2.3 - -
Surface Pit Surface Mine 20 800 045º/75º SE 1.3 2 1 157 N/A N/A
(Main Vein)
Surface Pit Prospect N/A N/A 328º/45º NE 4.6 2 0.7 196 N/A N/A
(Veta Polin)
Los Angeles Open Stope 41 12 000 042º/80º SE 2.7 3 0.5 214 0.2 0.02
(Main Vein)3
La Chinakatera Exploration
Tunnel
194 1300 250º/75º
NW
10 6 3.1 94 0.34 0.29
El Carrizal Exploration
Tunnel
81 500 045º/62º SE 1.2 6 0.2 35 0.15 0.24
Los
Murciélagos
Open Stope 27 800 265º/35º
NW
3.5 1 0.3 173 1.28 1.23
034º/80º SE
Las Palomas3
Open Stope 32 7 000 240º/70º
NW
2.5 3 0.1 46 N/A N/A
El Toro Open Stope 58 16 500 240º/75º
NW
>4.24
7 1.2 501 0.08 0.1
El Toro
Prospects
6 Prospects
in > 100 m
wide zone
34 200 210º to 263º/
steep NW
dip
0.7 3 0.6 300 0.07 0.06
18. PICACHOS 2007 TECHNICAL REPORT
NORTHWEST MINERAL MEXICO S.A. DE C.V.
18
Prospecto del
Mundo
Prospect 4 10 245º/90º 0.7 1 0.4 145 0.19 0.11
Veta de la Niña Prospect 8 50 242º/77º
NW
1.5 1 6.8 471 1.58 0.02
Los Pajaritos Prospect 12 160 215º/75º
NW
1.5 1 0.4 42 0.03 0.04
Prospecto 4900 Prospect 12 220 024º/84º SE 1.7 1 0.4 76 0.58 0.06
Mina de la Luz Surface pit N/A N/A 205º/50º
NW
0.4 1 0.6 531 1.78 0.02
Main Stope Open Stope 52 5000 350º/80º NE 3.5 5 0.7 205 N/A N/A
Upper Stope Open Stope 21 1800 340º/70º NE >5.2 5 2.6 462 N/A N/A
El Pino
Exploration
Tunnel
Exploration
Tunnel
55 350 N/A 1.5 N/A -- -- N/A N/A
Test Pit #1 Prospect 4 30 350º/85º NE 1.5 1 11.1 810 N/A N/A
Test Pit #2 Prospect 2 2 350º/85º NE 1.8 1 <0.17 28 N/A N/A
Prospect #3 Prospect 4 30 340º/78º NE 2 1 0.5 42 N/A N/A
Prospect #1 Small
prospect
tunnel
10 90 345º/70º NE 3 1 5.9 508 N/A N/A
El Pino Trench Prospect 6 65 346º/65º NE 1.8 1 0.9 94 N/A N/A
Guadalupe
North Stope
Access
Tunnel,
Open Stope
77 2000 350º/65º NE 1.1 6 2.2 609 N/A N/A
Guadalupe
South Stope
Open Stope 75 8100 340º/60º NE 1.2 6 3.1 565 N/A N/A
La Gloria Prospect N/A N/A 50º/68º NE 1.2 2 8 53 0.8 6.4
La Tolva Access
Tunnel,
Open Stope
78 2000 290º/86º NE 1.2 1 N/A 169 0.74 0.58
El Fresno Open Stope 56 2100 290º/60º NE 13 25 N/A 303 0.47 0.64
Las Chivas Access
Tunnel and
stopes
97 2000 295º/70º NE 47 41 N/A 72 0.47 1.4
Buenas Aires Open Stope 50 8100 340º/70º NE 1.2 1 2.1 416 N/A N/A
TOTAL 1243 38,757
9.1 LOS COCHIS
Historic production from Los Cochis perhaps totals 6000 tonnes between El Fresno, La Tolva and
Las Chivas mines. Recent work, however, has shown that the best silver grades do not always
occur in the base-metal rich veins targeted by the gambusinos, but often occur in incipiently
altered wall rocks. Specifically, results in excess of 300 g/t Ag have been obtained from samples
cut across clay-altered zones with no veining at El Fresno, El Pinito and the Tajos de Don Canuto
(Fig 9.1 and 9.2).
19. PICACHOS 2007 TECHNICAL REPORT
NORTHWEST MINERAL MEXICO S.A. DE C.V.
19
Fig. 9.1. Map of Los Cochis showing the principal historic workings, silver-in-soil>5 ppm (DASHED line), lead-in-soil >100 ppm (RED line)
and near-surface resistivity anomalies (BLUE DASHED lines).
20. PICACHOS 2007 TECHNICAL REPORT
NORTHWEST MINERAL MEXICO S.A. DE C.V.
20
Fig. 9.2 El Fresno. A sample cut across the back of the adit (above
the geologist) yielded values of 915 g/t Ag, 0.7% Pb, 0.2% Zn and
0.03% Cu across 2 meters (sample P009).
Fig. 9.3. La Chivas. A continuous chip-channel sample of the entire
adit averages 54 g/t Ag, 1% Zn and 0.3% Pb/46m
Fig. 9.4 Propylitic altered andesite cross-cut by poorly developed
discontinuous stock work veinlets of quartz-carbonate with traces
of galena, sphalerite, and sulfosalt exposed in a small creek west
of El Fresno. A 2.5 meter wide chip-channel sample across this
outcrop grades 97.2 g/t Ag, 1.4% Zn, 0.4% Pb and 0.03% Cu
(sample P011).
Fig. 9.5 Photo of roughly flat-lying sphalerite manto exposed on
the southwest bank of the Arroyo Los Cochis. This style of
mineralization was exposed in a hurricane in 2001.
9.2 EL PINO
El Pino is a major vein-breccia system hosted in andesitic fragmental rocks that outcrops locally
from the ridge leading to Copo El Pino at 1670 m elevation more than 1200 m along strike to the
arroyo Faisan at 950 m elevation. Historic production at El Pino comes from a vertical open stope
on the steep south flank of Copo El Pino (Pine Peak). The stope is about 50 m long and is accessed
on three levels centered at about 1500 meters elevation over a vertical elevation range of 40 to
50 meters. At these levels, the vein is actually a multi-stage breccia with large blocks of potassic-
altered andesite in a dense network of anastomosing cockscomb and colloform quartz veins. The
geometry is typical of a high-level epithermal deposit open to surface.
Chip-channel samples from all three stopes imply an average grade of 1.7 g/t Au and 364 g/t Ag
across an average width of 7 m. Within the overall structure, there are higher grade zones
characterized by a higher percentage of quartz veining. For example, sample 4483 from the
Upper Stope returned values of 578 g/t Ag and 4.9 g/t Au across 2.3 m.
21. PICACHOS 2007 TECHNICAL REPORT
NORTHWEST MINERAL MEXICO S.A. DE C.V.
21
Two holes totaling 387 of 1000 planned meters were diamond drilled in early 2003. However,
the initial drill program was never completed due to a series of mechanical problems with the rig.
Fig. 9.6 Catalina showing of the El Pino Vein. Matt Gray’s sample
returned values of 611 g/t Ag, 9.4 g/t Au across 2 m (P005).
Fig. 9.7.Upper Stope. Sample 4483, cut below the red line,
carries 578 g/t Ag and 4.9 g/t Au across 2.3 m
Fig. 9.8. Prepared drill pads that were not drilled in 2003. Fig. 9.9 Photo of drill core from Hole Pino 2. This intercept
carries 163 g/t Ag and 1.3 g/t Au across 4.2 m, and proves
continuity of one of the structures for more than 70 meters down-
dip.
The potential of El Pino is considerable. Mineralization has been mapped on surface over a strike
length of about 500 m. Assuming an average width of 5 meters for one of the veins, and down-dip
extent of 400 meters, a body of 2.5 million tonnes of high-grade silver and gold is implied.
22. PICACHOS 2007 TECHNICAL REPORT
NORTHWEST MINERAL MEXICO S.A. DE C.V.
22
Fig. 9.10 Plan Map of El Pino showing historic workings, drill holes and road that was built in 2003.
23. PICACHOS 2007 TECHNICAL REPORT
NORTHWEST MINERAL MEXICO S.A. DE C.V.
23
Fig 9.11 Cross section of El Pino showing Diamond drill Holes 1 and 2.
9.3 GUADALUPE
The Guadalupe oreshoot is partly exposed by two small underground stopes 200 m apart. The
North stope is accessed by a 50 m long tunnel driven to the east, whereas the South stope was
driven along a fault that marks the trace of the vein from surface. Eight channel samples across
24. PICACHOS 2007 TECHNICAL REPORT
NORTHWEST MINERAL MEXICO S.A. DE C.V.
24
both stopes yield average values of 3.2 g/t Au and 808 g/t Ag across an average width of 1.4 m.
Values of up to 28.9 g/t Au and 2628 g/t Ag across 0.25 m occur in smaller, sub-parallel structures
within a few meters of the main vein (e.g. Veta Cocina). The vein is hosted in propylitic-altered
andesite with some potassium feldspar in the vein envelope. Ore minerals are mainly electrum,
specularite, pyrite and acanthite, and generally comprise less than 2% of the rock. Soil samples
taken above the Guadalupe oreshoot have precious metal values of 5-40 ppb Au and 4 to 9 ppm
Ag.
Soil sampling and rock sampling results show that the Guadalupe Vein is just one of several
northwest trending veins within a broad, easterly trending silver-in-soil anomaly that extends for
more than 2 kilometers between the Arroyo Los Rincones and the Arroyo Las Vegas. The
oreshoots do not actually outcrop on surface, but the locations of the Buenas Aires and
Guadalupe oreshoots are known from underground workings, and the occurrence of at least two
additional veins at depth are implied by anomalous silver concentrations in rock samples from
surface.
Fig. 9.12 Map of the Guadalupe group of veins.
25. PICACHOS 2007 TECHNICAL REPORT
NORTHWEST MINERAL MEXICO S.A. DE C.V.
25
10.0 EXPLORATION
10.1 SOIL GEOCHEMISTRY
As recommended by WGM, a regional-scale soil survey was undertaken over about 60% of the
Picachos property in 2005 both to: (a) prospect parts of the property with little or no geological
information, and (b) better define and characterize the mineral potential of the hydrothermal
centers already identified at El Pino, El Toro, Los Cochis and Guadalupe. Figure 10.1 shows the
extent of the survey. As expected from the rock geochemistry, Los Cochis and El Toro are
characterized by high base metal as well as precious metal concentrations in soil, whereas El Pino
and Guadalupe are delineated mainly by anomalous Ag-Au values in soil. Detailed results of the
survey are discussed in Robinson, 2005.
Table 10.1. Summary results for 10096 soil samples from the Picachos Property.
ELEMENT Maximum Mean ACA* Mode 50th
75th 90th
95th
98th
Mo_ppm 109.1 1.2 1.1 0.4 0.6 1.0 2.3 4.0 7.3
Cu_ppm 1695.85 16.0 68.1 7.0 12.1 19.9 29.2 38.3 55.1
Pb_ppm 27300 91.0 10.0 16.0 25.7 55.1 143.8 300.6 697.3
Zn_ppm 4440 141.4 79.0 81.0 86.0 131.0 232.0 396.6 836.1
Ag_ppm 1780 1.7 0.1 0.1 0.4 0.9 2.2 4.1 8.5
Mn_ppm 23711 1385.5 1100.0 0.0 1068.0 1652.3 2716.5 3749.5 5312.0
As_ppm 635.3 17.4 11.0 10.0 11.3 19.6 35.6 50.9 75.5
Au_ppb 2424 7.8 3.0 0.5 1.8 4.8 12.0 24.7 58.0
Cd_ppm 51.5 1.0 1.3 0.1 0.3 0.7 2.0 3.7 7.8
Sb_ppm 832.27 2.1 1.3 0.6 1.1 2.0 3.3 5.2 8.9
Bi_ppm 32.6 0.4 1.2 0.1 0.1 0.3 0.8 2.0 2.0
Ba_ppm 2317.1 173.3 340.0 120.0 139.0 208.0 315.7 401.0 525.0
26. PICACHOS 2007 TECHNICAL REPORT
NORTHWEST MINERAL MEXICO S.A. DE C.V.
26
Fig. 10.1. Map of silver geochemistry in soils for the Picachos Property. El Toro is the largest anomaly with a core area of more than 2.5
km2
.
27. PICACHOS 2007 TECHNICAL REPORT
NORTHWEST MINERAL MEXICO S.A. DE C.V.
27
Table 10.2. Summary of exploration data for four significant epithermal precious metal districts on the Picachos Property.
El Toro El Pino Los Cochis Guadalupe
Area of core anomaly in
km2
2.5 0.5 1 0.5
Avg. metal values in core
anomaly area
7.7 ppm Ag
53.3 ppb Au
414 ppm Pb,
366 ppm Zn
3.6 ppm Ag
19.9 ppb Au
118 ppm Pb,
97 ppm Zn
26.1 ppm Ag,
11 ppb Au,
1045 ppm Pb,
921 ppm Zn
5.0 ppm Ag
25 ppb Au
68 ppm Pb,
175 ppm Zn
Avg. Ag/Au ratio in soils 145 546 2439 200
Best gold value in soil 2424 ppb Au 171 ppb Au 641 ppb Au 436 ppb Au
Best gold value in rocks 17 g/t Au/1.4 m 9.4 g/t Au/2 m 3.9 g/t Au/2 m 62 g/t Au/0.15m
Best silver value in soil >100 ppm Ag 13.2 ppm Ag 1696 ppm Ag 23.7 ppm Ag
Best silver value in rocks 1080 g/t Ag/1.3m 611 g/t Ag/2 m 954 g/t Ag/3.5 m 4653 g/t Ag/0.2 m
Deposit Geometry Sheeted Vein
Complex
2 subparallel
epithermal vein
breccia zones
Manto 4 subparallel
epithermal veins and
breccia zones
10.2 3-D IP, RESISTIVITY AND MAGNETIC SURVEY
In the fall of 2006, a 3-D Induced Polarization (IP) and Resistivity survey was undertaken for
Northwestern Mineral Ventures Inc. by SJ Geophysics Ltd. of Vancouver, B.C. The survey area
consisted of two grids, Los Cochis and Guadalupe. The IP survey area at Los Cochis consisted of
25 northeast trending lines with 100m spacing and with line length of 1800m. On the Guadalupe
grid, there are 5 northeast trending lines with 100m line spacing and with a line length of 950m. IP
data collection finished 6 December 2007, and magnetic data was collected on just the Los Cochis
Grid between12 and 24 February 2007.
Figure 10.2 is a level plan of inverted chargeability values plotted 75 meters below topography.
The range of inverted chargeability values measured at Los Cochis is between 2 and 24 ms
(moderately to weakly chargeable). Drilling in the vicinity of Don Andres has proven that the
anomaly is co-incident with vitric tuff horizons that have been replaced by quartz, calcite and
pyrite. On Figure 10.2, structure contours on the top of the vitric tuff horizon were intersected
with the topography, and the result almost perfectly matches the strong IP anomaly. A second
strong IP anomaly occurs in the vicinity of La Tijera and El Cobre. Field traverses confirm that the
cause of this is also quartz-pyrite alteration.
Assays of drill hole intercepts of the altered tuff returned non-anomalous metal values. Zones of
quartz-pyrite alteration or “lithocaps” occur in epithermal camps where descending hydrothermal
fluids and gases condense—commonly at or near the water table, and rarely carry significant
precious metal.
The strongest silver geochemistry on the grid is co-incident with an area of moderate inverted
chargeability (6-7ms or blue-green on Fig. 10.2). Mineralization there is dominated by sphalerite,
galena and tetrahedrite, mainly as disseminations and stockworks. While pyrite is present, there is
much less in the principal mineral zone than in the lithocap.
28. PICACHOS 2007 TECHNICAL REPORT
NORTHWEST MINERAL MEXICO S.A. DE C.V.
28
Fig. 10.2. Map of inverted IP, Los Cochis Grid. 75 meter level plan with overlay of silver geochemistry in rocks. Chargeable areas are in
magenta, weak IP anomalies are in green. The purple dotted line is the outcrop pattern of the top of quartz-pyrite replaced vitric tuff
horizon determined by intersecting the calculated orientation of the horizon with the topography.
Fig. 10.3 Surface exposure of the lithocap that causes the strong IP
response. Photo taken 30 meters south of Don Andres. Sample
5698 , cut across this face, carries no significant metal values.
Fig. 10.4 Photomicrograph of lithocap in sample 32117 (Hole 21,
92.72-94.24)
Figure 10.5 is a plan of inverted resistivity values. The strongest feature on this map is the
northeast trending resistive zone between the chargeable horizons . This feature is co-incident
with a wide zone of quartz veining and brecciation. The average results of 21 chip-channel
samples from quartz veins within this zone are 205 ppb Au and 2.1 g/t Ag. Visually, the quartz is
29. PICACHOS 2007 TECHNICAL REPORT
NORTHWEST MINERAL MEXICO S.A. DE C.V.
29
white, with very “cool” colloform textures. Based on the mineralogy, this zone might have ore
potential 100 meters below surface, and possibly closer to 300 meters below surface.
Moderate resisitivity anomalies are at least partially co-incident with some of the best rock and soil
geochemistry on the Property. Average silver values of 298 g/t Ag, as well as 1.4% Pb, 2.3% Zn
and 625 ppm Cu occur in 80 rock samples within Area “A”, centered on Nacario. Colloform quartz
float on surface implies the elevated resistivity is due to silicification. Southeast of the historic
mine workings, there is no bedrock exposure as the area is covered by deep talus related to a
historic landslide, but geophysical data imply continuity of the zone at greater depth (Area “B”,
Fig. 10.5).
Other areas of known mineralization and geochemical response are perhaps better correlated to
weakly conductive clay-pyrite alteration. Some of these zones, such as that exposed between El-
Fresno and El Pinito (on the southwest edge of one resistivity feature) are very high grade, with
average values of 501 g/t Ag, 1.3% Zn, 0.9% Pb, and 454 ppm Cu in 45 rock samples from this
zone. Limited bedrock exposure shows that mineralization occurs in calcite-quartz barite patches
and veinlets (Fig. 9.4).
Fig. 10.3. Map of inverted resistivity, Los Cochis Grid. 75 meter level plan with overlay of silver geochemistry in rocks. Resistive areas
are dark blue, somewhat less resistive areas are yellow-magenta. The top of the high chargeability horizons are in purple.
30. PICACHOS 2007 TECHNICAL REPORT
NORTHWEST MINERAL MEXICO S.A. DE C.V.
30
11.0 REVERSE CIRCULATION DRILLING
11.1 SITE PREPARATION AND MOBILIZATION
A D6N tractor was mobilized to the Property 28 September 2007, prior to the end of the rainy
season. By 12 October, the 10 kilometer long section of road between the Highway and Camp
Aguilillas was repaired and upgraded. At camp, sites were prepared for additional buildings, and
the tractor moved on to the Los Cochis access roads and drill pads 14 October. At camp, a 4
room cabin was constructed next to the kitchen for office and bunk space. Construction was
mostly complete by 8 November 2007, although work on the camp continued throughout the
drilling period.
Fig.11.1. Photo of D6N tractor preparing Site #10. Fig.11.2 Mobilization of Layne Drilling’s tire-mounted “buggy
style” reverse circulation drill from the Highway to Los Cochis 2
Nov 2007.
All drilling was conducted, utilizing a “Buggy-type” reverse circulation drill rig contracted from
Layne de Mexico in Hermosillo, Sonora. Drilling was done with one shift per day, ranging in length
from 10.0-11.5 hours. About 30% of the drilling was conducted dry, with only air circulation.
Water injection was utilized where ground conditions or the abundance of groundwater
mandated the change. Drilling rates were extremely good, averaging about 135 meters per day.
A crew of 5 people were on the drill site to manage the overall sample collection effort.
Table 11.1. Collar location table for 21 reverse circulation holes at Los Cochis.
HOLE_ID WGS84_E WGS84_N ELEV
(m)
AZIMUTH DIP DEPTH_m Date_Started Date_Finished
COCH1 419378 2618570 1579 215 -80 145.92 Nov 8 2007 Nov 8 2007
COCH2 419385 2618572 1574 180 -50 133.76 Nov 9 2007 Nov 9 2007
COCH3 419388 2618431 1578 225 -50 139.84 Nov 6 2007 Nov 7 2007
COCH4 419476 2618515 1599 225 -50 191.52 Nov 5 2007 Nov 6 2007
COCH5 419378 2618570 1579 215 -55 145.92 Nov 7 2007 Nov 8 2007
COCH6 419387 2618433 1579 359 -90 91.2 Nov 10 2007 Nov 10 2007
COCH7 419336 2618490 1568 140 -50 103.36 Nov 14 2007 Nov 14 2007
COCH8 419677 2618439 1609 219 -45 267.52 Nov 17 2007 Nov 19 2007
COCH9 419737 2618341 1608 225 -45 176.32 Nov 20 2007 Nov 21 2007
31. PICACHOS 2007 TECHNICAL REPORT
NORTHWEST MINERAL MEXICO S.A. DE C.V.
31
COCH10 419513 2618414 1627 225 -49 228 Nov 3 2007 Nov 4 2007
COCH11 419598 2618492 1597 221 -45 158.08 Nov 14 2007 Nov 15 2007
COCH12 419598 2618492 1597 360 -90 188.48 Nov 15 2007 Nov 16 2007
COCH13 419391 2618431 1577 175 -50 97.28 Nov 9 2007 Nov 10 2007
COCH14 419233 2618571 1524 215 -50 139.84 Nov 12 2007 Nov 12 2007
COCH15 420026 2618234 1595 220 -45 121.58 Nov 21 2007 Nov 22 2007
COCH16 419753 2618516 1555 225 -45 179.36 Nov 22 2007 Nov 23 2007
COCH17 419538 2618615 1561 170 -45 66.88 Nov 11 2007 Nov 11 2007
COCH18 419256 2618687 1507 225 -50 145.92 Nov 13 2007 Nov 14 2007
COCH19 420069 2618341 1547 31 -45 190 Nov 24 2007 Nov 25 2007
COCH20 419392 2618429 1579 135 -60 85.12 Nov 10 2007 Nov 11 2007
COCH21 420062 2618333 1555 122 -45 121.6 Nov 25 2007 Nov 25 2007
Plan9 419593 2618662 1537 225 -45 8 Nov 11 2007 Abandoned
3125.5
Fig. 11.3. Level plan of reverse circulation drill holes. Cross-section lines are also shown.
11.2 RC DRILLING RESULTS
A total of 21 reverse circulation (RC) holes, representing 10,254 feet (3,125 meters), were drilled
in November 2007. Of the 21 holes drilled, 18 targeted the main silver soil geochemical anomaly
32. PICACHOS 2007 TECHNICAL REPORT
NORTHWEST MINERAL MEXICO S.A. DE C.V.
32
on seven lines spaced 100 meters apart, with most holes dipping to the southwest. Of particular
note, Holes COCH3, 6, 13 and 20 were drilled from the same location in four different directions
as a preliminary shape investigation of the orebody. Additionally, two holes tested an IP anomaly
located 250 meters east of the main zone while one hole (COCH15) tested a gold soil anomaly.
Highlights include a 47.1-meter intercept of 83 grams per tonne (g/t) silver and 0.84% combined
zinc-lead, which starts at surface. The richest silver intercept returned 509 g/t silver and 0.56%
zinc-lead over 3.0 meters. Significant gold and zinc-lead results included a 1.52-meter interval of
6.2 g/t gold, 348 g/t silver and 19.9% zinc-lead.
Table 11.2 Principal Results from 2007 reverse circulation drill holes. Bulk tonne intercepts are in blue, and high-grade is in red.
HOLE_ID FROM
(meters)
TO
(meters)
Interval
(m)
Copper
(ppm)
Lead
(%)
Zinc
(%)
Silver
(g/t )
Gold
(ppb)
COCH1 0.00 15.20 15.20 55 0.11% 0.25% 9 3
COCH3 0.00 59.28 59.28 52 0.22% 0.48% 67 1
Including
COCH3 1.52 12.16 10.64 89 0.44% 0.90% 172 1
COCH3 18.24 27.36 9.12 141 0.66% 1.15% 198 1
COCH4 0.00 36.48 36.48 35 0.08% 0.23% 7 1
Including
COCH4 4.56 6.08 1.52 112 0.19% 0.99% 50 1
COCH6 0.00 72.96 38.00 65 0.17% 0.32% 50 1
Including
COCH6 1.52 16.72 15.20 171 0.54% 1.02% 196 1
COCH6 27.36 28.88 1.52 87 0.27% 0.60% 86 1
COCH8 130.72 147.44 16.72 329 0.36% 0.72% 74 25
Including
COCH8 138.32 141.36 3.04 1573 1.65% 3.11% 377 108
COCH8 185.44 218.88 33.44 237 0.55% 1.38% 34 383
Including
COCH8 186.96 190.00 3.04 373 0.33% 2.00% 32 85
COCH8 194.56 202.16 7.60 673 1.97% 4.51% 126 1528
COCH10 0.00 62.32 62.32 27 0.06% 0.16% 6 1
COCH13 0.00 62.32 62.32 55 0.15% 0.37% 36 1
Including 0.00% 0.00%
COCH13 0.00 3.04 3.04 122 0.23% 0.50% 65 1
COCH13 18.24 22.80 4.56 128 0.80% 1.49% 264 1
COCH15 6.06 7.58 1.52 283 0.28% 1.76% 8 127
COCH20 0.00 47.12 47.12 65 0.15% 0.27% 71 1
Including
COCH20 0.00 12.16 12.16 100 0.33% 0.61% 97 1
COCH20 22.80 24.32 1.52 116 0.28% 0.51% 95 1
COCH20 27.36 30.40 3.04 369 0.32% 0.24% 509 2
33. PICACHOS 2007 TECHNICAL REPORT
NORTHWEST MINERAL MEXICO S.A. DE C.V.
33
11.2.1 CALASANCIO (SECTION 18000E)
Hole COCH18 was designed to test the strong silver-in-soil geochemistry northwest of the Los
Cochis workings. In particular, soil sample 55097 returned values of 2067 ppm Pb, 2265 ppm Zn
and 38.4 ppm Ag, metal values that are of direct economic interest. On surface, the anomaly area
is covered by overburden, and no sulfide or quartz float was apparent. A cross-section of the
inverted chargeability values implies the presence of a moderately dipping sulfide horizon rather
than a vein.
Hole 18 collared in weak mineralization hosted in andesitic volcaniclastic rocks (wackes), and
intercepted three zones with sparse pyrite and no obvious base metal sulfides:
• 27.1 g/t Ag, 0.022% Cu/1.52 m from 13.68 to 15.2 m
• 9.4 g/t Ag, 0.034% Cu/3.04 m from 28.88 to 33.44 m
• 22.8 g/t Ag, 0.038% Cu/1.52 m from 123.12 to 124.64 m
Based on the cross-section in Figure 11.4, Hole 18 did not intercept the source of the strong silver-
in-soil geochemistry. However, the anomaly might be explained by a gently dipping manto or
replacement horizon, as implied by the IP survey. PDH 28 is designed to test this possibility.
34. PICACHOS 2007 TECHNICAL REPORT
NORTHWEST MINERAL MEXICO S.A. DE C.V.
34
Fig. 11.4. Cross-section of COCH18 (Section 18000 E). Hole 18 was designed to test for a steeply dipping zone under the soil
geochemical anomaly as shown by the area between the red dashed lines. Anomalous soil samples in magenta. A manto, as implied by
the red dotted line, may actually be the cause of the geochemical anomaly.
11.2.2. CALERITA (SECTION 18100 E)
Hole COCH14 was drilled to test strong silver and base metal geochemistry in soil and rocks on a
small ridge west of La Tolva. Bedrock exposure is generally poor, but there are abundant quartz-
35. PICACHOS 2007 TECHNICAL REPORT
NORTHWEST MINERAL MEXICO S.A. DE C.V.
35
sulfide fragments in recessive-weathering, clay altered rock. A select sample of the sulfides carries
values of 709 g/t Ag, 5% Pb, 4.1% Zn and 0.3% Cu (sample 5219). A sample of the wall rocks that
deliberately excludes the sulfides carries values of 42.9 g/t Ag, 1.7% Zn and 0.22% Pb (sample
P012; Cambior, 2003).
Hole 14 collared into weakly disseminated sphalerite, but stayed in largely unmineralized andesitic
volcaniclastic rocks for the entire length. Near the bottom of the hole, there is a 13.8 meter long
intercept of propylitic alteration with weakly disseminated pyrite. No significant base metal
sulfides besides pyrite were observed, although zinc values are weakly anomalous.
As implied by Figure 11.5, a gently dipping manto would explain the spectacular surface
geochemistry and lack of results in Hole 14. Two short holes, PDH 26 and 27 are proposed to test
a flatter orientation for the mineralization.
36. PICACHOS 2007 TECHNICAL REPORT
NORTHWEST MINERAL MEXICO S.A. DE C.V.
36
Fig. 11.5 Calerita: Section 18100 E, looking northwest.
11.2.3 LA TOLVA (SECTION 18200E)
Holes Coch 1 and Coch 5 were targeted below the Tolva Open Stope and Campamento showing.
The Campamento showing is a stock work zone hosted in propylitic altered andesitic volcaniclastic
rocks. Values of 600 g/t Ag, 6.8% Zn and 2.5% Pb were returned from sample 4891, a 3 meter
37. PICACHOS 2007 TECHNICAL REPORT
NORTHWEST MINERAL MEXICO S.A. DE C.V.
37
long chip-channel sample across the zone. La Tolva is an adit about 75 meters long that has been
stoped out at the eastern end. Values of 169 g/t Ag, 0.57% Zn and 0.74% Pb were returned from
a 1 meter wide chip channel sample across the back of the adit.
The best results were from Hole 1, which intercepted 15.2 meters of 9.2 g/t Ag, 0.25% Zn and
0.11% Pb from surface. No evidence for a steeply dipping vein was found further downhole,
although disseminated pyrite and sphalerite occur in most samples.
Fig. 11.6. Section 18200, La Tolva. Anomalous soil samples are in magenta.
11.2.4 REYES (SECTION 18300E)
Holes 3, 4 and 6 were drilled to test an area of strong silver geochemistry in soil between the El
Pinito and Las Chivas prospects. Results were:
• Hole 3: 66.9g/t Ag, 0.48% Zn and 0.22% Pb/59.28 meters from surface
• Hole 4: 7.3 g/t Ag, 0.22% Zn and 0.06% Pb/36.48 meters from surface
• Hole 6: 49.6 g/t Ag, 0.32% Zn and 0.17% Pb/72.96 meters from surface.
The mineralization is not spectacular in appearance, and consists mostly of pale green, propylitic
altered andesite with perhaps 3% quartz-calcite-sulfide patches (Fig. 11.8).
38. PICACHOS 2007 TECHNICAL REPORT
NORTHWEST MINERAL MEXICO S.A. DE C.V.
38
Fig. 11.7 Section 18300, Reyes.
Fig.11.8. Microphotograph of sample 30795, Hole 3, 21.28 to 22.8
m. Mineralization consists of calcite-quartz-sulfide patches in
propylitic altered andesite.
Fig.11.9. Microphotograph of sample 30795, Hole 3, 21.28 to
22.8 m. This sample carries values of 202 g/t Ag, 1.1% Zn, 0.7%
Pb and 0.02% Cu. “SILVER” = an unidentified silver mineral.
11.2.5 HOLE 13 (SECTION UTM 419 390E)
Holes 13 and 20 were drilled from the same station as Hole 3, oriented to the south between El
Pinito and El Fresno (Hole 13), and to the southeast (Hole 20). Hole 13 intercepted 62.32 meters
of 36.0 g/t Ag, 0.37% Zn, 0.15% Pb from surface. Hole 20 intercepted 47.12 meters of 70.6 g/t Ag,
39. PICACHOS 2007 TECHNICAL REPORT
NORTHWEST MINERAL MEXICO S.A. DE C.V.
39
0.28% Zn and 0.15% Pb, including 1.52 meters of 924 g/t Ag, 0.31% Zn, 0.49% Pb and 0.07% Cu,
the best silver intercept in the 2007 drilling.
Fig. 11.10 Section 419 390 E. North-South section through Holes 13, 6 and 2.
11.2.6 EL FRESNO (SECTION 18400E)
Hole COCH10 was designed to test the down-dip potential of several high grade silver results
from various channel samples across the old El Fresno mine workings. Important surface results
include 2 m of 915 g/t silver cut across disseminated mineralization exposed by the adit (e.g. Fig.
9.2). Most structures exposed by the mine dip moderately to the northeast, and it was expected
that Hole 10 would intercept El Fresno at about 115 meters depth. However, if the mineralization
has a fairly flat geometry as implied by the previous Sections, then Hole 10 did not intercept the
target as intended, and additional drilling is warranted (PDH 24 and 29, Fig. 11.8).
40. PICACHOS 2007 TECHNICAL REPORT
NORTHWEST MINERAL MEXICO S.A. DE C.V.
40
Fig. 11.11. Cross-section of drilling results from Section 18400 E.
11.2.7 CANUTO (SECTION 18500E)
Hole 8 was designed to test under markedly anomalous silver geochemistry in soil with values as
high as 1740 ppm Ag. Two important zones were intercepted:
• Hole 8: 74g/t Ag, 0.72% Zn and 0.36% Pb/16.72 meters (130.72 m -147.44 m)
• Hole 8: 34 g/t Ag, 0.4 g/t Au, 1.38% Zn and 0.55% Pb/33.44 (185.44 m – 218.88 m).
The second interval contains 1.52 meters of 348 g/t Ag, 16.6% Zn, 3.4% Pb , 0.2% Cu and 6.21 g/t
Au across 1.52 m between196.08 and 197.60 meters depth (Fig. 11.11). In general, Hole 8 is
mineralized for most of its length, and values averaging 19.2 g/t Ag, 0.11 g/t Au, 0.51% Zn and
0.2% Pb occur over a 132.24 meter interval between 130.72 and 262.96 meters.
Initially, the mineralization was thought to be dipping northeasterly, but that possibility seems to
have been eliminated with Holes 16 and 19. Holes 30, 31 and 32 are proposed to better
constrain the geometry of the mineralization, and clarify whether a steeply dipping vein or manto
better models the shape of the mineralized body.
41. PICACHOS 2007 TECHNICAL REPORT
NORTHWEST MINERAL MEXICO S.A. DE C.V.
41
Figure 11.12 Cross-section of drilling results from Section 18500 E. Anomalous soil samples in magenta. Drillholes required to constrain
the geometry are PDH 30, 31 and 32.
Fig.11.13. Microphotograph of sample 31014, Hole 8, 138.32 to
139.84 m. Mineralization consists of calcite-quartz-sulfide in
propylitic altered andesite This sample contains 559 g/t Ag, 4.96%
Zn, 2.73% Pb and 0.2 g/t Au across 1.52 m.
Fig.11.14. Microphotograph of sample 31053, Hole 8, 196.08 to
197.60 m. This sample contains 348 g/t Ag, 16.6% Zn, 3.4% Pb ,
0.2% Cu and 6.21 g/t Au across 1.52 m.
11.2.8 ANDRES (BETWEEN SECTIONS 18900 E AND 18800E)
Three holes were drilled in the Andres area—Holes 15, 19 and 21. Hole 15 was positioned under
a 255 ppb Au-in-soil anomaly, and Holes 19 and 21 were drilled to test the high chargeability IP
anomalies in the arroyo Los Cochis. As expected from the surface sampling, the IP response was
42. PICACHOS 2007 TECHNICAL REPORT
NORTHWEST MINERAL MEXICO S.A. DE C.V.
42
caused by a barren quartz-pyrite lithocap hosted in vitric tuffs. In Hole 15, 13.66 meters of 2.3 g/t
Ag, 0.47% Zn and 0.07% Pb was intercepted from surface. The hole was oriented to intercept a
steeply northeast dipping vein, but the geochemical data imply that the mineralization is flatter,
and Hole 15 probably did not provide a full test of the mineralization. Additional drilling is
warranted as this area carries gold as well as silver.
Fig. 11.15. Cross-section Andres showing Holes 15 and 19. If the mineralization is in a manto, as implied by some of the surface
exposures (Fig. 9.5), then a reversal of the dip is implied by this section.
43. PICACHOS 2007 TECHNICAL REPORT
NORTHWEST MINERAL MEXICO S.A. DE C.V.
43
Fig. 11.16. Photomicrograph of the mineralization in Hole 15 (sample 31229). This intercept carries 1.76% Zn, 0.28% Pb, 0.03% Cu, 8
g/t Ag and 0.12 g/t Au across 1.52 meters. In this sample, a later stage of quartz veining cross-cuts early calcite.
SAMPLING METHOD AND APPROACH
12.1 SOIL SAMPLES
Soil samples were collected by cleaning the organics off the sample site, then digging a small pit
with a shovel to a depth of about 30 cm into the B-horizon. This depth is generally below the
zone of strongest surface leaching, and ensured the collection of material that was as in-situ as
possible, an important consideration in steeper terrain. In the winter, the samples were damp, but
as the weather dried out in the spring, samplers were able to screen the samples on-site to remove
any rock chips About 1 kg of material was collected from the bottom of the sample pit and put in
a Kraft soil sample envelope with a numbered tag.
12.2 SURFACE AND UNDERGROUND ROCK SAMPLES
Several types of rock samples were used in the evaluation of the Picachos Property. These are
listed in Table 12.1. For all types of samples, about 2 kilograms of rock chips were collected in a
double-bagged plastic sample bag with a numbered tag.
44. PICACHOS 2007 TECHNICAL REPORT
NORTHWEST MINERAL MEXICO S.A. DE C.V.
44
Table 12.1 Types of surface rock samples used to evaluate mineral occurrences.
SAMPLE TYPE DESCRIPTION AND COLLECTION METHOD
Grab Samples A sample taken from an outcrop, but not oriented across a structure, and not necessarily
representative.
Float Samples A rock sample from loose material, usually stream boulders or colluvium.
Dump Samples Material collected from a mine dump. These are not usually representative.
Chip Samples Oriented samples taken across a width by chipping pieces of rock approximately every 10 cm.
Chip-Channel Samples Oriented samples cut across a representative part of a mineralized structure using a sledgehammer
and chisel to form a continuous channel. Most channel samples were cut only after the working face
had been cleared of soil and debris, and the oxidized material removed using a hammer if at all
possible. After cleaning, 5-20 kg of material was collected on a large rice bag laid under the working
face. This material was then crushed to a medium gravel size between two rock hammers, and
homogenized by rolling the gravel in the rice bag. From the homogenized sample, about 2 kg of rock,
and ½ kg of fines were put into a doubled plastic sample bag and sealed with a plastic tie. Where
possible, chip channel samples were used to evaluate the grade of veins exposed on surface and
underground.
12.3 DRY RC DRILLING
Drill samples were routinely collected on five-foot intervals. 100% of the dry samples were sent
through the cyclone and collected in a Jones splitter. The sample was then split in half or
quartered. Part of the sample was bagged in a plastic bag and stored in camp. The other part was
bagged in a Tyvek bag, the re-bagged in thin plastic bag for shipment to the lab. Powder from the
dry samples were analyzed immediately for silver and base metals using a field portable Niton XRF
analyzer. There was a problem on Hole 4 and part of Hole 3 where the samplers did not
understand the procedure for inserting the QA/QC samples, and instead threw out the samples in
those spots. To estimate the grade of the missing intervals, the average result of the sample above
and below the missing sample was calculated, and used in that spot.
12.4 WET RC DRILLING
Wet samples were routinely collected on 5-foot intervals. The entire sample was funneled from
the cyclone into a circulating splitter. Pan blocks were placed on alternate openings in the splitter
to cut sample size down to approximately a 1/2 split. Water and cuttings were then run through
the Jones splitter again to sample ¼ split. After collecting a sample of the cuttings, some of the
water and fines were added to the sample bag, and the excess water seeped through the
permeable Tyvek bag as it was dried off in the sun. X-ray analysis could not be performed
immediately on the wet samples as water suppresses the results. Instead, these samples were
dried first, then X-rayed two or three days later. At that time, the sample was split into two parts:
half for the lab, and the other half as a back-up for storage in camp.
13.0 SAMPLE PREPARATION, ANALYSIS AND
SECURITY
RC sample powders were assayed on-site with a field portable Niton X-ray analyser, and values for
silver, zinc and lead used to guide on-site drilling decisions. After analysis, the samples were
stored in a secure building at camp, then shipped at the end of the job via Transportes Castores
to ACME’s prep lab in Guadalajara for preparation. Soil samples were screened to –80 mesh.
Rock and drilling samples were crushed and pulverized to –150 mesh. The prepared pulps were
then shipped to Vancouver, where 15 gram splits were digested in warm aqua regia for 1 hour,
diluted to 300 mL with demineralised water, and analysed for gold, silver and base metals using an
Inductively Coupled Plasma Mass Spectrometer (ICP-MS; 1DX package). Rocks and drill samples
45. PICACHOS 2007 TECHNICAL REPORT
NORTHWEST MINERAL MEXICO S.A. DE C.V.
45
containing more than 0.3 g/t Au, 50 g/t Ag or more than 1% base metals were re-analysed using a
30 gram fire assay for Au-Ag (Group 6 Fire Assay; 3-acid digestion), and high-grade multi-element
ICP methods (Group 7 ICP). Fire-assaying is a highly precise and accurate method for the total
determination of Au and other precious metals in samples. Samples are: (i) mixed with fluxes
including lead-oxide, (ii) fused at 1050°C, (iii) cupeled to recover a dore bead, (iv) nitric acid
parted to separate the precious metal, then (v) analysed by an Inductively Coupled Plasma -
Atomic Emission Spectrometer (ICP-ES).
14.0 DATA VERIFICATION
Blind standard pulps were inserted into the sample stream roughly every 25 samples to check for
within-batch analytical precision. A total of 88 drilling samples were selected from both
mineralized and non mineralized intercepts from the back-up splits in camp, and sent to SGS Labs
in Durango for gold and silver analysis. As these samples were split directly from the drill cuttings,
the analyses provide a good estimate of within-sample variation, as well as overall measurement
error. Most check samples do not contain measurable gold, so only silver values were reviewed.
Of the 88 samples, only 2 report significant differences between ACME and SGS; a difference
more likely caused by within-sample variation than laboratory error. Discounting these two
results, the correlation coefficient between the two data sets is very close to one. A similar analysis
of the Niton X-ray data with ACME’s analytical data implies that the X-ray values are generally 35%
lower than the assay data.
15.0 ADJACENT (INTERNAL) PROPERTIES
There is no relevant information under this Section.
16.0 MINERAL PROCESSING AND METALLURGICAL
TESTING
No metallurgical studies have been done.
17.0 MINERAL RESOURCE AND MINERAL RESERVE
ESTIMATES
The Picachos Property is an exploration-phase project. No mineral reserve estimates have been
calculated. One more stage of drilling at both Los Cochis and El Pino is required to constrain the
geometry of the mineralization enough to prepare a resource estimate.
18.0 OTHER RELEVANT DATA AND INFORMATION
None.
19.0 INTERPRETATION AND CONCLUSIONS
The objective of the first phase of drilling was to determine if the “bulk tonne” concept could be
used to develop the Los Cochis Prospect, a polymetallic deposit in an area of the world better
known for silver-gold veins. Results to date include 10 intercepts that could logically be included
in an open pit design (Table 19.1). None of these except perhaps Hole 8 can be considered
complete transects of the deposit, as it appears that that controls on the geometry of the
mineralization are related to stratigraphy as much as or more than they are to faulting.
47. PICACHOS 2007 TECHNICAL REPORT
NORTHWEST MINERAL MEXICO S.A. DE C.V.
47
20.0 RECOMMENDATIONS
El Toro is the largest (five times larger than Los Cochis) and most gold-rich mineral district on the
Property, but development costs of working in that topographically challenged area will be
substantial. At this stage, it will be more cost effective for NWT to delineate mineral resources at
Los Cochis, El Pino and Guadalupe. However, at least one campaign of exploration should be
completed at El Toro (say in 2009) prior to making important decisions such as where to locate
the mineral processing plant.
For 2008, the following work will provide the data needed to advance El Pino and Los Cochis from
“mineral prospects” to “mineral resources”
• A second stage of reverse circulation drilling to better constrain the geometry of the Los
Cochis deposit as specified in the Figures of Section 11. The objective of this stage of
work would be to identify a body of about 600 meters strike length, 80 meters width and
200 meters in the down-dip direction representing perhaps 27 million tonnes of
mineralized rock. About 2305 meters of drilling in 16 holes are should be an adequate
test of the “manto” concept.
• A minimum of 1860 meters of drilling in 9 holes are recommended to test the high-grade
potential of El Pino. A single structure in this zone might have as much as 2.5 million
tonnes of high grade silver and gold ore. Most of the drill pads are already built, and the
road, camp and water tank are already in-place.
• About 855 meters of drilling in three exploration holes are warranted to test the high-
grade oreshoots at Guadalupe.
The drilling plan for a total of 5020 meters is in Table 20.1. Maps and cross-sections are in Figures
20.1 to 20.10. An additional 3.4 kilometers of road development are required for Los Cochis,
about 700 meters for Guadalupe and perhaps a few hundred meters at most for El Pino. Road
development should start about six weeks prior to drilling. In addition to the drilling, air
photography of the entire Property and detailed topographic mapping of Los Cochis and El Pino
should be completed. Overall costs of the 2008 work are estimated at about $1.01 million. While
the 2008 campaign is in-progress, a powder license should be obtained from the National Dept.
of Defense to put NWT in a position to deal with El Toro in 2009.
Table 20.1 2008 Drilling Plan for Los Cochis, Guadalupe and El Pino
HOLE_ID WGS84_E WGS84_N ELEV AZIMUTH DIP DEPTH_m NOTES
PDH24 419391.7 2618278.57 1637 355 -75 130 DOWN dip of COCH 13
PDH22 419323.3 2618368.09 1600 45 -75 100 Down-Dip of Coch 3, El Pinito
PDH23 419231.2 2618274.32 1684 45 -75 210 Down Dip of PDH22
PDH25 419275.7 2618459.96 1621 45 -70 100 Test of Resistivity Target, 18.7
ppm Ag
PDH26 419207.9 2618535.87 1539 45 -70 40 Between 128 ppm Ag in soil, 708
g/t Ag in rock
PDH27 419144.9 2618471.06 1562 45 -70 80 Down-dip of PDH 26
PDH28 419115.3 2618596.53 1577 45 -70 130 Down dip of up to 38.4 ppm Ag in
soil
48. PICACHOS 2007 TECHNICAL REPORT
NORTHWEST MINERAL MEXICO S.A. DE C.V.
48
PDH29 419330.4 2618210.24 1672 45 -75 175 Down Dip of El Fresno
PDH30 419626.8 2618385.87 1647 225 -45 210 To check the possibility that high
grade of Coch 8 might be a vein
PDH31 419560.2 2618318.16 1622 45 -75 230 Test wide low-grade intercept of
Coch 8
PDH32 419495.5 2618262.46 1667 45 -75 300 Down Dip tests of Bulk ton
intercept in Coch 8
PDH33 420138.4 2618476.11 1600 225 -80 120 Collared near 12 ppm Ag, 58 ppb
Au in soil
PDH34 420226.5 2618281.57 1640 225 -80 110 > 1500 ppm Zinc in soil
PDH35 419947.5 2618144.58 1710 225 -80 100 Collared near 255 ppb Au in soil,
Zinc>1000 ppm
PDH36 420975.6 2618290.31 1755 225 -80 150 Strong Zn, Ag to 177 ppm in soil
PDH37 419720.9 2618195.58 1700 1 -90 120 Exploration of strong Zinc anomaly
in soil
PDH38 419666.4 2621202.45 1525 250 -65 300 South extension of Guadalupe;
43.4 g/t Ag, 0.2 g/t Au/4.5m
(surface)
PDH39 419355.1 2621362.48 1485 250 -70 280 Guadalupe North
PDH40 419354.9 2621360.17 1485 210 -65 275 Guadalupe Sur
PINO3 418998.7 2624834.71 1645 267 -50 175 Down-dip of Catalina, 611 g/t Ag,
9.4 g/t Au across 2 m
PINO4 418998.3 2624834.77 1645 267 -75 230 Down Dip of Catalina; 611 g/t Ag,
9.4 g/t Au/2m
PINO5 418997.9 2624833.28 1645 290 -60 250 Down dip of 6422; 212 g/t Ag, 3.2
g/t Au across 3m
PINO6 418928.7 2624646.45 1590 257 -50 125 Cut under 6327 with 511 g/t Ag,
2.9 g/t Au across 3m
PINO7 418928.9 2624646.22 1590 257 -75 165 Cut Under Pino 6 and Main Stope
PINO8 418928.8 2624646.23 1590 225 -65 125 Below El Pino Stope
PINO9 418928.6 2624646.07 1590 225 -80 200 Below El Pino Stope
PINO10 418779.1 2624776.01 1560 63 -50 330 Depth Test of Catalina
PINO11 418825.1 2624593.67 1520 70 -60 260 Under El Pino Stope
5020
49. PICACHOS 2007 TECHNICAL REPORT
NORTHWEST MINERAL MEXICO S.A. DE C.V.
49
Fig. 20.1 Map of drilling plan for Los Cochis
50. PICACHOS 2007 TECHNICAL REPORT
NORTHWEST MINERAL MEXICO S.A. DE C.V.
50
Fig. 20.2 Map of Drilling Plan for El Pino.
51. PICACHOS 2007 TECHNICAL REPORT
NORTHWEST MINERAL MEXICO S.A. DE C.V.
51
Fig. 20.3. Cross-Section showing Proposed Holes 3 and 4
52. PICACHOS 2007 TECHNICAL REPORT
NORTHWEST MINERAL MEXICO S.A. DE C.V.
52
Fig. 20.4 Cross-section of Proposed Holes 4 and 5
54. PICACHOS 2007 TECHNICAL REPORT
NORTHWEST MINERAL MEXICO S.A. DE C.V.
54
Fig. 20.5 Cross-Section of Proposed Holes Pino 6 to 11
Fig. 20.6 Cross-Section of Proposed Holes Pino 8 and 9.
55. PICACHOS 2007 TECHNICAL REPORT
NORTHWEST MINERAL MEXICO S.A. DE C.V.
55
Fig. 20.7 Cross Section of Proposed Hole10.
56. PICACHOS 2007 TECHNICAL REPORT
NORTHWEST MINERAL MEXICO S.A. DE C.V.
56
Fig. 20.8 Drilling Plan for Guadalupe
57. PICACHOS 2007 TECHNICAL REPORT
NORTHWEST MINERAL MEXICO S.A. DE C.V.
57
Fig. 20.9 Cross Section of Proposed Hole 39
58. PICACHOS 2007 TECHNICAL REPORT
NORTHWEST MINERAL MEXICO S.A. DE C.V.
58
Fig. 20.10 Cross Section of Proposed Hole 40
59. PICACHOS 2007 TECHNICAL REPORT
NORTHWEST MINERAL MEXICO S.A. DE C.V.
59
21.0 REFERENCES
Albinson, T., Norman, D.I., Cole, D., Chomiak, B., 2001, Controls on the Formation of Low-
Sulfidation deposits in Mexico: Constraints from Fluid Inclusion and Isotopic Data,
Economic Geology, Spec. Pub. No. 8, p. 1-32.
Aguirre-Diaz, G.J., Labarthe-Hernandez, G. (2003) Fissure Ignimbrites: Fissure-source origin for
voluminous ignimbrites of the Sierra Madre Occidental and its relationship with Basin and
Range faulting: Geology, V.31 p. 773-776.
Camprubi. A., Ferrari L., Coscsa, M., Cardellach, E., Canals, A. (2003) Ages of Epithermal Deposits
in Mexico: Regional Significance and Links with the Evolution of Tertiary Volcanism:
Economic Geology, V. 98, p. 1029-1037
Chen, B., 2007, 3D Induced Polarization and Magnetometer Survey on the Los Cochis and
Guadalupe Grids for Northwestern Mineral Ventures Inc.; SJV Consultants, Ltd., 27 pages.
DiPrisco, G., 2002, Ore Characterization of Hand Samples from the Picachos Property, Mexico,
Terra Mineralogical Services, 30 pages.
Elston W.E. (1994) Siliceous Volcanic Centers as Guides to Mineral Exploration: Review and
Summary: Economic Geology, V. 89, p. 1662-1686
Enriquez, E. and Rivera, R., 1998, Geology of the Santa Rita Ag-Au deposit, San Dimas district,
Durango, Mexico. Abstract, Association of Mining Engineers, Metallurgists and Geologists
of Mexico (AIMMGM), Convention Acapulco, January 17-20, 1998.
Enriquez, E. and Rivera, R., 1997, Timing of magmatic and hydrothermal activity at the San Dimas
District, Durango, Mexico. Abstract, Association of Mining Engineers, Metallurgists and
Geologists of Mexico (AIMMGM), Convention Acapulco, October 14-17, 1997.
Enriquez, E. 1995, Trace Element zonation and Temperature Controls of the Tayoltita Ag-Au
Fossil Hydrothermal System, San Dimas District, Durango Mexico, Unpublished MSc.
thesis; Colorado School of Mines, Golden, Colorado.
Heald, P., Foley, N.K. and Hayba, D.O., 1987, Comparative Anatomy of Volcanic-Hosted
Epithermal Deposits: Acid-sulfate and Adularia-sericite Types; Economic Geology, v. 82, p.
1-26
Hedenquist, J.W., Arribas R., A., Gonzalez-Urien E., 2000, Exploration for Epithermal Gold
Deposits, SEG Reviews, p. 245-277.
Ferrari, L., Valencia Moreno. M., Bryan, S., 2005, Magmatismo y tectónica en la Sierra Madre
Occidental y su relación con la evolución de la margen occidental de Norteamérica,
Boletin de la Sociedad Geologica Mexicana Volumen Conmemorativo del Centenario
Temas Selectos de La Geologia Mexicana Tomo LVII, N. 3, 343-378.
Fletcher, W.K., 1988, Analysis of Soil Samples, Exploration Geochemistry: Design and
Interpretation of Soil Surveys; Reviews in Economic Geology, v. 3, p.79-96.
Heinrich, C.A., 2005, The Physical and Chemical Evolution of low-salinity magmatic fluids at the
porphyry to epithermal transition: a thermodynamic study: Mineralium Deposita, v. 39 pp.
864-889.
60. PICACHOS 2007 TECHNICAL REPORT
NORTHWEST MINERAL MEXICO S.A. DE C.V.
60
Horner, J.T., 1998, Structural geology and exploration in the San Dimas District, Durango, Mexico-
An alternative geologic model; Unpublished PhD. thesis; Institute of Geology and
Paleontology; University of Salzburg, Austria, 203 p.
McDowell, F.W., Clabaugh, S.E., 1979, Ignimbrites of the Sierra Madre Occidental and their
relation to the tectonic history of western Mexico: Geological Society of America Special
Paper, 180, 113-124.
McDowell, F.W., Keizer, R.P., 1977, Timing of mid-Tertiary volcanism in the Sierra Madre
Occidental between Durango City and Mazatlan, Mexico: Geological Society of America
Bulletin, v. 88, p. 1479-1486.
McPhie, J., Doyle, M., Allen, R., 1993, Volcanic Textures: A guide to the interpretation of textures in
volcanic rocks; CODES Key Centre, Tasmania, 191 pages.
Sillitoe, R.H., 2004, Musings on Future Exploration Targets and Strategies in the Andes; Andean
Metallogeny: New Discoveries, Concepts and Updates: Society of Economic Geologists,
Special Publication 11, 2004, p. 1-14.
Staude, J., 2001, Jurassic to Holocene tectonics, magmatism and metallogeny of Northwestern
Mexico, GSA Bulletin, v. 113, 1357-1374.
Robinson, 2005, Soil Geochemical and Trenching Results for the Picachos and Camargo
Concessions, Durango, Mexico, Minera Tango S.A. de C.V., 91 pages.
Robinson, 2002, Soil geochemical and Prospecting results for the Camargo Concession Durango,
Mexico, Minera Tango S.A. de C.V, 48 pages.
Robinson, 2000, Geological Report, Picachos Concession E. 24465, Southwestern Duranago,
Mexico, internal Company report, 50 pages.
Ross, K.V., 2000, Petrographic Study for Minera Camargo S.A. de C.V., Ore samples from the
Picachos claim in Durango, Mexico; Panterra Geoservices Inc. 30 pages
Sillitoe, R.H., 2004, Musings on Future Exploration Targets and Strategies in the Andes; Andean
Metallogeny: New Discoveries, Concepts and Updates: Society of Economic Geologists,
Special Publication 11, 2004, p. 1-14.