
Recommended
More Related Content
What's hot
What's hot (20)
Similar to Iowa_RunningAverages_FatalMajor_20140820
Similar to Iowa_RunningAverages_FatalMajor_20140820 (20)
Iowa_RunningAverages_FatalMajor_20140820
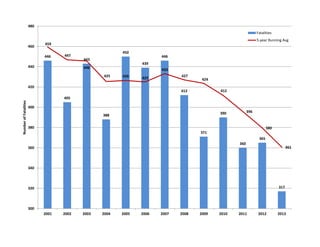
- 1. 446 405 443 388 450 439 446 412 371 390 360 365 317 459 447 446 425 426 425 433 427 424 412 396 380 361 300 320 340 360 380 400 420 440 460 480 2001 2002 2003 2004 2005 2006 2007 2008 2009 2010 2011 2012 2013 NumberofFatalities Fatalities 5-year Running Avg
- 2. 2368 2232 2051 2173 2090 1889 1982 1841 1615 1644 1501 1629 1537 3275 3057 2772 2481 2183 2087 2037 1995 1883 1794 1717 1646 1585 1000 1500 2000 2500 3000 3500 4000 2001 2002 2003 2004 2005 2006 2007 2008 2009 2010 2011 2012 2013 NumberofMajorInjuries Major Injuries 5-year Running Avg
- 3. 1.46 1.29 1.40 1.21 1.43 1.38 1.42 1.33 1.19 1.23 1.15 1.16 1.01 7.77 7.12 6.49 6.80 6.64 5.95 6.30 5.95 5.16 5.21 4.78 5.16 4.87 1.55 1.48 1.46 1.37 1.36 1.34 1.37 1.35 1.35 1.31 1.26 1.21 1.15 11.08 10.14 9.06 7.99 6.96 6.60 6.44 6.33 6.00 5.71 5.48 5.25 5.04 0.00 2.00 4.00 6.00 8.00 10.00 12.00 2001 2002 2003 2004 2005 2006 2007 2008 2009 2010 2011 2012 2013 RateperHMVMT Fatality Rate (Annual) Major Injury Rate (Annual) Fatality Rate (5-Year Average) Major Injury Rate (5-year Average)
- 4. 1.46 1.29 1.40 1.21 1.43 1.38 1.42 1.33 1.19 1.23 1.15 1.16 1.01 1.55 1.48 1.46 1.37 1.36 1.34 1.37 1.35 1.35 1.31 1.26 1.21 1.15 1.51 1.54 1.48 1.44 1.45 1.41 1.36 1.25 1.15 1.11 1.10 1.13 0.80 1.00 1.20 1.40 1.60 1.80 2.00 2001 2002 2003 2004 2005 2006 2007 2008 2009 2010 2011 2012 2013 Fatality Rate 5-year Running Avg US Fatality Rate
- 5. 7.77 7.12 6.49 6.80 6.64 5.95 6.30 5.95 5.16 5.21 4.78 5.16 4.87 11.08 10.14 9.06 7.99 6.96 6.60 6.44 6.33 6.00 5.71 5.48 5.25 5.04 3.00 5.00 7.00 9.00 11.00 13.00 15.00 2001 2002 2003 2004 2005 2006 2007 2008 2009 2010 2011 2012 2013 Major Injury Rate 5-year Running Avg
- 6. 2001 2002 2003 2004 2005 2006 2007 2008 2009 2010 2011 2012 2013 Number of Fatalities 446 405 443 388 450 439 446 412 371 390 360 365 317 Fatality Rate 1.46 1.29 1.40 1.21 1.43 1.38 1.42 1.33 1.19 1.23 1.15 1.16 1.01 5-year Running Average 459 447 446 425 426 425 433 427 424 412 396 380 361 1997 to 2001 1998 to 2002 1999 to 2003 2000 to 2004 2001 to 2005 2002 to 2006 2003 to 2007 2004 to 2008 2005 to 2009 2006 to 2010 2007 to 2011 2008 to 2012 2009 to 2013 Fatality Rate 5-year Running Average 1.55 1.48 1.46 1.37 1.36 1.34 1.37 1.35 1.35 1.31 1.26 1.21 1.15 US Fatal Crash Rate 1.34 1.33 1.32 1.28 1.30 1.27 1.22 1.14 1.04 1.02 1.01 1.04 US Fatality Rate 1.51 1.54 1.48 1.44 1.45 1.41 1.36 1.25 1.15 1.11 1.10 1.13 Major Injuries 2368 2232 2051 2173 2090 1889 1982 1841 1615 1644 1501 1629 1537 Major Injury Rate 7.77 7.12 6.49 6.80 6.64 5.95 6.30 5.95 5.16 5.21 4.78 5.16 4.87 5-year Running Average 3275 3057 2772 2481 2183 2087 2037 1995 1883 1794 1717 1646 1585 Major Injury Rate 5- year Running Average 11.08 10.14 9.06 7.99 6.96 6.60 6.44 6.33 6.00 5.71 5.48 5.25 5.04 US Injury Crash Rate 71.19 67.13 66.18 62.44 60.34 57.55 56.12 54.47 51.31 51.97 51.93 55.11 US Injury Rate 107.80 101.82 99.32 93.49 89.69 84.88 81.70 78.39 74.98 75.46 75.25 79.66