1. A hybrid zone revisited: molecular and morphological
analysis of the maintenance, movement, and evolution of
a Great Plains avian (Cardinalidae: Pheucticus) hybrid zone
R. D. METTLER and G. M. SPELLMAN
Department of Biology, Black Hills State University, 1200 University Street, Spearfish, SD 57799, USA
Abstract
Black-headedgrosbeaks(Pheucticusmelanocephalus)androse-breastedgrosbeaks(Pheucti-
cusludovicianus) arepasserine bird species known to hybridizein the Great Plains of North
America. Both extrinsic (environmental) and intrinsic factors (pre- and postzygotic repro-
ductive isolation) have been credited for the generation and maintenance of the grosbeak
hybrid zone, but little is known about the genetic characteristics of this hybrid zone. To
investigate the stability and extent of the grosbeak hybrid zone, we constructed clines
from both molecular sequence data (mtDNA, three autosomal intron loci, and one
Z-linked locus) and morphological data (morphometric analyses and hybrid index scores)
to determined zone centre and width. Hybrid zone centre and width were also determined
for samples collected across the zone 40 years ago from morphological data. The present
and past clines were compared and provided support for stability in hybrid zone location
and width, and the evolutionary implications of this are discussed. Three models of hybrid
zonemaintenancewereinvestigatedtoconsidertheinfluenceofintrinsicandextrinsicfactors
on this zone. Our results suggest low hybrid frequencies, a stable zone location and narrow
width,andreducedhybridfitnessoverthepast40 yearsbestcategorizethegrosbeakhybrid
zoneasatensionzone.
Keywords: Great Plains, hybrid zone, mitochondrial DNA, nuclear loci, Pheucticus, tension zone
Received 30 May 2008; revised 23 March 2009; accepted 5 April 2009
Introduction
Secondary contact with hybridization between species is
inconsistent with the classical theory of speciation, in which
species are reproductively isolated from other species
(Dobzhansky 1937; Mayr 1942). A hybrid zone is the area
where species overlap in range and interbreed, producing
viable hybrid offspring of mixed ancestry. Reproductive
isolation is maintained between different species to prevent
interspecific mating, but hybrid zones indicate a breakdown
of premating and/or postmating barriers, often resulting
in gene exchange between species and introgression of
foreign alleles into pure populations. Studying the differ-
ences and frequencies in genotypic and phenotypic charac-
teristics extending across the geographical distribution of
zones of hybridization can help elucidate the stability and
width of hybrid zones, as well as the strength of isolating
barriers.
Three alternative hypotheses have been proposed to
explain the maintenance of a hybrid zone. First, the bounded
hybrid superiority hypothesis predicts hybrid zones to
occur in intermediate ‘ecotones’ at the interface of species
boundaries, and predicts higher fitness in hybrids than
parental types (Moore 1977). Second, the ecological gradient
hypothesis predicts hybrid zones to occur in ecologically
transitional areas that represent environmental gradients,
but hybrids are conversely expected to have reduced fitness
compared to parents (Endler 1977). The third model, the
dynamic equilibrium hypothesis, predicts recombinant
hybrid genotypes to be less fit than their parents, forming a
‘tension zone,’ which is maintained by a balance between
dispersal into the hybrid zone and selection against hybrids
(Key 1968; Barton & Hewitt 1985; Barton 2001). Distinguish-
ing between extrinsic and intrinsic selection in naturally
hybridizing populations provides unique insights into
the evolution of reproductive isolation and how past and
Correspondence: Raeann D. Mettler, Fax: 605-642-6762; E-mail:
raeannmettler@bhsu.edu
Ó 2009 Blackwell Publishing Ltd
Molecular Ecology (2009) 18, 3256–3267 doi: 10.1111/j.1365-294X.2009.04217.x
2. present selection pressures influence species boundaries
and the speciation process, as well as the causes of hybrid
zone movement. Hybrid zone movement can be caused
by differences in fitness, population structure, gene fre-
quencies, and ecological differentiation throughout the
zone (Barton & Hewitt 1985; Secondi et al. 2006; Buggs
2007).
Extrinsic selection involves the adaptation of organisms
to the environment and the ecological interactions of
organisms with their environments. In North America,
many ancestral species were presumed to have diverged in
response to Pleistocene climatic changes and later came
into contact in areas called ‘suture zones,’ or predicted hot-
spots for hybrid zone occurrence (Remington 1968). Recent
studies have confirmed the existence of many North Amer-
ican suture zones (Swenson & Howard 2004, 2005), includ-
ing the Great Plains — Rocky Mountain suture zone where
numerous avian hybrid zones are known to occur, repre-
senting contact between western- and eastern-distributed
species (Remington 1968; Rising 1983; Price 2008). Exoge-
nous environmental factors, such as temperature and pre-
cipitation (Rising 1970; Moore 1977; Swenson 2006) as well
as anthropogenic habitat modification (Sibley & Short1964;
Short 1965; Anderson 1971), have been proposed as major
factors responsible for past and present maintenance of
avian hybridzonesinthissuturezone.
In contrast, endogenous selection reflects within gen-
ome or organism effects and is independent of the envi-
ronment, which may result in intrinsic biological
barriers to mating and reduced fitness of hybrid off-
spring. Sexual selection based on plumage, morphology,
or song can be an effective intrinsic mechanism for pre-
mating reproductive isolation in birds (Grant & Grant
1997), preventing interspecific mating from occurring.
Intrinsic premating isolating mechanisms also include
mating incompatibilities and fertilization (syngamy)
failure (Birkhead & Brillard 2007). If hybrid offspring
are successfully produced, postmating isolating mecha-
nisms, including sexual and ecological selection against
hybrids and genetic incompatibilities, may result in
reduced fitness in hybrids. Hybrid offspring are often
predicted to have lower fitness than parental types and
fitness disadvantages of hybrids include sterility, reduced
viability, reduced fertility, and/or F1 hybrid behavioural
difficulties. Haldane’s Rule (1922) predicts the heteroga-
metic sex of hybrid offspring (avian females) will exhibit
reduced fitness compared to the homogametic sex and
has been supported in studies of avian hybridization
(Price & Bouvier 2002).
This study characterizes the zone of hybridization
between two grosbeak (Pheucticus) species in South
Dakota, USA using molecular and morphological
methods. The Black-headed Grosbeak (Pheucticus melano-
cephalus) occupies a western breeding range (Hill 1995),
while the Rose-breasted Grosbeak (Pheucticus ludovici-
anus) occupies a northeastern breeding range in North
America (Wyatt & Francis 2002). These two woodland
species hybridize along riparian corridors where their
ranges overlap in the Great Plains — Rocky Mountain
suture zone. In the Great Plains, interspecific Pheucticus
hybridization has been reported to be most extensive in
Nebraska (West 1962; Rising 1983), but less common in
the Dakotas due to habitat availability (Anderson &
Daugherty 1974; Kroodsma 1974b). In eastern South
Dakota, a gap in the zone of hybridization exists due to
the lack of streams and rivers spanning eastward from
the Missouri River, leaving little suitable grosbeak habi-
tat. Pheucticus ludovicianus is common in the southeastern
portion of South Dakota and hybridization with P. melano-
cephalus does occur along the Missouri River (West 1962;
Rising 1983).
The two Pheucticus species are distinguished primarily
by morphology. Male P. melanocephalus individuals are
identified by the presence of a yellow breast, belly and
underwing colour and brown underparts, rump, hind, and
other areas; male P. ludovicianus are identified by a con-
trasting rose-red breast, belly and underwing colour and
an absence of the brown colouration, replaced by white
(Anderson & Daugherty 1974). Females of the two species,
on the other hand, are morphologically similar and more
difficult to distinguish, differing in underwing colour and
extent of streaking and colour of the breast and belly (West
1962). Interspecific hybrid offspring may be morphologically
similar to either parent species, or reflect any range of
phenotypes intermediate to the parent species (West 1962;
Anderson&Daugherty1974;Kroodsma1974b).
Past studies on Pheucticus hybridization in the Great Plains
have used morphological plumage differences between
parent species and hybrids to distinguish between pure
andhybridindividuals(West1962;Anderson&Daugherty
1974; Kroodsma 1974b). Premating and postmating repro-
ductive isolation have both beenhypothesized tobe impor-
tant in the maintenance of the Great Plains Pheucticus
hybrid zone (West 1962; Anderson & Daugherty 1974;
Kroodsma 1974a, 1974b). Anderson & Daugherty (1974)
found some evidence of both female assortative mating and
reduced viability of hybrid females within the Pheucticus
hybrid zone. Further molecular analysis of this hybrid zone
should provide additional insight into the structure, main-
tenance,andstabilityofthishybridzone.
Thisstudymorphologicallyandgeneticallycharacterized
the contemporaryP.melanocephalus · P. ludovicianus hybrid
zone in South Dakota to determine the current centre and
width of this zone. We additionally re-evaluated historical
morphological data on this hybrid zone to determine the
stability and location of this zone over the past 40 years,
which further allowed us to investigate models of hybrid
zone maintenance. Three hypotheses were evaluated: (i) the
HYBRIDIZATION IN GROSBEAKS 3257
Ó 2009 Blackwell Publishing Ltd
3. grosbeak hybrid zone was predicted to be stable in its
location in South Dakota and of similar width to that
described by Anderson & Daugherty (1974) during the
1960s, (ii) hybridization between these two species was
predictedtobeinfrequentandhybridindividualsrareinthe
hybrid zone, and (iii) extrinsic and intrinsic factors both
were predicted to be responsible for the maintenance of the
grosbeak hybrid zone. This was carried out by exploring
patterns of morphological (hybrid index scores and
morphometric measurements) and genetic (maternal mito-
chondrial DNA and biparental autosomal nuclear DNA and
Z-linked DNA) differentiation across the grosbeak hybrid
zoneandinvestigatingclinalvariationinthesecharacters.
Methods
Samples
Individuals were located and identified in the field by call
playback. We collected 143 individuals during the 2007
breedingseason,comprised of140 (133 malesand 7 females)
adult birds and three eggs. Individuals were collected in a
west-to-east transect across South Dakota (SD) in riparian
areas and gallery forests along Spearfish Creek, White
River, Bad River, Missouri River, and Big Sioux River and
individuals were grouped into 10 sampling localities based
on longitude for further analyses (Fig. 1). The western
extent of the collecting localities was near Spearfish, SD
(locality 1) historically representing pure Pheucticus mela-
nocephalus, while the eastern extent was Newton Hills State
Park near Canton, SD (locality 10), representing pure Pheucticus
ludovicianus.Latitude,longitude,andaltitudeofeachindividual’s
locality were recorded using global positioning system
(GPS). Study skins were prepared from each specimen and
deposited into collections at Black Hills State University
(Spearfish, SouthDakota).
Morphology and plumage measurements
The mass of each adult was measured in the field and four
morphological measurements were made in the laboratory
including: bill length (from anterior edge of nare to bill tip),
bill width (at its base), wing cord (flattened wing from bend
of wing to longest primary), and tarsus length (from inter-
tarsal joint to distal end of last leg scale). Individuals were
identified as pure individuals or hybrids using the same
hybrid index scoring criteria of Anderson & Daugherty
(1974) based on the colouration of five plumage characters
for males (nape, flank, back, rump, and breast) and three
characters for females(throat/breast/side of neck,extent of
yellow,andextentofstreaking).Fromthesecharacters,each
maleindividualwascategorizedasoneofthefollowingfive
phenotypes: pure P. melanocephalus, other hybrid more sim-
ilar to P. melanocephalus, intermediate hybrid, other hybrid
more similar to P. ludovicianus, or pure P. ludovicianus
according to Anderson & Daugherty (1974). Yearling males
Fig. 1 Collecting localities 1–10 across South Dakota. White circles, grey triangles, and black circles represent morphological P. mela-
nocephalus, Pheucticus hybrids, and P. ludovicianus individuals respectively, based on hybrid index scores.
3258 R. D. METTLER and G. M. SPELLMAN
Ó 2009 Blackwell Publishing Ltd
4. were combined with adult males to be consistent with the
scoring methods of Anderson & Daugherty (1974), who
indicated subadult and adult males were found to have
nearly identical hybrid index scores. Females were classified
similarly, but excluded from further morphological analyses
due to low sample sizes and highly variable morphologies.
Principal components analysis (PCA, Systat version 12) was
used to analyse bill length, bill width, wing cord, and tarsus
lengthofintactmalespecimens(N ¼ 129).
Genetic data collection
Breast muscle or embryonic tissue (from eggs) was obtained
from each individual, placed in a 2-mL cryotube, and stored
in liquid nitrogen in the field. Upon return to the laboratory,
samples were stored at –80 °C before DNA extraction. Total
genomic DNA was extracted using either a DNeasy Tissue
Kit (QIAGEN) or phenol–chloroform–isoamyl alcohol with
Phase Lock Gel Light (Eppendorf) at the Western South
Dakota DNA Core Facility (WestCore) at Black Hills State
University.TotalgenomicDNAwasquantifiedwitha Nano-
Drop spectrophotometer (Thermo Scientific) and each
sample was diluted to 60 ng/lL for optimal polymerase
chainreaction(PCR)amplificationandstoredat–20 °C.
Preliminary PCR amplification and sequencing was per-
formed at the mitochondrial nicotinamide adenine
dinucleotide (NADH) dehydrogenase subunit 2 (mt-ND2)
gene using the primers L5215 (Hackett 1996) and H6313
(Johnson & Sorenson 1998). We designed internal primers
L325 and H565 from these sequences to target a short frag-
ment of the ND2 gene approximately 200 bp in length that
was diagnostic between the two species. This ND2 frag-
ment was then PCR amplified with the primers L325 and
H565 in all 143 Pheucticus samples obtained in 2007 from
South Dakota. Four unlinked nuclear loci mappedto intron
regions of the chicken genome (Gallus gallus) were ampli-
fied in the 143 Pheucticus samples and include: PCBD1
(Pterin-4 alpha-carbinolamine dehydratase), intron 2; FGB
(Beta-fibrinogen), intron 5; RHO (Rhodopsin) intron 2; and
MUSK (muscle skeletal tyrosine kinase), intron 4 and
Z-linked (Table S1, Supporting information). These four
nuclear loci and the mitochondrial gene were PCR
amplified in 15-lL reactions using either 2· Promega
Master Mix or Eppendorf 2.5· HotMasterMix with a Gene-
Amp 9700 PCR System (Applied Biosystems) under the
following conditions: 94 °C denaturation for 10 min,
followed by 35 cycles of 94 °C for 30 s, 54–56 °C for 30 s
(see Table S1 for annealing temperatures), 72 °C for 1 min,
followed bya 72 °Cextension for7 min,anda 4 °C hold.
Amplified products were purified using ExoSAP-IT (USB
Corporation) following the manufacturer’s protocol. BigDye
Terminator version 3.1 (Applied Biosystems) cycle sequenc-
ing reactions using 20–40 ng of purified PCR product were
run on a 9800 Fast Thermal Cycler (Applied Biosystems)
under the following conditions: 96 °C denaturation for
1 min, followed by 25 cycles of 96 °C for 10 s, 50 °C for 5 s,
60 °Cfor1 minand15 s,andfollowedbya4 °Chold.Cycle
sequencing reactions were purified with the Agencourt
CleanSEQ Dye Terminator Removal kit and run on an
Applied Biosystems 3130 Genetic Analyser at WestCore.
Complementary strands at the mt-ND2 locus and the four
nDNA loci were aligned by eye using Sequencher version 4.8
(Gene Codes Corporation). Ambiguous nuclear single nucle-
otide polymorphimsm (SNP) loci were identified visually in
Sequencher with the presence of two peaks of equal intensity
and assigned the appropriate IUPAC ambiguity symbols.
Sequences of unique haplotypes at the five loci were
submitted to GenBank with the following accession nos:
PCBD1 (N ¼ 13), FJ004624–FJ004636; FGB (N ¼ 86),
FJ010364–FJ010449; RHO (N ¼ 13), EU934822–EU934834;
MUSK (N ¼ 98), FJ010450–FJ010546; and mt-ND2 (N ¼ 2),
FJ040875–FJ040876.
Data analysis
Assignment of mt-ND2 haplotypes to either parental species
was performed via maximum parsimony and maximum
likelihood phylogenetic analysis in PAUP* version 4.10b
(Swofford 2001). Nuclear sequences were initially analysed
with Phase version 2.1 (Stephens et al. 2001; Stephens &
Scheet 2005) to infer phase and reconstruct the haplotypes
of each individual. A Bayesian analytical framework and
Markov chain Monte Carlo (MCMC) algorithm were used
for this analysis and haplotypes were inferred at the 95%
confidence level. The hybrid model in Phase version 2.1
was used for phase reconstruction, which implements
the faster original model for preliminary computations and
the newer recombination model for final computations (Stephens
et al. 2001; Stephens & Scheet 2005).
TOPALi version 2 software (Milne et al. 2004) was used
to detect the presence of recombination at the four nuclear
loci using the difference of sums of squares (DSS) method
and implementing a sliding window of 100-bp and 10-bp
step sizeata 95% confidence level.Due to thelarge number
of sequences, TOPALi calculated a random selection of 50
sequences for each of two runs. TOPALi was additionally
used to evaluate the fit of 56 models of sequence evolution
to each locus. The Jukes Cantor model of nucleotide substi-
tution was used to initiate analysis at each locus and
Akaike information criterion (AIC1) scores were used
to determine the substitution model with the highest
likelihood, whileminimizing the number of parameters.
We quantified sequence polymorphism at each nuclear
locus using DnaSP version 4.20.2 software (Rozas et al. 2003)
and the following statistics: number of haplotypes, h; hap-
lotypediversity,Hd (Nei1987);nucleotidediversity,p(Nei1987);
average number of nucleotide differences, K (Tajima 1983);
and h (4 Nl) per sequence and per site (Nei 1987; Tajima
HYBRIDIZATION IN GROSBEAKS 3259
Ó 2009 Blackwell Publishing Ltd
5. 1993). Departures from neutrality at each locus were tested
with Tajima (1989) and Fu & Li (1993) tests. Network version
4.500 (Bandelt et al. 1999, www.fluxus-engineering.com)
was used to reconstruct networks and visualize relationships
among haplotypes at each nuclear locus using the median-
joining(MJ)networkalgorithm.Defaultvaluesofepsilon ¼ 0
and weighting transversions/transitions 1/1 were used.
Length polymorphisms and/or low confidence in phase
reconstruction resulted in only 138 (of 143) individuals being
used for analyses of nuclear loci. All polymorphic sites (123
total sites) found in the complete four locus data set (138 indi-
viduals)wereconvertedtofourstateSNPdatausingapython
script (Nexus2Structure.py; Dr Charles Chapuis, personal
communication).
Cline construction
The distance across the collecting transect (encompassing
the hybrid zone) was measured using ArcGIS 9/ArcMap
version 9.2 (ESRI) as a linear distance along river corridors
from western to eastern South Dakota. Measurement of
distance began in the Black Hills in western SD (locality 1)
as 0 km and ended in eastern SD near Canton, SD (locality
10) at 636 km. Maximum likelihood (ML) clines were fitted
to morphological and genetic data using the software pack-
age Analyse (Barton & Baird 1996), which implements the
tanhclinemodelofSzymura&Barton(1986).Thetanhcline
isdefined asy ¼ [1 + tanh (2(x–c)/w)]/2, in which x isthe
distance from the centre of the cline, c is the centre of the
cline, and w is the width of the cline, calculated as 1/maxi-
mum slope (Szymura & Barton 1986). Population averages
atall10localitieswereusedtofitclinesfor2007malehybrid
score and mtDNA, while samples at locality 2 (202 km)
were combined with locality 3 (242 km) for PC1, RHO and
PCBD1 clines due to outliers in the data and small samples
sizeatlocality 2.Alldata setswere scaled topmin andpmax of
zero and one, respectively and a simple single locus was
assumed for each run to make the program amendable to
morphological and quantitative data. Analyse used the
Metropolis–Hastings algorithm (Metropolis et al. 1953;
Hastings 1970) to estimate c and w from multiple runs on
population (locality) averages of the 2007 data, including:
hybrid index scores, PC1, PCBD1 haplotype frequencies,
RHO haplotype frequencies, and mtDNA frequencies.
Several runs were implemented for each character, and
the best run and overall support was estimated with
log-likelihood scores, representing unconstrained ML
values.
Additionally, hybrid index scores were re-evaluated from
Anderson & Daugherty (1974) historical samples from South
Dakota and Nebraska, fit to our transect scale, and Analyse
was used to estimate c and w to directly compare with the
contemporary data from this study. Sigmoid clines were
graphed using the tanh equation for contemporary and
historical characters using the Mathematica version 6
(Wolfram) statistical package.
To further explore cline centre coincidence and cline
width concordance, likelihood-ratio tests, as described by
Hilborn & Mangel (1997), were first performed between
contemporary characters by exploring simple (Model A)
vs. more complex (Model B) data sets. The null hypothesis
for each test has no significant difference between the two
models. Additional Metropolis–Hastings searches were
implemented in Analyse by constraining the parameters (c
or w) to models A or B estimating log-likelihood scores for
all five characters. The test statistic, R, was calculated as the
absolute difference between the sum of likelihoods for
model A and model B, multiplied by two. The significance
of R was determined from a chi-squared table with the
degrees of freedom equal to the number of characters
minus one.
Additional likelihood-ratio tests were used to determine
concordance between the clines constructed for past and
present hybrid index scores. The null hypothesis for these
tests was no difference between past and present c and w.
Analyse determined new log-likelihoods by constraining c
or w to the average between past and present cline data. R
was similarly calculated as the absolute difference between
the sum of the new likelihoods and the sum of the original
likelihoods, multiplied by two. Significance was determined
by chi-squared goodness-of-fit.
Results
Morphology
Using Anderson & Daugherty’s (1974) hybrid index scor-
ing system based on plumage attributes, we classified the
Table 1 Morphological classification of 129 male Pheucticus
individuals and average distance (km) along transect of ten
collecting localities: Pure Pme ¼ Pure P. melanocephalus; Other
Pme ¼ Other hybrid, more similar to P. melanocephalus; Inter-
mediate ¼ Intermediate hybrid; Other Plu ¼ Other hybrid,
more similar to P. ludovicianus; Pure P. ludovicianus
Locality
(Distance, km) N
Pure
Pme
Other
Pme Intermediate
Other
Plu
Pure
Plu
1 (0) 22 22 0 0 0 0
2 (202) 3 3 0 0 0 0
3 (242) 16 16 0 0 0 0
4 (277) 12 12 0 0 0 0
5 (342) 14 13 0 0 0 1
6 (378) 10 7 1 2 0 0
7 (421) 12 6 4 1 0 1
8 (460) 9 1 0 1 2 5
9 (498) 9 0 0 1 3 5
10 (631) 22 0 0 1 3 18
3260 R. D. METTLER and G. M. SPELLMAN
Ó 2009 Blackwell Publishing Ltd
6. 129 male individuals collected in 2007 as follows: 80 pure
Pheucticus melanocephalus, five other hybrids more similar
to P. melanocephalus, six intermediate hybrids, eight other
hybrids more similar to Pheucticus ludovicianus, and 30 pure
P. ludovicianus. Morphologically pure Pheucticus were
collected in localities 1–5, while morphological hybrids were
collected in localities 6–10 (Fig. 1 and Table 1). Seven total
females were collected including one pure P. melanocephalus,
one other hybrid more similar to P. melanocephalus, four
individuals more similar to P. ludovicianus, and one pure
P. ludovicianus.
The PCA analysis of the morphological measure deter-
mined that the first principal component axis (PC1)
explained most of the variation in morphological measure-
ments (9.259%), which explained 84.288% of the total vari-
ation. The highest component loading for PC1 (3.005) was
wing cord. PC1 exhibited clinal variation (Fig. 2), allowing
use of PC1 for further cline analysis. The second principal
component (PC2) explained had highest loadings for bill
width,billlength,andtarsus(0.081–1.003).PC2wasnotclinal
across the sampling landscape (Fig. 2), and explained only
9.869% of the total variation in morphological measure-
ments;therefore,PC2wasnotusedinfurtheranalyses.
Mitochondrial DNA
Phylogenetic analysis of the mt-ND2 gene identified two
well-supported mitochondrial clades corresponding to the
two Pheucticus species. A total of 96 individuals were
assigned to the P. melanocephalus clade and the number of
birds morphologically identified as P. melanocephalus,
P. ludovicianus, and Pheucticus hybrids in this clade were 92,
0,and 4 respectively.A totalof50individualswere assigned
to the P. ludovicianus clade and the number of individuals
morphologically identified as P. melanocephalus, P. ludo-
vicianus, and Pheucticus hybrids in this clade were 1, 42, and
7 respectively. The single P. melanocephalus male (from
locality 6) that was found to have P. ludovicianus mtDNA
had primarily P. melanocephalus morphology, with only
slight (if any) indication of P. ludovicianus characteristics;
this individual was therefore most likely of mixed ancestry,
butdisplayedaP.melanocephalusphenotype.Mixed propor-
tions of P. melanocephalus and P. ludovicianus mtDNA
were detected in the region spanning from 100.0° to 99.0°
W. Mitochondrial DNA haplotype frequencies at each
locality were used to construct a contemporary mtDNA
cline(seeClineanalysis).
Nuclear DNA
Phase reconstructed the best haplotype estimates for each
individual at the four nuclear loci as follows: 13 haplotypes
(10 variable sites) at PCBD1 with 450 bp of sequence, 86
haplotypes(53variablesites)atFGBwith574 bpofsequence,
13 haplotypes (eight variable sites) at RHO with 287 bp of
sequence, and 98 haplotypes (53 variable sites) at MUSK
with 392 bp of sequence. Both PCBD1 and RHO networks
show strong relationships and distinguish P. melanocepha-
lus and P. ludovicianus haplotypes relatively well (Figure
S1, Supporting information), which supports the geo-
graphical distribution of the two Pheucticus species in
South Dakota, therefore haplotype frequencies at these two
loci were used to construct nuclear DNA clines. FGB and
MUSK contained considerably more variation compared
to PCBD1 and RHO, revealing more shared haplotypes
between the parental species, therefore excluding FGB and
MUSK from cline analyses. Neutrality tests of Tajima (D),
Fig. 2 Principal Component means across the collecting trans-
ect (±2 SD): Mean PC1 (above) and PC2 (below).
Table 2 Variation between nuclear loci: number of sequences, maximum number of sites, number of variable sites (S), total number
of mutations (Eta), number of haplotypes (h), haplotype diversity (Hd), nucleotide diversity (p), average number of nucleotide differ-
ences (k), theta (h) per sequence, and theta (h) per site
Locus No. of seqs No. of sites S Eta h Hd p k h (per seq) h (per site)
MUSK 292 392 53 55 98 0.96 0.00991 3.75479 8.79682 0.02321
RHO 292 287 8 9 13 0.4 0.00188 0.45867 1.43948 0.0059
FGB 278 574 53 54 86 0.968 0.01489 7.00039 8.70541 0.01852
PCBD1 288 450 10 11 12 0.62 0.0055 2.12991 1.76326 0.00456
HYBRIDIZATION IN GROSBEAKS 3261
Ó 2009 Blackwell Publishing Ltd
7. Fu and Li (D* and F*) test statistics were not significant at
thefournuclearloci.Sequencepolymorphismstatisticsdeter-
mined by DNAsp for each of the four nuclear loci are shown
in Table 2. Overall, greater variation and diversity were
found at the MUSK and FGB loci compared to the RHO and
PCBD1loci.
TOPALi analyses found no evidence of significant
recombination at any of the four nuclear loci; all DSS values
were determined to be lower than the 95% significance
point for both runs at each locus and supported the null
hypothesis of no recombination. The best-fit model of sub-
stitution, rate heterogeneity (C), proportion on invariant
sites (pINV), likelihood of model (–1), Akaike information
criterion (AIC1), AIC with second order correction (AIC2),
and proportion of transitions to transversions (ts/tv) for
each locusarelisted in Table S2, Supportinginformation.
Cline analysis
Although DSS values determined no recombination at the
four nuclear loci, it appears that recombination may be
present in MUSK and FGB from the structure of the net-
worksattheseloci(Figure S1),thereforethesetwo lociwere
subsequently excluded fromcline analysis.
Cline centres, widths, and log-likelihood scores are listed
in Table 3 for the five contemporary clines including: 2007
male hybrid index scores, PC1, nDNA PCBD1, nDNA
RHO, and mtDNA ND2, as well as historical hybrid index
scores. Visual inspection of the contemporary clines
(Fig. 3a) revealed three relatively concordant clines (male
hybrid index score, mtDNA, and PCBD1) with steeper
slopes; these three clines had similarly coincident centre (c)
estimates and were considered together as model A in sub-
sequent analyses, constraining the consensus centre to the
averagecof459 kmandsimplifyingthedataset.Theaverage
c of all five clines is shifted westward to 405 km by the varia-
tion represented by RHO and PC1 clines; the five clines are
considered together as model B in subsequent analyses,
representingamorecomplex model.The likelihood-ratiotest
including all five contemporary characters (model B) indi-
cated no significant difference between c likelihoods of
405 km and 459 km (RcB ¼ 0.838, d.f. ¼ 4, P > 0.05). The
likelihood-ratio test for model A (three characters) deter-
mined a significant difference between c likelihoods (RcA ¼
27.936,d.f. ¼ 2,P < 0.05),suggestingmodelAtohaveabet-
ter likelihood over model B. Therefore, the three-character
model with an average c of 459 km is the most likely centre
estimatefromthecontemporaryclinedata.
Theaveragewidth(w)likelihoodsformodelsAandBwere
determined to be 114 km and 187 km, respectively. The
model B likelihood-ratio test for w determined a significant
difference between cline widths of 114 km and 187 km
Table 3 Cline analysis results for five
contemporary characters (2007 hybrid
index, mt-ND2, PCBD1, RHO, and
PC1) and one historical character (His-
torical hybrid index)
Character Cline center (c), km Cline width (w), km Log-likelihood
2007 hybrid index 435 106 –2.096
mt-ND2 451 82 –0.354
PCBD1 492 155 –2.061
RHO 299 356 –6.332
PC1 347 238 –0.301
Historical hybrid index 449 198 –8.473
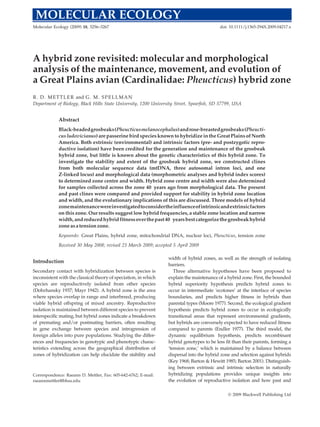
Fig. 3 (a) Fitted clines for the five contemporary characters from this study: male hybrid index score, mt-ND2, nuclear PCBD1,
nuclear RHO, and Principal Component 1 (PC1). (b) Fitted clines for the contemporary male hybrid index score and historical scores
from Anderson and Daugherty (1974). Vertical lines represent cline center, c, for each cline.
3262 R. D. METTLER and G. M. SPELLMAN
Ó 2009 Blackwell Publishing Ltd
8. (RwB ¼ 88.0,d.f. ¼ 4,P < 0.05);modelB’saverageof187 km
was calculated to be the most likely estimate of contem-
porarycline width.
Our contemporary male hybrid index scores were com-
pared to the historical scores of Anderson & Daugherty
(1974)byestimatingcandwforthehistorical dataandcom-
paring cline profiles. Visual inspection revealed cline cen-
tres that are relatively coincident between contemporary
andhistoricaldata,435 kmand449 kmrespectively(Fig. 3b).
New likelihoods were determined for 2007 and historical
clines using Analyse to constrain c to the average of these
two clines, 442 km. A likelihood-ratio test between the
sumsof newandoriginal likelihoods determined no signif-
icant difference between the original estimates of c and the
averagec (RcIndex ¼ 1.252,d.f. ¼ 1,P > 0.05), suggesting
no significant change in the centre of the hybrid zone over
the last40 years.
Initial cline analysis revealed that cline widths differed
more substantially (by 92 km) between past and present
male hybrid index scores (Table 3). The average w for the
past and present clines was 152 km, so new likelihoods
were estimated for 2007 and historical clines by fixing w to
this width. A likelihood-ratio test between the sums of new
and original likelihoods determined a significant difference
between the average w likelihoods and the original uncon-
strained likelihoods (RwIndex ¼ 6.782, d.f. ¼ 1, P < 0.05).
Thisresultsupportsasignificantreductioninthewidthofthe
hybridzoneoverthelast40 years.
Discussion
Zone movement vs. stability
To accurately detect clinal signatures of zone displacement,
concurrent trends in multiple genetic markers are needed to
reliably confirm evidence of zone movement (Barton &
Hewitt1985;Buggs2007),butthishasproventobechalleng-
ing in avian hybrid zone research (Vallender et al. 2007).
Our multilocus and morphological cline analyses suggest
thebestestimateofthecentreofthezoneofgrosbeakhybrid-
ization in South Dakota is currently located at 459 km along
our collecting transect, corresponding to a longitude of
approximately 98.8°W within sampling locality eight. Most
notableperhapsistheconcordanceofourestimatedclinecen-
trewithhistoricalestimatesofthemajorareaofhybridization.
In the 1960s and 1970s, Anderson & Daugherty (1974) found
the greatest frequency of morphological hybrid grosbeaks to
be just northwest of Greenwood, SD (98.4°W), based on
hybrid index scores. Near Greenwood, 63% of the individu-
alscollected byAnderson&Daugherty(1974)wereclassified
as hybrids, and our sampling in this area (locality 9, average
distance of 498 km) also yielded the highest frequency of
morphologicalhybrids(44%intermediate + otherhybrids).
However,webelievehybriditymaybegrosslyoverestimated
using Anderson and Daugherty’s hybrid index. Differences
in phenotypic and genotypic hybrid frequency reflect the
importance of investigating both morphological and geno-
typic variation when studying hybrid zones in the present
day.
We re-evaluated Anderson and Daugherty’s original
data using cline analysis of historical hybrid index
scores, and our results suggest the historical hybrid
zone centre was more accurately positioned at 449 km
(about 99.1°W), approximately 50 km westward of the
investigators’ previous estimate of the major area of
hybridization (with the greatest proportion of admixed
individuals) near Greenwood, SD. At 99.1°W near St.
Charles, SD, Anderson and Daugherty (1974) found
more equal proportions of Pheucticus ludovicianus and Phe-
ucticus melanocephalus, and therefore this location is a bet-
ter estimate of the midpoint between the grosbeak species
and the historical hybrid zone centre. Like Anderson &
Daugherty (1974), we combined subadult and adult males
in our analyses of contemporary grosbeak hybridity to be
consistent with historical sampling in South Dakota and
reduce scoring bias between the two studies. Although
we are confident that subadult and adult males were
accurately scored using this method; applying further
morphological age class corrections to both historical and
contemporary males may be a better estimate of hybridity
in this zone, but was not possible at this time.
Our tests further suggest no significant difference
between historical and contemporary cline centre esti-
mates, 449 km and 435 km respectively. Such similarity
between past and present cline centres implies no sig-
nificant movement of the transition point between spe-
cies or the grosbeak hybrid zone in South Dakota over
the past 40 years, providing overall support for the sta-
bility of the Grosbeak hybrid zone during this time
span. Additionally, limited biparental gene flow
between grosbeak species (relatively narrow nuclear
DNA clines) and low maternal gene flow (narrow
mtDNA cline) across the zone of hybridization suggests
the maintenance of species boundaries. Interestingly,
the first record of P. melanocephalus and P. ludovicianus
contact in South Dakota was reported in 1856 approxi-
mately just 6 km east of the historical cline center at
99.1°W (Baird 1858) and hybridization was first docu-
mented in 1937 about 25 km west of 99.1°W (West 1962);
this data further suggests the grosbeak hybrid zone
may have remained stable in its location for an even
longer time period, perhaps over the past 150 years.
Next, we considered the variation in zone widths among
contemporary characters, ranging from 82–356 km wide
(Table 3). The most likely contemporary cline width con-
sidering all five characters was determined by our tests to
be 187 km, the average width of the five clines (model B).
Past and present estimates of hybrid zone width deter-
HYBRIDIZATION IN GROSBEAKS 3263
Ó 2009 Blackwell Publishing Ltd
9. mined from the clines obtained from the historical and con-
temporary hybrid index score data differed substantially,
198 km and 106 km respectively, and were determined to
be significantly different; this may initially suggest that the
width of the grosbeak hybrid zone has narrowed approxi-
mately 90 kmoverthe past40 years.Alternatively, therel-
atively narrow single cline width estimated for the
contemporaryhybridindexclinemaybeunderestimateddue
to the smaller sample size of individuals across the hybrid
zone (this study N ¼ 128 males, Anderson & Daugherty
1974, N ¼ 363 males). Likewise, the single historical hybrid
index cline width may be overestimated due to Anderson
and Daugherty’s likely over-count of historical hybrids.
This inconsistency utilizing a single character demon-
strates the importance of considering both morphological
and genetic characteristics of modern hybrid zones. We
suggest the five-cline contemporary cline width average of
187 km is a more accurate estimate of the current zone
width because it incorporates both genetic (nDNA and
mtDNA) data and morphological data (hybrid index and
PC1) to best characterize hybrid zone width; this estimate is
remarkably similar to the historical hybrid index cline
width estimate of 198 km, which would again offer support
to the overall stability of the grosbeak hybrid zone over the
past40 years.
Evaluating hybrid zone models
It has been argued that extrinsic selection has played a
primary role in the formation and maintenance of avian
hybrid zones in the Rocky Mountain — Great Plains suture
zone through the past and present influence of tempera-
ture, precipitation, and aspect in this region (Swenson
2006). Sibley & Short (1959) suggested the extrinsic influ-
enceof climatechange andman’streeplantingcreatedsuit-
able habitat in the Great Plains allowing contact between
another hybridizing passerine species pair, the Indigo Bun-
ting (Passerina cyanea) and Lazuli Bunting (Passerina amoena).
Habitat isolation has also been proposed to be maintaining
boundariesbetweentwohybridizingspeciesoftowhees(Pipilo
erythrophthalmus and Pipilo maculatus) in the Great Plains
(Sibley&West1959).Itwaspostulatedthatgrosbeakdispersal
hasbeensignificantlylimitedbythelackofsuitablehabitateast
of the Missouri River (Rising 1983) and by habitat destruction
resulting from reservoir construction along the Missouri River
(Anderson 1971; Anderson & Daugherty 1974; Kroodsma
1974a). Anderson and Daugherty neglected to collect along
Lake Francis Case in the 1960s, which was likely due to the
transition and inundation of woodland habitat along the
Missouri River following the construction of Fort Randal Dam
& Francis Case Reservoir in 1956; alternatively, Anderson and
Daugherty successfully collected grosbeaks south of the reser-
voir, along Ponca Creek. In 2007, we conversely found the
greatest frequency of heterospecifics and hybrids along Lake
Francis Case; this demonstrates, that although habitat charac-
teristics within the grosbeak hybrid zone have changed sig-
nificantly over the past 40 years, grosbeak hybridization is
still occurring (although not commonly) in the same location
in South Dakota. Therefore, extrinsic environmental factors
may have had little influence on the stability of the grosbeak
hybridzoneovertime.
Alternatively, we suggest intrinsic endogenous fac-
tors, the interaction between species, may be more
responsible for the maintenance of zone centre and
width over the past 40 years. Our cline analyses indi-
cate the position and width of the grosbeak hybrid zone
has remained stable over this time period, and this sta-
bility and narrow cline widths may suggest the intrinsic
maintenance of the hybrid zone in the face of environ-
mental transition. Anderson & Daugherty (1974) histori-
cally found a significant decrease in hybrid female
clutch size compared to pure female clutch size, imply-
ing reduced female hybrid fitness and suggesting Hal-
dane’s Rule [1922, which expects the heterogametic sex
(avian females) to exhibit reduced fitness before the
homogametic sex] may be important within the zone of
contact. In addition to Haldane’s Rule, positive assortative
mating was previously suggested to be occurring in the
grosbeak hybrid zone (West 1962; Anderson & Daugherty
1974), and other passerine hybrid zones in the Great
Plains (Sibley & West 1959; Baker & Baker 1990; Baker &
Boylan 1999). In other studies of hybridizing avian species
pairs, character displacement of male plumage traits has
been shown to be sex linked in sympatric hybridizing
bird populations (Sætre et al. 2003), and can strongly
influence the presence of female assortative mating in
hybrid zones (Sætre et al. 1997) and contribute to zone
stability and maintenance. Although, we made no direct
measurements regarding clutch size or overall fitness of
hybridizing pairs; the position and extent of the con-
temporary grosbeak hybrid zone compared to the
historical zone does support Anderson and Daugherty’s
hypothesis of reduced hybrid fitness. Future study of
genomic variation and, comparison of patterns of autoso-
mal and sex-linked loci across the hybrid zone will pro-
vide a better understanding of the intrinsic factors
maintaining zone stability.
The three classic models of hybrid zone maintenance
propose differing roles for extrinsic and intrinsic selection in
hybrid zones. The bounded hybrid superiority model pre-
dicts hybrid zones to occur in ecologically transitional areas
and predicts a higher frequency and higher fitness of hybrids
compared to parentals in intermediate environments. We
suggest both past and present hybrid frequency estimates
were overestimated using the hybrid index scoring methods
of Anderson and Daugherty, and argue grosbeak hybrids are
rareinthishybridzone.Sincetherearemanydifficultiesasso-
ciated with morphological variation between these grosbeak
3264 R. D. METTLER and G. M. SPELLMAN
Ó 2009 Blackwell Publishing Ltd
10. species(and hybrids),utilizingadmixturemodels (Buerkle&
Lexer2008)and/orhistorical DNAsamplesmayaid inbetter
estimation of both past and present hybrid frequencies. Our
evidence of low hybrid frequency, narrow cline widths, and
reduced hybrid fitness effectively reject hybrid superiority as
aplausiblemodelforthishybridzone.
The ecological gradient hypothesis alternatively pre-
dicts a lower occurrence of hybrids compared to pure
types along an environmental gradient, which would help
explain the gradual transition in morphologies and hybrid
frequencies across the zone of hybridization. However, as
previously mentioned, there have been dramatic changes in
habitat composition along the Missouri River due to dam
erection and flood-plain inundation since the time of
Anderson & Daugherty’s (1974) study. If environmental
selection during such habitat transition was indeed
occurring and the grosbeak species were tracking the
changing environment, the ultimate result would be zone
movement (change in zone centre or width). We have
provided evidence that the grosbeak hybrid zone has
remained stable in both location and width for at least
the last 40 years (and potentially for the past 150 years
or more); therefore, the grosbeak hybrid zone is not likely
maintained by environmental gradients (in habitat).
The general narrow width of our clines and stability of
the grosbeak hybrid zone over the past 40 years in the face
of dramatic environmental change indicate selection against
hybrids is a primary mechanism responsible for the main-
tenance of this hybrid zone. Historical data additionally
suggests the interactions between organisms via positive
assortative mating (West 1962; Anderson & Daugherty
1974) are an important influence on the grosbeak hybrid
zone. Within the hybrid zone, pure grosbeak species are at
the edge of their respective distributions, andtherefore dis-
persal into the zone is likely low. For these reasons, we sug-
gest the grosbeak hybrid zone is best described by the
dynamic equilibrium model, which proposes the zone has
likely been maintained by a balance between dispersal into
the zone and selection against hybrids; this qualifies the
grosbeak hybrid zone best as a tension zone. Price (2008)
demonstrated that hybrid zones between long-diverged
taxa are often characterized by relatively narrow zone
widths and low proportions of hybrids in the centre of the
zone, classifying these zones as tension zones. Additionally,
Price(2008)suggestssuchtensionzonesmaybelikelytoexhi-
bit a high degree of both prematingand postmatingisolation,
including social and ecological selection and selection
against hybrids. The (mtDNA cyt b) divergence between P.
melanocephalus and P. ludovicianus was previously estimated
at 2.2 million years (Klicka & Zink 1997), therefore we
argue the deep divergence between these species, indication
of hybrid fitness reduction, and narrow width of the gros-
beak hybrid zone best categorizes this zone as a tension
zoneaccordingtoPrice.
Conclusion
Hybrid zones have been described as ‘natural laboratories
for the study of evolutionary biology’ (Hewitt 1988). As in
the laboratory, the ability to study an experiment over time
enhances the conclusions that can be drawn from the data.
In this study, the ability to compare hybrid zone dynamics
from contemporary and historical samples (separated by
40 years)providedameansoftestinghypothesesaboutthe
evolutionofahybridzone,andalsoprovidedadditionalsup-
port(stablelocationandwidthofthehybridzone)fortheclas-
sification of the grosbeak hybrid zone as a tension zone.
Although,ourabilitytoinfertheexactevolutionaryprocesses
responsible for maintaining zone stability are beyond the
reachofthedatapresentedhere;recentadvancesinobtaining
genomic data from museum skins to compare to genomic
data from the contemporary samples could certainly further
elucidatetheevolutionaryarchitectureofthehybridzoneand
perhapsthearchitectureofspeciationinthesetwospecies.
Acknowledgements
We thank John Klicka with the Marjorie Barrick Museum of Natu-
ral History and the Bell Museum of Natural History for providing
tissue samples for this study. We also thank Doug Backlund and
state and federal agencies for collecting permits, the numerous
wildlife officers for their cooperation, committee members Cyn-
thia M. Anderson, Shane K. Sarver, Dave H. Siemens, and Scott F.
Stoltenberg for comments and advice on early drafts of this manu-
script, andJessMoser,ForrestCain, andShane Ziegenbein for field
assistance. Additional thanks to Parthasarathi Nag for help with
cline construction. Laboratory work was completed at the Center
for the Conservationof Natural Resources (CCBR)/Western South
Dakota DNA Core Facility (WestCore) on the campus of Black
Hills State University. This project was funded in part by CCBR/
EPA Grant # US EPA CR-83152201-0 and funding from
Black Hills State University. The project described was also sup-
ported in part by Grant Number 2 P20 RR016479from the National
CenterforResearchResources(NCRR),acomponentoftheNational
Institutes of Health (NIH). Its contents are solely the responsibility
of the authors and do not necessarily represent the official views
of NCRRorNIH.
References
Anderson BW (1971) Man’s influence on hybridization in two
avianspeciesin SouthDakota.The Condor,73,342–347.
Anderson BW, Daugherty RJ (1974) Characteristics and reproduc-
tivebiology of grosbeaks(Pheucticus) in the hybridzone in South
Dakota. WilsonBulletin,86,1–11.
BairdSF (1858) Birds,in PacificRailroadReports,Vol.9. Ivi + 1005pp,
Washington,DC.
Baker MH, Baker AEM (1990) Reproductive behavior of female
buntings: isolating mechanisms in a hybridizing pair of species.
Evolution,44,332–338.
Baker MC, Boylan JT (1999) Singing behavior, mating associations
and reproductive success in a population of hybridizing lazuli
andindigobuntings.Condor, 101,493–504.
HYBRIDIZATION IN GROSBEAKS 3265
Ó 2009 Blackwell Publishing Ltd
11. Bandelt H-J, Forster P, Ro¨hl A (1999) Median-joining networks for
inferring intraspecific phylogenies. Molecular Biology and
Evolution,16,37–48.
Barton NH (2001) The role of hybridization in evolution. Molecular
Ecology,10,551–568.
Barton NH, Baird SJE (1996) Analyse 1.30 PPC. Available at http://
www.biology.edsac.uk/research/institutes/evolution/software/
Mac/Analyse/index.html.
Barton NH, Hewitt GM (1985) Analysis of hybrid zones. Annual
Reviewof EcologyandSystematics,16, 113–148.
Birkhead TR, Brillard J-P (2007) Reproductive isolation in birds:
postcopulatory prezygotic barriers. Trends in Ecology & Evolution,
22,266–272.
Buerkle CA, Lexer C (2008) Admixture as the basis for genetic
mapping.TrendsinEcology& Evolution,23,686–694.
Buggs RJA (2007) Empirical study of hybrid zone movement.
Heredity,99,301–312.
Dobzhansky T (1937) Genetics and the Origin of Species. Columbia
University Press,NewYork.
Endler JA (1977) Geographic Variation, Speciation, and Clines. Princeton
UniversityPress,Princeton,NewJersey.
Fu Y-X, Li W-H (1993) Statistical test of neutrality of mutation.
Genetics,133,693–709.
Grant PR, Grant BR (1997) Genetics and the origin of bird species.
ProceedingsoftheNationalAcademyofSciences,USA,94,7768–7775.
Hackett SJ (1996) Molecular phylogenetics and biogeography of
tanagers in the genus Ramphocelus (Aves). Molecular Phylogenetics
andEvolution,5,368–382.
Haldane JBS (1922) Sex ratio and unisexual sterility in hybrid
animals.JournalofGenetics,12,101–109.
Hastings WK (1970) Monte Carlo sampling methods using
Markovchainsandtheapplications.Biometrika,57,97–109.
Hewitt GM (1988) Hybrid zones-natural laboratories for
evolutionarystudies.TrendsinEcology& Evolution,3,158–167.
Hilborn R, Mangel M (1997) The Ecological Detective: Confronting
Models with Data. Princeton University Press, Princeton, New
Jersey.
Hill GE (1995) Black-headed grosbeak (Pheucticus melanocephalus).
In: The Birds of North America, no. 143 (eds Poole A, Gill F). The
Academy of Natural Sciences, Philadelphia, and The American
Ornithologists’Union,Washington,DC.
Johnson KP, Sorenson MD (1998) Comparing molecular evolution
in two mitochondrial protein coding genes (cytochrome b and ND2)
in the dabbling ducks (Tribe Anatini). Molecular Phylogenetics and
Evolution,10,82–94.
Key KHL (1968) The concept of stasipatric speciation. Systematic
Zoology,17,14–22.
Klicka J, Zink RM (1997) The importance of recent ice ages in
speciation:afailedparadigm.Science, 277,1666–1669.
Kroodsma RL (1974a) Species-recognition behavior of territorial
male rose-breasted and black-headed grosbeaks (Pheucticus).
TheAuk,91,54–64.
Kroodsma RL (1974b) Hybridization in grosbeak (Pheucticus) in
NorthDakota.WilsonBulletin,86,230–236.
Mayr E (1942) Systematics and the Origin of Species. Columbia
University Press,NewYork.
Metropolis N, Rosenbluth AW, Rosenbluth MN, Teller AH,
Teller E (1953) Equations of state calculations by fast computing
machines.The JournalofChemicalPhysics,21,1087–1092.
Milne I, Wright F, Rowe G, Marshall DF, Husmeier D, McGuire G
(2004) TOPALi: software for automatic identification of recom-
binant sequences within DNA multiple alignments. Bioinformatics,
20,1806–1807.
Moore WS (1977) An evaluation of narrow hybrid zones in
vertebrates.TheQuarterlyReviewof Biology,52,263–277.
Nei M (1987) Molecular Evolutionary Genetics. Columbia University
Press,NewYork.
Price TD (2008) Speciation in Birds. Roberts and Company, Greenwood
Village,Colorado.
Price TD, Bouvier MM (2002) The evolution of F1 postzygotic
incompatibilitiesin birds.Evolution,56, 2083–2089.
Remington CL (1968) Suture-zones of hybrid interaction between
recentlyjoinedbiotas.EvolutionaryBiology,2, 321–428.
Rising JD (1970) Morphological variation and evolution in some
NorthAmericanOrioles.SystematicZoology,19,315–351.
Rising JD (1983) The great plains hybrid zones. Current Ornithology,
1,131–157.
Rozas J, Sa´nchez-DelBarrio JC, Messeguer X, Rozas R (2003)
DnaSP, DNA polymorphism analyses by the coalescent and
othermethods.Bioinformatics,19,2496–2497.
Sætre G-P, Moum T, Bures S, Kra´l M, Adamjan M, Moreno J (1997)
A sexually selected character displacement in flycatchers rein-
forcesprezygotic isolation.Nature,387,589–592.
Sætre G-P, Borge T, Lindroos K, Haavie J, Sheldon BC, Primmer C,
Syva¨nen A-C (2003) Sex chromosome evolution and speciation
in Ficedula flycatchers. Proceedings of the Royal Society B: Biological
Sciences,270,53–59.
Secondi J, Faivre B, Bensch S (2006) Spreading introgression in the
wake of a moving contact zone. Molecular Ecology, 15, 2463–
2475.
Short LL (1965) Hybridization in the flickers (Colaptes) of North
America. Bulletin of the American Museum of Natural History, 129,
307–428.
Sibley CG, Short LL (1959) Hybridization in the buntings
(Passerina) in thegreatplains.TheAuk,76,443–463.
Sibley CG, Short LL (1964) Hybridization in the orioles of the Great
Plains.TheCondor,66,130–150.
Sibley CG, West DA (1959) Hybridization of the rufous-sided
towheesofthe greatplains.TheAuk,16,326–338.
Stephens M, Scheet P (2005) Accounting for decay of linkage
disequilibrium in haplotype inference and missing data
imputation.AmericanJournalofHumanGenetics,76,449–462.
Stephens M, Smith NJ, Donnelly P (2001) A new statistical method
for haplotype reconstruction from population data. American
Journalof HumanGenetics,68,978–989.
Swenson NG (2006) GIS-based niche models reveal unifying
climatic mechanism that maintain the location of avian zones in
a North American suture zone. Journal of Evolutionary Biology,
19,717–725.
Swenson NG, Howard DJ (2004) Do suture zones exist? Evolution,
58,2391–2397.
Swenson NG, Howard DJ (2005) Clustering of contact zones,
hybrid zones, and phylogeographic breaks in North America.
TheAmericanNaturalist,166,581–191.
Swofford DL (2001) PAUP*. Phylogenetic Analysis Using Parsimony
and Other Methods 4.0b10. Sinauer & Associates, Sunderland,
Massachusetts.
Szymura JM, Barton NH (1986) Genetic analysis of a hybrid zone
between the fire-bellied toads, Bombina bombina and B. variegata,
nearCracowinsouthernPoland.Evolution,40,1141–1159.
Tajima F (1983) Evolutionary relationships of DNA sequences in
finitepopulations.Genetics,105,437–460.
3266 R. D. METTLER and G. M. SPELLMAN
Ó 2009 Blackwell Publishing Ltd
12. Tajima F (1989) Statistical method for testing the neutral mutation
hypothesisbyDNApolymorphism. Genetics,123,585–595.
Tajima F (1993) Measurement of DNA polymorphism. In:
Mechanisms of Molecular Evolution. (eds Takahata N, Clark AG),
pp.37–59.Sinauer&Associates.,Sunderland,Massachusetts.
Vallender R, Robertson RJ, Friesen VL, Lovette IJ (2007) Complex
hybridization dynamics between golden-winged and blue-
winged warblers (Vermivora chrysoptera and Vermivora pinus)
revealed by AFLP, microsatellite, intron and mtDNA markers.
MolecularEcology,16,2017–2029.
West DA (1962) Hybridization in grosbeaks (Pheucticus) of the
greatplains.The Auk,79,399–424.
Wyatt VE, Francis CM (2002) Rose-breasted grrosbeak (Pheucticus
ludovicianus). In: The Birds of North America, no. 692 (eds Poole A,
GillF).Birdsof NorthAmerica,Philadelphia,Pennsylvania.
The described research partially fulfilled Raeann D. Mettler’s
requirements for the Integrative Genomics graduate program
at Black Hills State University. Garth M. Spellman is an assis-
tant professor of vertebrate evolution interested in speciation,
biogeography and evolution of North American birds.
Supporting information
Additional supporting information may be found in the online
version of this article:
Table S1 Primer information for four nuclear genes (PCBD1,
FGB, RHO, and MUSK) and one mtDNA gene (mt-ND2) and
annealing temperatures (Ta).
Table S2 Best-fitsubstitutionmodelsat each locus, rate heteroge-
neity (C), proportion on invariant sites (pINV), log-likelihood of
model (-l), Akaike information criterion (AIC1), AIC with second
order correction (AIC2), and proportion of transitions to transver-
sions(Ts/Tv).
Figure S1 Network relationships of the four nuclear genes: a.
PCBD1, b. RHO, c. FGB, d. MUSK.
Please note: Wiley-Blackwell are not responsible for the content
or functionality of any supporting information supplied by the
authors. Any queries (other than missing material) should be
directed to the corresponding author for the article.
HYBRIDIZATION IN GROSBEAKS 3267
Ó 2009 Blackwell Publishing Ltd