More Related Content
Similar to holiday visitor infographic r7 (20)
holiday visitor infographic r7
- 1. CHRISTMAS VISITOR STATISTICS
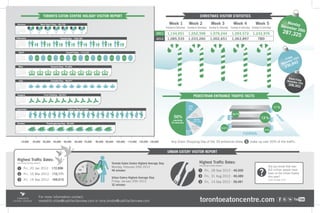
PEDESTRIAN ENTRANCE TRAFFIC FACTS
URBAN EATERY VISITOR REPORT
Toronto Eaton Centre Highest Average Stay
Monday, February 20th 2012
46 minutes
Urban Eatery Highest Average Stay
Friday, January 20th 2012
32 minutes
1 2 3 4 5 6 7
8 9 10 11 12 13 14
15 16 17 18 19 20 21
22 23 24 25 26 27 28
29 30 31
January
1 2 3 4 5 6 7
8 9 10 11 12 13 14
15 16 17 18 19 20 21
22 23 24 25 26 27 28
29 30 31
February
1 2 3 4 5 6 7
8 9 10 11 12 13 14
15 16 17 18 19 20 21
22 23 24 25 26 27 28
29 30 31
April
New Year's Day - 69,150
Good Friday - 113,530
1 2 3 4 5 6 7
8 9 10 11 12 13 14
15 16 17 18 19 20 21
22 23 24 25 26 27 28
29 30 31
May
1 2 3 4 5 6 7
8 9 10 11 12 13 14
15 16 17 18 19 20 21
22 23 24 25 26 27 28
29 30 31
July
1 2 3 4 5 6 7
8 9 10 11 12 13 14
15 16 17 18 19 20 21
22 23 24 25 26 27 28
29 30 31
August
1 2 3 4 5 6 7
8 9 10 11 12 13 14
15 16 17 18 19 20 21
22 23 24 25 26 27 28
29 30 31
September
1 2 3 4 5 6 7
8 9 10 11 12 13 14
15 16 17 18 19 20 21
22 23 24 25 26 27 28
29 30 31
October
Family Day - 106,184
Canada Day - 96,971
Labour Day121,642
Thanksgiving Day - 96,360
Civic Holiday - 86,035
Fri, 28 Sep 2012 - 40,500
Fri, 31 Aug 2012 - 40,489
Fri, 14 Sep 2012 - 39,481
Did you know that over
8.6 million people have
been to the Urban Eatery
this year?
(Until October 31st)
?
5
10.7%
13 %
10.2%
6.3%
11 %
Victoria Day - 91,893
Week 1 Week 2 Week 3 Week 4 Week 5
Sunday to Saturday Sunday to Saturday Sunday to Saturday Sunday to Saturday Sunday to Saturday
1,134,051 1,052,398 1,079,244 1,093,572 1,232,976
1,085,535 1,033,260 1,002,651 1,063,897 TBD
MondayDecember 26th287,325
Fri, 20 Jan 2012 - 172,896
Fri, 16 Mar 2012 - 172,171
Fri, 14 Sep 2012 - 169,515
1
2
3
1
2
3
Highest Traffic Dates:
(excluding holiday season)
torontoeatoncentre.com
For more information contact:
meredith.vlitas@cadillacfairview.com or lorie.brodie@cadillacfairview.com
10,000 20,000 30,000 40,000 50,000 60,000 70,000 80,000 90,000 100,000 110,000 120,000 130,000
TORONTO EATON CENTRE HOLIDAY VISITOR REPORT
Friday
December 23rd
236,843
Black FridayNovember 25th
206,952
50%
remaining
34 entrances
13%
11%
10.7%
10.2%
6.3%
Dundas
Level-1
Dundas
Level-2
Queen Subway
South
Yonge & Dundas
Queen Street
1
2
3
4
567
8
9
10
11
12
Any Given Shopping Day of the 39 entrances these make up over 50% of the traffic.Any Given Shopping Day of the 39 entrances these make up over 50% of the traffic.
Highest Traffic Dates:
(excluding holiday season)
2011
2012