SlideShare a Scribd company logo
1 of 3
Download to read offline
Property Address Purchase
Date
Sale Date Purchase
Price
Rehab
Costs
Sale
Price
Net
Profit
Gross
Return
828 W Poplar St 1/29/2010 7/13/2010 $122,755 $49,834 $237,300 $40,012 23%
502 E 21st St 3/31/2010 6/6/2011 $211,963 $73,241 $425,000 $103,229 36%
410 Gray Ave 6/17/2010 12/6/2010 $30,500 $9,646 $51,000 $10,659 27%
707 N Elizabeth St 6/17/2010 12/6/2010 $35,500 $14,280 $59,600 $9,658 19%
711 Elizabeth St 6/17/2010 12/6/2010 $30,500 $9,142 $49,500 $9,566 24%
1901 E McMillan St 10/13/2010 6/2/2011 $122,085 $56,481 $244,000 $44,597 25%
1122 E 88th Pl 1/26/2011 8/1/2011 $118,892 $51,390 $220,000 $28,075 16%
428 E 61st St 5/4/2011 6/14/2011 $275,055 $0 $296,500 $19,870 7%
1339 E Greenleaf Blvd 2/17/2011 8/22/2011 $209,069 $76,255 $360,000 $43,510 15%
710 N Pearl Ave 8/25/2011 8/26/2011 $83,348 $0 $93,400 $10,052 12%
826 E 109th Pl 6/29/2011 3/2/2012 $227,188 $56,093 $350,000 $41,389 15%
1348 E 27th St 11/22/2011 3/2/2012 $226,238 $56,646 $350,000 $46,264 16%
311 Vannoy Park Lane, S.E. 10/27/2011 3/20/2012 $63,264 $17,343 $141,900 $50,770 63%
231 Vannoy Park Lane, S.E. 10/27/2011 4/2/2012 $63,264 $17,343 $154,000 $58,762 73%
323 Vannoy Park Lane, S.E. 10/27/2011 4/5/2012 $63,264 $17,343 $139,900 $47,737 59%
319 Vannoy Park Lane, S.E. 10/27/2011 4/27/2012 $63,264 $17,343 $142,400 $48,383 60%
235 Vannoy Park Lane, S.E. 10/27/2011 5/22/2012 $63,264 $17,343 $150,000 $53,435 66%
327 Vannoy Park Lane, S.E. 10/27/2011 5/24/2012 $63,264 $17,343 $144,900 $50,529 63%
4716 E McMillan St 11/22/2011 5/23/2012 $136,295 $42,756 $235,000 $35,885 20%
737 W 138th St 8/25/2011 5/22/2012 $140,426 $47,674 $229,000 $19,739 10%
247 Vannoy Park Lane, S.E. 10/27/2011 5/29/2012 $63,264 $17,343 $147,900 $51,928 64%
259 Vannoy Park Lane, S.E. 10/27/2011 6/4/2012 $63,264 $17,343 $154,900 $59,098 73%
415 E 101st St 7/29/2011 6/6/2012 $126,479 $50,180 $222,000 $29,117 16%
613 E 118th St 12/29/2011 6/28/2012 $126,635 $49,175 $229,000 $31,533 18%
1332 W 92nd St 11/1/2011 6/29/2012 $271,717 $29,009 $367,000 $39,351 13%
244 Vannoy Park Lane, S.E. 10/27/2011 7/2/2012 $63,264 $17,343 $144,900 $48,902 61%
248 Vannoy Park Lane, S.E. 10/27/2011 7/5/2012 $63,264 $17,343 $139,900 $47,279 59%
316 Vannoy Park Lane, S.E. 10/27/2011 7/13/2012 $63,264 $17,343 $149,900 $52,827 66%
721 W Spruce St 7/5/2011 7/11/2012 $198,804 $77,324 $330,000 $28,914 10%
315 Vannoy Park Lane, S.E. 10/27/2011 7/16/2012 $63,264 $17,343 $139,900 $47,466 59%
143 E 99th Street 10/20/2011 7/24/2012 $137,972 $70,836 $285,000 $47,344 23%
328 Vannoy Park Lane, S.E. 10/27/2011 7/26/2012 $63,264 $17,343 $154,900 $59,194 73%
3907 Brighton Ave 12/27/2011 7/27/2012 $208,450 $72,609 $380,000 $65,044 23%
260 Vannoy Park Lane, S.E. 10/27/2011 8/3/2012 $63,264 $17,343 $144,900 $49,353 61%
252 Vannoy Park Lane, S.E. 10/27/2011 8/10/2012 $63,264 $17,343 $139,900 $48,336 60%
320 Vannoy Park Lane, S.E. 10/27/2011 8/24/2012 $63,264 $17,343 $149,900 $56,790 70%
331 E 92nd St 4/18/2012 8/28/2012 $128,841 $47,476 $220,000 $29,460 17%
1922 W 73rd St 3/11/2011 8/30/2012 $193,676 $79,217 $320,000 $20,078 7%
1024 W 105th St 12/28/2011 9/20/2012 $129,963 $54,430 $239,000 $31,382 17%
AH RESIDENTIALTRACK RECORD
Property Address Purchase
Date
Sale Date Purchase
Price
Rehab Sale
Price
Net
Profit
Gross
Margin
823 W Elm St 11/21/2011 9/20/2012 $134,775 $43,814 $226,000 $24,468 14%
304 Vannoy Park Lane, S.E. 10/27/2011 9/27/2012 $63,264 $17,343 $149,900 $51,328 64%
251 Vannoy Park Lane, S.E. 10/27/2011 9/27/2012 $63,264 $17,343 $149,900 $56,026 70%
256 Vannoy Park Lane, S.E. 10/27/2011 9/28/2012 $63,264 $17,343 $139,900 $45,404 56%
308 Vannoy Park Lane, S.E. 10/27/2011 9/28/2012 $63,264 $17,343 $149,900 $51,134 63%
138 W 112th St 9/20/2011 10/1/2012 $202,235 $74,823 $335,000 $28,779 10%
610 S Harris Ave 2/21/2012 10/18/2012 $223,813 $71,405 $365,000 $41,820 14%
300 Vannoy Park Lane, S.E. 10/27/2011 10/18/2012 $63,264 $17,343 $150,000 $52,705 65%
239 Vannoy Park Lane, S.E. 10/27/2011 10/24/2012 $63,264 $17,343 $149,900 $50,764 63%
324 Vannoy Park Lane, S.E. 10/27/2011 10/30/2012 $63,264 $17,343 $149,900 $50,239 62%
14906 S Wadsworth Ave 12/7/2011 10/30/2012 $129,042 $58,233 $239,900 $30,703 16%
312 Vannoy Park Lane, S.E. 10/27/2011 11/7/2012 $63,264 $17,343 $149,900 $49,789 62%
255 Vannoy Park Lane, S.E. 10/27/2011 11/16/2012 $63,264 $17,343 $150,000 $50,469 63%
837 W 81st St 10/13/2011 12/6/2012 $221,148 $78,849 $385,000 $55,072 18%
1500 W 102nd St 3/21/2012 12/6/2012 $206,873 $88,861 $385,000 $63,768 22%
243 Vannoy Park Lane, S.E. 10/27/2011 12/7/2012 $63,264 $17,343 $149,900 $50,254 62%
8616 Holmes Ave 1/31/2012 12/21/2012 $126,870 $60,028 $250,000 $39,145 21%
150 E 61st St 3/7/2012 12/21/2012 $167,254 $90,135 $339,000 $48,561 19%
1445 E 49th St 11/17/2011 12/28/2012 $132,628 $51,619 $235,000 $29,687 16%
200 E Artesia Blvd 5/1/2012 1/16/2013 $222,603 $83,152 $375,000 $42,959 14%
2006 W 54th St 10/27/2011 1/24/2013 $222,121 $73,317 $365,000 $32,966 11%
2520 S Longwood 6/18/2012 2/5/2013 $210,691 $84,927 $375,000 $43,414 15%
346 E 76th St 4/25/2012 2/14/2013 $197,488 $79,480 $350,000 $37,656 14%
4314 S Kansas Ave 5/25/2012 2/25/2013 $182,274 $107,421 $380,000 $61,797 21%
341 E 69th St 2/24/2012 3/15/2013 $187,600 $88,274 $339,000 $35,782 13%
755 E 79th St 7/27/2012 3/15/2013 $217,615 $70,170 $350,000 $29,147 10%
158 E 47th St 3/26/2012 3/26/2013 $214,894 $85,884 $365,000 $35,767 12%
905 W 74th St 3/14/2012 3/14/2013 $198,134 $93,037 $368,000 $42,636 15%
11542 S Van Ness Ave 9/28/2012 4/12/2013 $192,713 $73,690 $322,500 $32,837 12%
1427 W 95th St 6/18/2012 4/26/2013 $209,276 $75,858 $365,000 $43,459 15%
4462 S San Pedro St 4/13/2012 5/15/2013 $131,594 $63,752 $250,000 $28,469 15%
4119 McKinley Ave 9/21/2012 6/6/2013 $212,882 $76,073 $356,000 $36,229 13%
910 Larch St 10/24/2012 7/12/2013 $197,690 $92,744 $380,000 $66,610 23%
3048 West Blvd 12/28/2011 7/23/2013 $196,155 $156,971 $465,000 $74,253 21%
6430 Victoria Ave 8/30/2012 7/23/2013 $101,975 $81,247 $265,000 $41,798 23%
140 W 50th St 7/13/2012 7/29/2013 $219,242 $95,157 $399,990 $55,290 18%
629 E 37th St 11/30/2012 7/31/2013 $221,481 $73,943 $387,000 $56,930 19%
854 E 55th St 7/9/2012 10/16/2013 $211,698 $36,442 $265,000 $10,302 4%
1110 W 54th St 8/3/2012 11/4/2013 $172,026 $102,905 $365,000 $55,398 20%
852 W 50th Pl 1/16/2013 11/6/2013 $249,019 $94,770 $430,000 $52,622 15%
Property Address Purchase
Date
Sale Date Purchase
Price
Rehab Sale Price Net
Profit
Gross
Margin
3441 Hyde Park Blvd 8/30/2012 11/8/2013 $101,975 $80,103 $263,000 $55,094 30%
9401 Pace Ave 1/12/2012 11/27/2013 $186,222 $173,266 $375,000 -$14,805 -4%
4313 Crocker St 12/13/2012 12/3/2013 $207,320 $95,808 $380,000 $43,310 14%
429 E 47th St 8/13/2013 12/5/2013 $244,588 $75,532 $365,000 $16,639 5%
1648 W 83rd St 6/7/2013 12/10/2013 $249,625 $100,169 $421,000 $34,996 10%
121 W 105th St 4/23/2013 12/19/2013 $222,984 $95,856 $370,000 $24,595 8%
1372 E 22nd St 8/8/2013 1/6/2014 $226,942 $107,851 $400,000 $43,391 13%
1702 W 57th St 2/12/2013 2/13/2014 $223,706 $101,158 $379,900 $28,453 9%
322 N Grand Ave 10/15/2012 3/10/2014 $312,466 $189,953 $651,000 $88,232 18%
1488 W 50th St 8/10/2012 3/10/2014 $226,365 $92,629 $410,000 $52,573 16%
702 E 54th St 12/4/2013 4/28/2014 $227,430 $86,578 $379,900 $38,319 12%
1048 E 49th St 10/9/2012 6/16/2014 $129,610 $106,622 $295,000 $37,470 16%
214 E Raymond St 1/16/2013 Pending $193,926 Pending Pending Pending Pending
1227 E 20th St 1/28/2013 Pending $98,899 Pending Pending Pending Pending
973 W 46th St 2/15/2013 Pending $229,503 Pending Pending Pending Pending
607 W 74th St 3/15/2013 Pending $228,594 Pending Pending Pending Pending
663 W 66th St 4/10/2013 Pending $218,270 Pending Pending Pending Pending
1262 E 33rd St 4/25/2013 Pending $176,318 Pending Pending Pending Pending
526 W 54th St 4/30/2013 Pending $216,877 Pending Pending Pending Pending
1016 E 83rd St 5/10/2013 Pending $216,424 Pending Pending Pending Pending
1100 W 110th St 5/14/2013 Pending $223,344 Pending Pending Pending Pending
802 N Harvard Blvd 5/17/2013 Pending $492,473 Pending Pending Pending Pending
1407 E 23rd St 6/7/2013 Pending $222,953 Pending Pending Pending Pending
937 W 50th Pl 7/10/2013 Pending $250,456 Pending Pending Pending Pending
451 E 49th St 7/31/2013 Pending $203,929 Pending Pending Pending Pending
319 W 71st St 11/22/2013 Pending $233,548 Pending Pending Pending Pending
726 W 75th St 1/3/2014 Pending $241,644 Pending Pending Pending Pending
1834 S Dunsmuir Ave 3/10/2014 Pending $525,000 Pending Pending Pending Pending
TOTAL/AVERAGE 100+ HOMES SOLD
$3.6 MILLION
PROFITS
30% AVERAGE
RETURNS

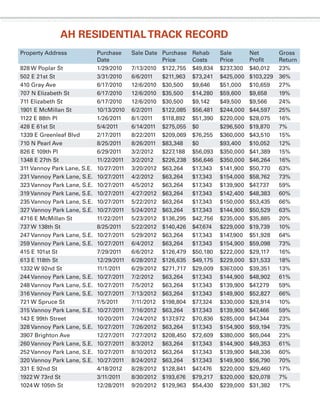
More Related Content

Similar to AH Residential Track Record

Similar to AH Residential Track Record (20)

Residential Price Trends Feeding into Cherry Creek High School 2010
Residential Price Trends Feeding into Cherry Creek High School 2010Residential Price Trends Feeding into Cherry Creek High School 2010
Residential Price Trends Feeding into Cherry Creek High School 2010
 
Lake Lanier Home Sales April 2017 Mapped
Lake Lanier Home Sales April 2017 MappedLake Lanier Home Sales April 2017 Mapped
Lake Lanier Home Sales April 2017 Mapped
 
AVERAGE PRICE HISTORY LAST THREE YEARS IN GREENWOOD VILLAGE, COLORADO
AVERAGE PRICE HISTORY LAST THREE YEARS IN GREENWOOD VILLAGE, COLORADOAVERAGE PRICE HISTORY LAST THREE YEARS IN GREENWOOD VILLAGE, COLORADO
AVERAGE PRICE HISTORY LAST THREE YEARS IN GREENWOOD VILLAGE, COLORADO
 
Dreamland Villa Homes Sold August 2014
Dreamland Villa Homes Sold August 2014Dreamland Villa Homes Sold August 2014
Dreamland Villa Homes Sold August 2014
 
20130909listings
20130909listings20130909listings
20130909listings
 
Cherry Hills Village March 2010
Cherry Hills Village March 2010Cherry Hills Village March 2010
Cherry Hills Village March 2010
 
South Orange, NJ April - May 2013 Residential Home Sales
South Orange, NJ April - May 2013 Residential Home SalesSouth Orange, NJ April - May 2013 Residential Home Sales
South Orange, NJ April - May 2013 Residential Home Sales
 
20130909listings
20130909listings20130909listings
20130909listings
 
Montclair NJ 2011 Real Estate Sales
Montclair NJ 2011 Real Estate SalesMontclair NJ 2011 Real Estate Sales
Montclair NJ 2011 Real Estate Sales
 
Lake Lanier Home Sales March 2017 Mapped
Lake Lanier Home Sales March 2017  MappedLake Lanier Home Sales March 2017  Mapped
Lake Lanier Home Sales March 2017 Mapped
 
Dreamland Villa - Active | Pending | Sold
Dreamland Villa - Active | Pending | SoldDreamland Villa - Active | Pending | Sold
Dreamland Villa - Active | Pending | Sold
 
A Three Year Sales History for Foxfield, Colorado 80016
A Three Year Sales History for Foxfield, Colorado 80016A Three Year Sales History for Foxfield, Colorado 80016
A Three Year Sales History for Foxfield, Colorado 80016
 
Fountain of The Sun Homes Sold August 2014
Fountain of The Sun Homes Sold August 2014Fountain of The Sun Homes Sold August 2014
Fountain of The Sun Homes Sold August 2014
 
Sunland Village East Market Update January 2012
Sunland Village East   Market Update  January 2012Sunland Village East   Market Update  January 2012
Sunland Village East Market Update January 2012
 
Psp listings 10 30-13
Psp listings 10 30-13Psp listings 10 30-13
Psp listings 10 30-13
 
Bloomfield 2012 sales
Bloomfield 2012 salesBloomfield 2012 sales
Bloomfield 2012 sales
 
South Orange NJ Home Sales: June 2013
South Orange NJ Home Sales: June 2013South Orange NJ Home Sales: June 2013
South Orange NJ Home Sales: June 2013
 
Lake Lanier Homes Sales Analysis August 2019
Lake Lanier Homes Sales Analysis August 2019Lake Lanier Homes Sales Analysis August 2019
Lake Lanier Homes Sales Analysis August 2019
 
Psp listings 11 14-13
Psp listings 11 14-13Psp listings 11 14-13
Psp listings 11 14-13
 
Psp listings 11 14-13
Psp listings 11 14-13Psp listings 11 14-13
Psp listings 11 14-13
 

AH Residential Track Record

  • 1. Property Address Purchase Date Sale Date Purchase Price Rehab Costs Sale Price Net Profit Gross Return 828 W Poplar St 1/29/2010 7/13/2010 $122,755 $49,834 $237,300 $40,012 23% 502 E 21st St 3/31/2010 6/6/2011 $211,963 $73,241 $425,000 $103,229 36% 410 Gray Ave 6/17/2010 12/6/2010 $30,500 $9,646 $51,000 $10,659 27% 707 N Elizabeth St 6/17/2010 12/6/2010 $35,500 $14,280 $59,600 $9,658 19% 711 Elizabeth St 6/17/2010 12/6/2010 $30,500 $9,142 $49,500 $9,566 24% 1901 E McMillan St 10/13/2010 6/2/2011 $122,085 $56,481 $244,000 $44,597 25% 1122 E 88th Pl 1/26/2011 8/1/2011 $118,892 $51,390 $220,000 $28,075 16% 428 E 61st St 5/4/2011 6/14/2011 $275,055 $0 $296,500 $19,870 7% 1339 E Greenleaf Blvd 2/17/2011 8/22/2011 $209,069 $76,255 $360,000 $43,510 15% 710 N Pearl Ave 8/25/2011 8/26/2011 $83,348 $0 $93,400 $10,052 12% 826 E 109th Pl 6/29/2011 3/2/2012 $227,188 $56,093 $350,000 $41,389 15% 1348 E 27th St 11/22/2011 3/2/2012 $226,238 $56,646 $350,000 $46,264 16% 311 Vannoy Park Lane, S.E. 10/27/2011 3/20/2012 $63,264 $17,343 $141,900 $50,770 63% 231 Vannoy Park Lane, S.E. 10/27/2011 4/2/2012 $63,264 $17,343 $154,000 $58,762 73% 323 Vannoy Park Lane, S.E. 10/27/2011 4/5/2012 $63,264 $17,343 $139,900 $47,737 59% 319 Vannoy Park Lane, S.E. 10/27/2011 4/27/2012 $63,264 $17,343 $142,400 $48,383 60% 235 Vannoy Park Lane, S.E. 10/27/2011 5/22/2012 $63,264 $17,343 $150,000 $53,435 66% 327 Vannoy Park Lane, S.E. 10/27/2011 5/24/2012 $63,264 $17,343 $144,900 $50,529 63% 4716 E McMillan St 11/22/2011 5/23/2012 $136,295 $42,756 $235,000 $35,885 20% 737 W 138th St 8/25/2011 5/22/2012 $140,426 $47,674 $229,000 $19,739 10% 247 Vannoy Park Lane, S.E. 10/27/2011 5/29/2012 $63,264 $17,343 $147,900 $51,928 64% 259 Vannoy Park Lane, S.E. 10/27/2011 6/4/2012 $63,264 $17,343 $154,900 $59,098 73% 415 E 101st St 7/29/2011 6/6/2012 $126,479 $50,180 $222,000 $29,117 16% 613 E 118th St 12/29/2011 6/28/2012 $126,635 $49,175 $229,000 $31,533 18% 1332 W 92nd St 11/1/2011 6/29/2012 $271,717 $29,009 $367,000 $39,351 13% 244 Vannoy Park Lane, S.E. 10/27/2011 7/2/2012 $63,264 $17,343 $144,900 $48,902 61% 248 Vannoy Park Lane, S.E. 10/27/2011 7/5/2012 $63,264 $17,343 $139,900 $47,279 59% 316 Vannoy Park Lane, S.E. 10/27/2011 7/13/2012 $63,264 $17,343 $149,900 $52,827 66% 721 W Spruce St 7/5/2011 7/11/2012 $198,804 $77,324 $330,000 $28,914 10% 315 Vannoy Park Lane, S.E. 10/27/2011 7/16/2012 $63,264 $17,343 $139,900 $47,466 59% 143 E 99th Street 10/20/2011 7/24/2012 $137,972 $70,836 $285,000 $47,344 23% 328 Vannoy Park Lane, S.E. 10/27/2011 7/26/2012 $63,264 $17,343 $154,900 $59,194 73% 3907 Brighton Ave 12/27/2011 7/27/2012 $208,450 $72,609 $380,000 $65,044 23% 260 Vannoy Park Lane, S.E. 10/27/2011 8/3/2012 $63,264 $17,343 $144,900 $49,353 61% 252 Vannoy Park Lane, S.E. 10/27/2011 8/10/2012 $63,264 $17,343 $139,900 $48,336 60% 320 Vannoy Park Lane, S.E. 10/27/2011 8/24/2012 $63,264 $17,343 $149,900 $56,790 70% 331 E 92nd St 4/18/2012 8/28/2012 $128,841 $47,476 $220,000 $29,460 17% 1922 W 73rd St 3/11/2011 8/30/2012 $193,676 $79,217 $320,000 $20,078 7% 1024 W 105th St 12/28/2011 9/20/2012 $129,963 $54,430 $239,000 $31,382 17% AH RESIDENTIALTRACK RECORD
  • 2. Property Address Purchase Date Sale Date Purchase Price Rehab Sale Price Net Profit Gross Margin 823 W Elm St 11/21/2011 9/20/2012 $134,775 $43,814 $226,000 $24,468 14% 304 Vannoy Park Lane, S.E. 10/27/2011 9/27/2012 $63,264 $17,343 $149,900 $51,328 64% 251 Vannoy Park Lane, S.E. 10/27/2011 9/27/2012 $63,264 $17,343 $149,900 $56,026 70% 256 Vannoy Park Lane, S.E. 10/27/2011 9/28/2012 $63,264 $17,343 $139,900 $45,404 56% 308 Vannoy Park Lane, S.E. 10/27/2011 9/28/2012 $63,264 $17,343 $149,900 $51,134 63% 138 W 112th St 9/20/2011 10/1/2012 $202,235 $74,823 $335,000 $28,779 10% 610 S Harris Ave 2/21/2012 10/18/2012 $223,813 $71,405 $365,000 $41,820 14% 300 Vannoy Park Lane, S.E. 10/27/2011 10/18/2012 $63,264 $17,343 $150,000 $52,705 65% 239 Vannoy Park Lane, S.E. 10/27/2011 10/24/2012 $63,264 $17,343 $149,900 $50,764 63% 324 Vannoy Park Lane, S.E. 10/27/2011 10/30/2012 $63,264 $17,343 $149,900 $50,239 62% 14906 S Wadsworth Ave 12/7/2011 10/30/2012 $129,042 $58,233 $239,900 $30,703 16% 312 Vannoy Park Lane, S.E. 10/27/2011 11/7/2012 $63,264 $17,343 $149,900 $49,789 62% 255 Vannoy Park Lane, S.E. 10/27/2011 11/16/2012 $63,264 $17,343 $150,000 $50,469 63% 837 W 81st St 10/13/2011 12/6/2012 $221,148 $78,849 $385,000 $55,072 18% 1500 W 102nd St 3/21/2012 12/6/2012 $206,873 $88,861 $385,000 $63,768 22% 243 Vannoy Park Lane, S.E. 10/27/2011 12/7/2012 $63,264 $17,343 $149,900 $50,254 62% 8616 Holmes Ave 1/31/2012 12/21/2012 $126,870 $60,028 $250,000 $39,145 21% 150 E 61st St 3/7/2012 12/21/2012 $167,254 $90,135 $339,000 $48,561 19% 1445 E 49th St 11/17/2011 12/28/2012 $132,628 $51,619 $235,000 $29,687 16% 200 E Artesia Blvd 5/1/2012 1/16/2013 $222,603 $83,152 $375,000 $42,959 14% 2006 W 54th St 10/27/2011 1/24/2013 $222,121 $73,317 $365,000 $32,966 11% 2520 S Longwood 6/18/2012 2/5/2013 $210,691 $84,927 $375,000 $43,414 15% 346 E 76th St 4/25/2012 2/14/2013 $197,488 $79,480 $350,000 $37,656 14% 4314 S Kansas Ave 5/25/2012 2/25/2013 $182,274 $107,421 $380,000 $61,797 21% 341 E 69th St 2/24/2012 3/15/2013 $187,600 $88,274 $339,000 $35,782 13% 755 E 79th St 7/27/2012 3/15/2013 $217,615 $70,170 $350,000 $29,147 10% 158 E 47th St 3/26/2012 3/26/2013 $214,894 $85,884 $365,000 $35,767 12% 905 W 74th St 3/14/2012 3/14/2013 $198,134 $93,037 $368,000 $42,636 15% 11542 S Van Ness Ave 9/28/2012 4/12/2013 $192,713 $73,690 $322,500 $32,837 12% 1427 W 95th St 6/18/2012 4/26/2013 $209,276 $75,858 $365,000 $43,459 15% 4462 S San Pedro St 4/13/2012 5/15/2013 $131,594 $63,752 $250,000 $28,469 15% 4119 McKinley Ave 9/21/2012 6/6/2013 $212,882 $76,073 $356,000 $36,229 13% 910 Larch St 10/24/2012 7/12/2013 $197,690 $92,744 $380,000 $66,610 23% 3048 West Blvd 12/28/2011 7/23/2013 $196,155 $156,971 $465,000 $74,253 21% 6430 Victoria Ave 8/30/2012 7/23/2013 $101,975 $81,247 $265,000 $41,798 23% 140 W 50th St 7/13/2012 7/29/2013 $219,242 $95,157 $399,990 $55,290 18% 629 E 37th St 11/30/2012 7/31/2013 $221,481 $73,943 $387,000 $56,930 19% 854 E 55th St 7/9/2012 10/16/2013 $211,698 $36,442 $265,000 $10,302 4% 1110 W 54th St 8/3/2012 11/4/2013 $172,026 $102,905 $365,000 $55,398 20% 852 W 50th Pl 1/16/2013 11/6/2013 $249,019 $94,770 $430,000 $52,622 15%
  • 3. Property Address Purchase Date Sale Date Purchase Price Rehab Sale Price Net Profit Gross Margin 3441 Hyde Park Blvd 8/30/2012 11/8/2013 $101,975 $80,103 $263,000 $55,094 30% 9401 Pace Ave 1/12/2012 11/27/2013 $186,222 $173,266 $375,000 -$14,805 -4% 4313 Crocker St 12/13/2012 12/3/2013 $207,320 $95,808 $380,000 $43,310 14% 429 E 47th St 8/13/2013 12/5/2013 $244,588 $75,532 $365,000 $16,639 5% 1648 W 83rd St 6/7/2013 12/10/2013 $249,625 $100,169 $421,000 $34,996 10% 121 W 105th St 4/23/2013 12/19/2013 $222,984 $95,856 $370,000 $24,595 8% 1372 E 22nd St 8/8/2013 1/6/2014 $226,942 $107,851 $400,000 $43,391 13% 1702 W 57th St 2/12/2013 2/13/2014 $223,706 $101,158 $379,900 $28,453 9% 322 N Grand Ave 10/15/2012 3/10/2014 $312,466 $189,953 $651,000 $88,232 18% 1488 W 50th St 8/10/2012 3/10/2014 $226,365 $92,629 $410,000 $52,573 16% 702 E 54th St 12/4/2013 4/28/2014 $227,430 $86,578 $379,900 $38,319 12% 1048 E 49th St 10/9/2012 6/16/2014 $129,610 $106,622 $295,000 $37,470 16% 214 E Raymond St 1/16/2013 Pending $193,926 Pending Pending Pending Pending 1227 E 20th St 1/28/2013 Pending $98,899 Pending Pending Pending Pending 973 W 46th St 2/15/2013 Pending $229,503 Pending Pending Pending Pending 607 W 74th St 3/15/2013 Pending $228,594 Pending Pending Pending Pending 663 W 66th St 4/10/2013 Pending $218,270 Pending Pending Pending Pending 1262 E 33rd St 4/25/2013 Pending $176,318 Pending Pending Pending Pending 526 W 54th St 4/30/2013 Pending $216,877 Pending Pending Pending Pending 1016 E 83rd St 5/10/2013 Pending $216,424 Pending Pending Pending Pending 1100 W 110th St 5/14/2013 Pending $223,344 Pending Pending Pending Pending 802 N Harvard Blvd 5/17/2013 Pending $492,473 Pending Pending Pending Pending 1407 E 23rd St 6/7/2013 Pending $222,953 Pending Pending Pending Pending 937 W 50th Pl 7/10/2013 Pending $250,456 Pending Pending Pending Pending 451 E 49th St 7/31/2013 Pending $203,929 Pending Pending Pending Pending 319 W 71st St 11/22/2013 Pending $233,548 Pending Pending Pending Pending 726 W 75th St 1/3/2014 Pending $241,644 Pending Pending Pending Pending 1834 S Dunsmuir Ave 3/10/2014 Pending $525,000 Pending Pending Pending Pending TOTAL/AVERAGE 100+ HOMES SOLD $3.6 MILLION PROFITS 30% AVERAGE RETURNS