1. A2
Lessons Learned on Performance-based Planning
CHATTANOOGA 2040 RTP PERFORMANCE-FRAMEWORK: BALANCING REGIONAL AND
COMMUNITY NEEDS
Melissa Taylor
Chattanooga-Hamilton County/North Georgia
TPO
1250 Market Street, Suite 2000
Chattanooga, TN 37402, USA
423.643.5944
taylor_melissa@chattanooga.gov
Tracy Selin
Cambridge Systematics, Inc.
730 Peachtree Street, Suite 1050
Atlanta, GA 30308, USA
404-460-2603
tselin@camsys.com
As part of 2040 RTP development, the Chattanooga TPO worked with stakeholders to create a
comprehensive performance-based planning framework to guide plan development. Transportation
investment needs defined during outreach efforts were frequently voiced by groups approaching the RTP
from two different perspectives - one which advocated a more local, community-oriented investment
approach and another that championed “big-ticket” investments needed to advance the economic
competitiveness of the region. These two perspectives are often seen as being in opposition to one
another, but both are critical to success of the plan. Rather than place them at odds, or prioritize the
needs of one over another, the Chattanooga 2040 RTP is founded on a long-range vision that balances
consideration of investment needs across both community and regional impacts.
In keeping with the vision to balance consideration of community and regional needs, goals and
objectives for the 2040 RTP were organized within a “Community to Region” performance framework
which presents goals/objectives across three geographic scales:
Within Community – Goals and objectives that emphasize safe, multimodal connections and
access to community resources and advance livability and quality of life principles;
Community to Region – Goals and objectives that support strategic multimodal connections
between individual communities and regional activity and economic centers; and
Region to Region – Goals and objectives that emphasize mobility and intermodal improvements
to ensure the region is well connected within the state and nation to advance economic growth.
A set of three, succinct goals were defined to reflect the long-term direction for investment across each
geographic scale. Objectives were defined accordingly to address the unique needs and considerations
within each scale.
A critical aspect of this approach – varying goals and objectives by geographic scale – is that it enabled
project evaluation to vary across each scale as well. To operationalize this, a set of performance
measures were defined and weighted by the level of significance of each measure for each scale. As an
example, Delay Reduction is not as significant a factor in determining project benefits Within Community,
as transportation needs within this scale often focus on slower, safer, multimodal trips. This factor is of
great significance (and therefore of greater weight) within the Regional scale, as the efficient movement
of people and goods is vital to the regional economy. The different weighting system allowed projects to
be scored and ranked according to unique needs of each scale. All performance measures were mode-
neutral and aligned with both regional goals and national transportation goals established in MAP-21.
This proved to be a highly flexible approach which infused context in the project evaluation process and
supported more targeted investment decisions yielding a truly balanced investment package:
A doubling of funding for bike/ped improvements;
Transit capacity investment at 25% of plan;
A reduction in roadway capacity investment from 51% to 31% of plan; and
Systems preservation funding at 39% of plan.
The presentation will focus on development of the performance framework and project calculator, and the
transferrable policy and technical methods for other small/medium-sized MPOs.
2. Selin
Taylor
2
CHATTANOOGA 2040 RTP PERFORMANCE-FRAMEWORK: BALANCING REGIONAL AND
COMMUNITY NEEDS
Introduction
Under the 2005 Safe, Accountable, Flexible, Efficient Transportation Equity Act: A Legacy for Users
(SAFETEA-LU), there were no requirements for performance measurement related to statewide or
metropolitan transportation plan development. However, many metropolitan planning organizations
(MPO) and state transportation agencies had already recognized the importance of performance
evaluation and were utilizing performance measures to evaluate and score projects and document
performance impacts of transportation investment. The Chattanooga-Hamilton County/North Georgia
Transportation Planning Organization (CHCNGA TPO) adopted its first performance-based plan in 2008
during the development of the 2035 Long-Range Transportation Plan (LRTP) which became effective in
2010.
The initial performance framework focused on system wide performance in the context of long-range
goals, but did not enable individual project ranking or a comparison of projects by mode. Due to the lack
of comprehensive project-level evaluation metrics, smaller-scale projects intended to improve system
operations, improve quality of life, support environmental sustainability, or create alternative
transportation choices were unable to compete with more well-defined capital investments – primarily
capacity-adding highway projects. In order to advance these projects in the 2035 LRTP, smaller pots of
funding were set aside for system operations, safety and security, and bicycle and pedestrian
improvements.
In 2011, a new transportation bill known as Moving Ahead for Progress in the 21st
Century (MAP-21), was
introduced to Congress and included proposed requirements for the development of performance targets
and measures to be included in metropolitan and statewide plans, to advance a set of national
transportation goals. Aware of this bill and the certainty that at some point in the next two years
Congress would pass the bill or a version of it, the CHCNGA TPO initiated efforts to expand and refine
the 2035 LRTP performance framework, to specifically include project-level measures, for the 2040
Regional Transportation Plan (RTP) process which began in 2012.
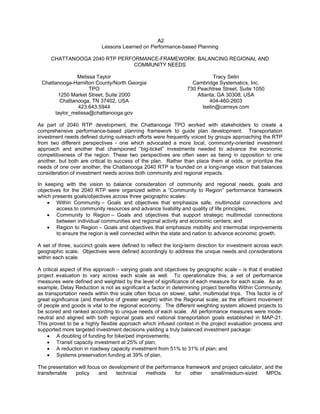
Early in the 2040 RTP stakeholder engagement
process, results from various community leadership
meetings and public outreach activities indicated an
almost even split between desired transportation
improvements (Figure 1). Transportation
challenges and investment needs defined during
outreach efforts were frequently identified by
stakeholders approaching plan development from
two distinct perspectives - advocates for a more
local, community-oriented investment approach and
others that championed “big-ticket” investments to
advance the region’s economic competitiveness
due in part to the region’s expectation for moderate
growth over the next 20-40 years. These two
perspectives are often seen as being in opposition
to one another, but both are critical to success of
the Plan. Rather than place them at odds with one
another, or prioritize the needs of one over another,
the 2040 RTP was founded on a long-range vision
that balances consideration of investment
needs across both community and regional
impacts. The revised performance framework for the 2040 RTP stems from this long-range vision.
Figure 1 2040 Questionnaire: Prioritized
Transportation Improvement Categories
3. Selin
Taylor
3
Objectives and Methodology
Transportation performance management, as defined by the MAP-21 legislation, “will transform the
Federal-aid highway program and provide a means to the most efficient investment of Federal
transportation funds by refocusing on national transportation goals, increasing the accountability and
transparency of the Federal-aid highway program, and improving project decision-making through
performance-based planning and programming”. The legislation directs MPOs to establish performance
measures and reestablishes previous mandates to consider public input. To meet these legislated
responsibilities, as well as the regional vision to balance consideration of both community and regional
investment needs, the TPO’s 2040 RTP performance-based planning process needed to:
1. Reflect MAP-21 national goals as well as regional transportation goals;
2. Thoughtfully incorporate public opinion; and
3. Enable a project evaluation process where performance impacts were compared fairly across a
variety of investment scales, ranging from community-oriented investments to more regionally
focused investments.
After reviewing multiple project submittals for the 2040 RTP Call for Projects – an initial step of the plan
development process - notable differences were identified across two key areas: (1) the degree of
expected community or regional impact associated with the investment, and (2) the geographic service
area of the proposed improvement type, in particular by project mode. The performance framework was
designed to distinguish such differences within the project evaluation and plan development process. To
do this, the performance framework was implemented as a parallel concept to the standard urban to rural
transect often used as a tool by planners to illustrate the transitioning land use context across urban and
rural geographies. In this case, however, the transition was not from urban to rural; rather from community
impact to regional impact. A transect is an easy, effective means of conveying a progressive or
graduated perspective across various geographic “scales” and was applied here as the primary
organizing principle for the performance-based planning process. In keeping with this approach, goals
and objectives for the 2040 RTP were organized within a “Community to Region” performance framework
as illustrated in Figure 2.
Figure 2 Chattanooga 2040 RTP Community to Region Performance Framework
4. Selin
Taylor
4
A set of three, succinct goals were defined to reflect the desired, long-term direction for investment across
each geographic scale. Objectives were defined accordingly, to address the unique needs and
considerations within each scale1
.
.
Within Community – (Goal) Build and Maintain Healthy Communities
Emphasize safe, multimodal connections and access to community resources and advance
livability and quality of life principles;
Community to Region – (Goal) Connect Communities in the Region by Providing Travel Options
to Activity and Economic Centers
Support strategic multimodal connections between individual communities and regional activity
and economic centers; and
Region to Region – (Goal) Grow Economic Opportunity through Strategic Investment in Critical
Regional Infrastructure
Emphasize mobility and intermodal improvements to ensure the region is well connected within
the state and the nation to advance economic growth.
A critical aspect of this approach – varying goals and objectives by geographic scale – is that it enabled
project evaluation to vary across each scale as well. This breaks the traditional, linear performance-
based planning approach where performance measures are often aligned one-to-one with a broad set of
regional goals and objectives. With this approach, all projects must be “all things to all people”. There is
usually a blending of many competing needs and perspectives through one regional set of performance
measures. This makes it difficult for planners and engineers to effectively test and compare projects to
one another (especially projects of different type and mode), because much of the project context has
been stripped out of the evaluation. This often results in different project types being evaluated in
isolation of one-another, producing unproductive “modal wars”. It also does not often lend itself to a fair
representation of project impacts at the community or local scale.
To operationalize the performance framework, a set of performance measures were defined with weights
that varied by the level of significance of each measure for each scale. As an example, Delay Reduction
is not as significant a factor in determining project benefits Within Community, as transportation needs
within this scale often focus on slower, safer, multimodal trips. This factor is of great significance (and
therefore of greater weight) within the Regional scale, as the efficient movement of people and goods is
vital to the regional economy. The different weighting system allowed projects to be scored and ranked
according to unique needs of each scale, providing more context for project-level performance
assessment. All performance measures were mode-neutral to support objective evaluation of projects,
regardless of type. Performance measures aligned with both regional goals and national transportation
goals established in MAP-21 (Table 1).
1 http://www.chcrpa.org/2040RTP.htm
5. Selin
Taylor
5
Table 1 Performance Measures for Chattanooga 2040 RTP
Performance
Measure Categorya 2040 RTP Objectivesb Systems-Level Measure Project-Level Measure
Scale
1 Weight
Within
Community
Scale
2 Weight
Community to
Region
Scale
3 Weight
Region to
Region
System Maintenance Preserve, maintain and improve
existing infrastructure
Pavement: Percent Lane
Miles in Good/Fair
Condition
Project Addresses Pavement
Deficiency
15 15 15
Bridge: Average Health
Index
Project Addresses Bridge Deficiency
Congestion Reduction Reduce delay on critical regional
thoroughfares
Average Commute Trip
Time, Auto and Transit
Project Reduces Delay
Interstate/Expressway
Corridor Connection to Key
Center
10 15 20
Safety and Security Improve operations, maintenance,
and ADA compliance
Number of Projects (and
Total Funding) Addressing
RTP Safety Areas
Project Includes Countermeasure(s)
to address RTP Safety Emphasis
Areas
15 15 15
Project Addresses Security or
Emergency Response Need
Economic Growth/
Freight Movement
Improve intermodal connections
Reduce delay on critical freight
corridors
Annual Congestion Costs,
Truck and Auto
Project Reduces Delay
Intermodal Connection
Freight Corridor
5 10 20
Environmental
Sustainability
Incentive complete streets projects
Support desired community
character
Support healthy, safe communities
Promote safe connections to
community resources
VMT per Capita Project Reduces VMT 30 20 10
Project Promotes Nonmotorized
Access to Community Resources
Project is in Keeping with
Community Character
System Reliability Expand set of travel options
Encourage connected, multimodal
network
Improve system operations
Incentivize corridor protection plans
Mode Split Project Located on Facility with
Corridor Protection Plan
15 15 10
Project Fills Gap in Existing System
Project Improves Efficiency through
ITS
Project Delivery Project Supported by TDOT and
Local Jurisdiction
10 10 10
a Performance Measure Categories align directly with MAP-21 national transportation goal areas.
b Objectives are abbreviated from adopted 2040 RTP goals/objectives. They are aligned with a performance measurement category that most closely represents intent of objective; however many objectives (and
corresponding performance measures) support more than one performance category.
6. Selin
Taylor
6
Figure 3 Pairwise Survey Worksheet
Initially, weight ranges were
established through professional
expertise and example project
testing. The staff team then
conducted a vetting process with
the TPO’s Technical Coordinating
Committee, the recommending
body to the TPO Executive Board,
and the Plan’s Technical and
Community Advisory Committees
using a pairwise survey (Figure 3)
for each scale. The results aided
staff in making the final decision on
specific weights for each measure
in each scale and provided useful
insight into individuals’ opinions on
the level of importance of each
measure in relationship to every
other measure and whether those
opinions varied by scale.
The pairwise exercise also allowed stakeholders and TPO members to fully understand how the
measures would function in relation to the new scaled approach when implemented during the project
evaluation and selection process. The results of the exercise were tallied and presented back to the
group for discussion. This inclusionary participation and review enabled buy-in for the overall framework.
However, the project ranking, itself, was expected to be the biggest hurdle.
Over 150 projects were considered in the project evaluation and selection process, across all project
modes and types. Most were submitted through the membership Call for Projects; others were identified
through the needs assessment and proposed by the staff team. All projects were first assigned to a
scale, given the project’s need and purpose, its location and proximity to community or environmental
assets, and its functional classification. The scale of the project was needed to apply the appropriate
performance measure weights, enabling the significance of various evaluation criteria to vary given the
geographic scale of each project, and its role in the transportation system.
Within each scale, projects were then evaluated relative to one another (regardless of project type) for
each of the 12 performance measures noted in Table 1. Weights were applied for each measure given
the scale of project and points were summed across all measures to produce individual project scores up
to 100 points. Projects were then combined into one scored list, across the three scales, based on
project score. Note that the travel demand model was used to measure travel and delay-oriented impacts
of traditional roadway capacity investments. An excel-based calculator was developed to capture the
same travel and delay performance impacts for the following “off-model” project types: system
operations, grade separation, bicycle/pedestrian, transit expansion, intersection improvements, various
emission control programs, and travel demand management/commute strategies. Other measures
related to safety, preservation, etc were evaluated using project sponsor input and/or individual
windshield review of project. This process enabled all projects, regardless of mode or type, to be
evaluated using the same set of performance metrics.
In order to present a manageable set of scored projects to the TPO TCC and Board and avoid
unproductive discussion on specific scores of one project versus another, the staff team broke the scored
project list into four priority ranks - first, second, third, and fourth rank priorities. These rankings were
reviewed by the TPO and at the request of the membership shifts between scales were made for a very
small number of projects for a project reevaluation (two projects). Following endorsement of the list by
the TPO Board, the staff team began aligning priority projects with funding sources. Enough revenues
existed to cover all projects in the first and second priority ranks. Detailed discussions ensued with the
TPO membership regarding which of the projects in the third set would make the financial cut. A final list
7. Selin
Taylor
7
was constrained. It should be noted that the final constrained list also included system preservation,
system operations, and safety funding set asides in addition to line-item projects.
Conclusions
The Community to Region Framework proved to be a
highly flexible approach which infused context into the
project evaluation process and supported more targeted
investment decisions yielding a truly balanced investment
package. The assumption that the best performers from
each scale would float to the top, was confirmed. As an
example, a high performing bicycle investment that scored
90 out of 100 points for Scale 1 was able to effectively
compete with a high performing roadway capacity project
that also scored 90 out of 100 for Scale 3. In addition, the
TPO membership was fully engaged and integral to the
implementation of the overall process. The performance-
based planning process yielded a number of positive
planning outcomes. These include:
Blend of high ranking projects (by project type
and across geographic scales) for the fiscally
constrained 2040 RTP;
Objective support for a variety of investments,
given the mode-neutral performance evaluation;
Focus on performance and priorities because the
priorities were established before funding source
entered stakeholder discussion.
The major investment outcomes are shown in Figure 4.
They include:
A doubling of funding for bike/ped improvements;
Transit investment at 25% of plan, up from 18% from 2035 LRTP;
A reduction in roadway capacity investment from 51% to 30% of plan; and
Systems preservation funding at 39% of plan.
Takeaways and Lessons Learned
This approach is transferrable from both a policy and technical perspective, and not beyond basic staffing
capabilities and resources of other small/medium-sized MPOs. Important aspects of the approach
include:
Appropriate weighting is critical; i.e., “watering down” this approach will not work.
Must have a manageable number of projects; it takes time to understand project context.
Need tools in place to evaluate off-model projects; spreadsheet or GIS methods suffice.
Need to keep measures simple and mode-neutral to ensure objective, cross-”scale” analysis.
A combination of qualitative and quantitative measures is OK; does not preclude an objective
ranking.
It is important to carry forward into TIP process.
Figure 4 2040 RTP Investment Package
8. Selin
Taylor
8
Implementation
Although difficult to estimate a true cost of this approach due to the thorough integration of the
performance framework with other components of the 2040 Regional Transportation Plan, consultant and
staff costs, time, and resources are as representative as possible. Implementation of the overall
performance based planning approach required approximately $75,000 (consultant dollars). This
included funding to develop and vet the performance framework approach with staff and stakeholders
(approximately $20K), to build the off-model benefits calculator (approximately $25K), to build an excel-
based project scoring workbook (approximately $10K), and conduct project and plan evaluation
(approximately $20K). This amount reflected about 7% of total consulting funds allocated for 2040 RTP
development and associated air quality/transportation conformity analysis and documentation. Federal PL
funds were used, matched by 20% of joint local funding through the Chattanooga-Hamilton County
Regional Planning Agency (RPA) which provides staff to the TPO. Additional TPO staff time and
resources included review and consideration of the importance of each performance measure and the
relationship of each measure to the three different scales (approximately $2K). The RPA staff also
considered support from existing neighborhood and community land use plans as well as other
supporting documents such as the Climate Action Plan, Hazards Mitigation Plan, and specific sub-area or
feasibility transportation studies for the project-level criteria (approximately $1K).
Approximately 150 projects were evaluated using this approach requiring 60 man-hours for two
consultant staff; i.e., a total of 120 hours across one week’s time. RPA staff was needed to complete the
review of the supporting plans requiring 10 additional man-hours. Given the close, individual project
review it took approximately 30-45 minutes to evaluate each project and input results into the project
scoring workbook. Note that this time does not include the time to run the travel demand or off-model
calculator to derive VMT and delay benefits for each project.
While two critical performance measures (VMT reduced, delay reduced) relied on either the regional
travel demand model or off-model calculator to be quantified, most performance measures were
qualitatively scored given close review of project scope and input from project sponsor. Table 2, below,
provides more detail related to the tools and resources applied for calculation of each project level
performance measure.
9. Selin
Taylor
9
Table 2 Project Evaluation Methods for Chattanooga 2040 RTP
Performance
Measure Category
Project Level Performance
Measures Evaluation Tool / Approach
System Maintenance Project Addresses Pavement
Deficiency
Points awarded (Yes/No) based on review of project scope and input from project sponsor
Project Addresses Bridge Deficiency Points awarded (Yes/No) based on review of project scope and input from project sponsor; Additional cross-check of
bridge(s) against National Bridge Inventory database to identify structural deficiency status
Congestion Reduction Project Reduces Delay
Interstate/Expressway
Corridor Connection to Key
Center
Travel demand model for roadway capacity projects.
Off-model calculator for all other project types.
Safety and Security Project Includes Countermeasure(s)
to address RTP Safety Emphasis
Areas
Points awarded (Yes/No) based on review of project scope to identify if countermeasures that address RTP safety
emphasis areas (Roadway Departure, Aggressive Driving, Intersection Improvement) are included.
Project Addresses Security or
Emergency Response Need
Security points calculated (Yes/No) based on project scope, with cross-check to identify if project provides network
redundancy or enhances mobility in relation to security-critical assets (e.g., airports, intermodal facilities, etc)
Economic Growth/
Freight Movement
Project Reduces Delay
Intermodal Connection
Freight Corridor
Travel demand model for roadway capacity projects.
Off-model calculator for all other project types.
Environmental
Sustainability
Project Reduces VMT Travel demand model for roadway capacity projects.
Off-model calculator for all other project types.
Project Promotes Nonmotorized
Access to Community Resources
Points will be calculated (Yes/No) based on review of project scope, along with cross-check to identify if project directly
connects or serves: active transportation facility, healthy food location, health care facility, public/private school (K-12).
Project is in Keeping with
Community Character
Points will be calculated (Yes/No) based on review of applicable land use plan in place.
System Reliability Project Located on Facility with
Corridor Protection Plan
Points will be awarded (Yes/No) if corridor, access or other demand management plan in place for project facility.
Project Fills Gap in Existing System Points will be awarded (Yes/No) if project fills gap or provides connection within existing or planned bike, ped, or transit
system as identified through GIS-based Bicycle Gap Analysis, Pedestrian Gap Analysis, and Transit Gap Analysis.
Project Improves Efficiency through
ITS
Points will be awarded (Yes/No) based on review of project scope.
Project Delivery Project Supported by TDOT and
Local Jurisdiction
Points will be awarded (Yes/No) based on project understanding and availability of local match
Melissa D.
Taylor
Digitally signed by Melissa D. Taylor
DN: cn=Melissa D. Taylor, o=Regional Planning
Agency & TPO, ou=Strategic Long Range
Planning,
email=taylor_melissa@chattanooga.gov, c=US
Date: 2015.07.14 13:38:20 -04'00'