More Related Content Similar to Competitiveness Series - National Technology Trade Similar to Competitiveness Series - National Technology Trade (20) 1. $300
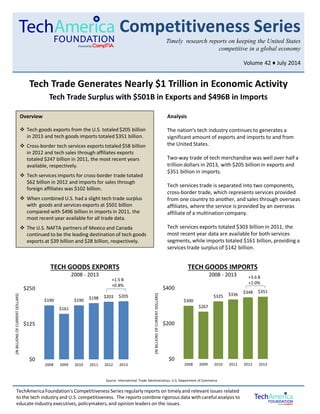
$267
$325 $336 $348 $351
$0
$200
$400
2008 2009 2010 2011 2012 2013
Competitiveness Series
Timely research reports on keeping the United States
competitive in a global economy
Volume 42 ♦ July 2014
Tech Trade Generates Nearly $1 Trillion in Economic Activity
Tech Trade Surplus with $501B in Exports and $496B in Imports
Overview
Tech goods exports from the U.S. totaled $205 billion
in 2013 and tech goods imports totaled $351 billion.
Cross-border tech services exports totaled $58 billion
in 2012 and tech sales through affiliates exports
totaled $247 billion in 2011, the most recent years
available, respectively.
Tech services imports for cross-border trade totaled
$62 billion in 2012 and imports for sales through
foreign affiliates was $102 billion.
When combined U.S. had a slight tech trade surplus
with goods and services exports at $501 billion
compared with $496 billion in imports in 2011, the
most recent year available for all trade data.
The U.S. NAFTA partners of Mexico and Canada
continued to be the leading destination of tech goods
exports at $39 billion and $28 billion, respectively.
Analysis
The nation’s tech industry continues to generates a
significant amount of exports and imports to and from
the United States.
Two-way trade of tech merchandise was well over half a
trillion dollars in 2013, with $205 billion in exports and
$351 billion in imports.
Tech services trade is separated into two components,
cross-border trade, which represents services provided
from one country to another, and sales through overseas
affiliates, where the service is provided by an overseas
affiliate of a multination company.
Tech services exports totaled $303 billion in 2011, the
most recent year data are available for both services
segments, while imports totaled $161 billion, providing a
services trade surplus of $142 billion.
TechAmerica Foundation’s Competitiveness Series regularlyreports on timely and relevant issues related
to the tech industry and U.S. competitiveness. The reports combine rigorous data with careful analysis to
educate industry executives, policymakers, and opinion leaders on the issues.
TECH GOODS EXPORTS
2008 - 2013
Source: International Trade Administration, U.S. Department of Commerce
+1.5 B
+0.8%
(INBILLIONSOFCURRENTDOLLARS)
$190
$161
$190 $198 $203 $205
$0
$125
$250
2008 2009 2010 2011 2012 2013
TECH GOODS IMPORTS
2008 - 2013
(INBILLIONSOFCURRENTDOLLARS)
+3.6 B
+1.0%
2. $51
$59
$62
$0
$40
$80
2010 2011 2012
2 © TechAmerica Foundation
Tech Services Trade
Both segments of tech services trade experienced
growth in the most recent years available from the U.S.
Bureau of Economic Analysis. Cross-border tech
services trade totaled $58 billion in exports in 2012 and
$62 billion in imports.
The bulk of services trade is delivered through the
foreign affiliate of the parent company. U.S. exports of
tech sales through foreign affiliate was $247 billion in
2011. This represents a significant surplus over the
$102 billion in sales through foreign affiliate imports.
The categories used to define tech services in both
services segments are available on the last page of this
report. It will be interesting to see if the services trade
through affiliates follows the similar pattern as goods
trade with slowing growth rates in 2012 and 2013.
It is interesting to note that while the largest bulk of
tech imports comes from goods, the largest category of
exports comes from the delivery of services via the
foreign affiliates. Many of the goods imported into the
United States are part of a global supply chain, where
U.S. multinational companies create and design tech
products in the United States and produce the finalized
product overseas. In these cases, the bulk of the profit
from the products are accrued to the U.S. firm. Often
the importation of a technology good represents an
intra-company transfer as U.S. firms brings their
products into the United States for sale from their
overseas production facilities.
(INBILLIONSOFCURRENTDOLLARS)
$47
$55
$58
$0
$40
$80
2010 2011 2012
TECH SERVICES TRADE
CROSS-BORDER TRADE
2010 - 2012
EXPORTS IMPORTS
$97 $102
$0
$150
$300
2010 2011
(INBILLIONSOFCURRENTDOLLARS)
$215
$247
$0
$150
$300
2010 2011
EXPORTS IMPORTS
TECH SERVICES TRADE
SALES THROUGH FOREIGN AFFILIATE TRADE
2010 - 2011
(INBILLIONSOFCURRENTDOLLARS)
$198
$336
$55
$59$247
$102
$0
$300
$600
Exports Imports
Foreign
Affiliates
Cross-
Border
Goods
2011 TECH TRADE BALANCE
EXPORTS VS IMPORTS
Source: U.S. Bureau of Economic Analysis
$501 $496
+4.6 BILLION TRADE SURPLUS
Source: U.S. Bureau of Economic Analysis Source: U.S. Bureau of Economic Analysis
When combined U.S. goods and services exports
totaled $501 billion and imports were $496 billion in
2011, the most recent year that complete data are
available, giving the U.S. a slight tech trade surplus of
$4.6 billion.
Tech Goods Trade
Trade in technology goods declined significant during
the recent recession with the bottom for both exports
and imports hitting in 2009. While both exports and
imports have rebounded since that period, the past
two years have seen a slowdown in the growth rate as
key overseas markets have experienced economic
malaise and the economic recovery in the United States
has been slow. Tech goods exports totaled $205 billion
for the full year of 2013 and imports reached $351
billion in that same year.
3. 3 © TechAmerica Foundation
Leading Destinations of Technology Goods
What may surprise many is that our NAFTA partners of
Mexico and Canada are the leading two destinations for
U.S. technology goods overseas, far exceeding any
single market in Asia and Europe. Mexico received
nearly $39 billion in U.S. tech goods exports and
Canada over $28 billion. Third ranked China had $16
billion in tech goods.
The United States has trade agreements with 20
countries, and is looking to create two new large scale
agreements, one in the Pacific and one in the Atlantic.
These new agreements could expand U.S. free trade
markets to 53 countries, creating significantly new
opportunities for U.S. technology companies.
Tech Goods Exports by States
Tech trade is not something that helps the United
States in the abstract, but provides significant economic
activity in the states throughout the country. The table
on the right shows that there are 31 states with over $1
billion in tech exports.
Texas overtook California in 2012 to become the
leading state by technology goods exports and 2013
shows it expanding its lead, as exports from Texas grew
by 6.7 percent compared to a drop in California by 5.1
percent in 2013. The good news for Illinois is that its
5.8 percent growth of goods exports, increased its rank
to 6th surpassing New York.
As the U.S. tech industry continues to look to overseas
markets for growth, new trade agreements could
directly increase the exports of tech goods for many
states around the country.
$38.6
$28.0
$16.0
$9.8 $8.6
$0
$25
$50
1.
Mexico
2.
Canada
3.
China
4.
Hong Kong
5.
Japan
TOP DESTINATIONS OF TECH GOODS FROM U.S.
2013
Tech Goods Exports by State
2012 – 2013
(in millions of current dollars)
Percent
Rank States 2012 2013 Change
United States $203,155 $204,683 1.0%
1. Texas $45,131 $48,175 6.7%
2. California $44,625 $42,367 -5.1%
3. Florida $14,470 $14,746 1.9%
4. Massachusetts $7,310 $7,268 -0.6%
5. Oregon $6,415 $6,725 4.8%
6. Illinois $6,258 $6,624 5.8%
7. New York $6,627 $6,494 -2.0%
8. Tennessee $4,704 $4,827 2.6%
9. Arizona $4,897 $4,696 -4.1%
10. Minnesota $3,978 $4,032 1.3%
11. Pennsylvania $3,791 $3,888 2.6%
12. New Jersey $3,858 $3,813 -1.2%
13. Washington $3,737 $3,661 -2.0%
14. Michigan $2,590 $3,129 20.8%
15. Ohio $3,222 $3,065 -4.9%
16. Wisconsin $3,043 $2,898 -4.8%
17. North Carolina $2,672 $2,867 7.3%
18. Vermont $2,772 $2,724 -1.7%
19. Idaho $2,859 $2,721 -4.8%
20. Virginia $2,365 $2,583 9.2%
21. Utah $2,038 $2,567 25.9%
22. Georgia $2,256 $2,220 -1.6%
23. Colorado $2,072 $2,095 1.1%
24. Indiana $1,803 $1,908 5.9%
25. Kentucky $1,660 $1,829 10.2%
26. Maryland $1,775 $1,746 -1.6%
27. Nevada $1,415 $1,390 -1.8%
28. Connecticut $1,409 $1,288 -8.6%
29. South Carolina $1,693 $1,213 -28.4%
30. New Hampshire $1,139 $1,193 4.7%
31. New Mexico $1,669 $1,138 -31.8%
32. Mississippi $1,012 $982 -2.9%
33. District of Columbia $368 $960 161.1%
34. Oklahoma $840 $765 -8.9%
35. Delaware $597 $744 24.5%
36. Kansas $633 $676 6.9%
37. Iowa $568 $554 -2.4%
38. Alabama $588 $517 -12.1%
39. Missouri $607 $517 -14.9%
40. Puerto Rico $431 $479 11.1%
41. Louisiana $290 $308 6.2%
42. Nebraska $200 $236 18.3%
43. Maine $590 $229 -61.1%
44. Arkansas $198 $186 -5.8%
45. Rhode Island $177 $182 2.7%
46. South Dakota $122 $141 15.7%
47. West Virginia $114 $116 2.0%
48. North Dakota $62 $50 -19.4%
49. Montana $37 $35 -6.1%
50. Hawaii $44 $26 -41.1%
51. Alaska $23 $25 11.8%
52. Wyoming $24 $18 -24.2%
Unallocated $1,943 $1,733 -10.8%
(INBILLIONSOFCURRENTDOLLARS)
4. 4 © TechAmerica Foundation
TechAmerica Foundation Reports
TechAmerica Foundation produces regular reports covering
timely and relevant issues to the technology industry and to
U.S. competitiveness in a global economy. We combine
rigorous data with careful analysis to provide industry
leaders and policymakers with the informationneeded to
understand the industry.
Previous reports include:
Adopting Cloud Services – May 2014
Tech Trade in the States – Feb 2014
Midyear Tech Employmentfor 2013 – Sept 2013
Cyberstates 2013 – May 2013
Copies of these reports are availableon our website at:
www.techamericafoundation.org/cs
For questions about this publication contact:
Matthew Kazmierczak
matthew@techamericafoundation.org
About TechAmerica Foundation
TechAmerica Foundation educates industry executives,
policy makers and opinion leaders on the promise of
technological innovation to advance prosperity, security, and
the general welfare.
Launched in 1981, the Foundation is a 501(c)(3) non-profit,
nonpartisan affiliateof TechAmerica, which is the public
sector and public advocacy department of CompTIA and the
leading voice and resource for the U.S. tech industry.
TechAmerica Foundation disseminates award-winning
research covering the latest topics of interest to the tech
industry. The Foundation also organizes conferences and
seminars to explore pertinent issues with government and
industry representatives and to share the findings
Copyright © 2014 TechAmerica Foundation
All rights reserved.
TECH EXPORTS FROM UNITED STATES TO WORLD
(in millions of current U.S. dollars)
% Change # Change
Tech Goods Export 2009 2010 2011 2012 2013 2012-13 2012-13
Computer and Peripheral Mfg. $37,975 $44,090 $48,585 $49,394 $48,268 -2.3% -$1,126
Communications Mfg. $23,908 $28,081 $33,331 $35,295 $37,625 6.6% $2,330
Consumer Electronics Mfg. $7,792 $9,753 $10,811 $10,502 $9,703 -7.6% -$798
Electronic Components & Semiconductor Mfg. $51,711 $64,204 $55,220 $52,261 $53,191 1.8% $930
Measuring and Control Instruments Mfg. $38,283 $43,529 $48,623 $51,117 $51,506 0.8% $389
Reproducing Magnetic and Optical Media Mfg. $959 $779 $1,465 $4,586 $4,390 -4.3% -$196
Total Tech Goods Exports $160,628 $190,435 $198,035 $203,155 $204,683 0.8% $1,528
Cross-Border Services Tech Exports 2009 2010 2011 2012 2011-12 2011-12
Telecommunications $10,102 $10,911 $12,851 $14,009 9.0% $1,158
Computer and Information Services $13,714 $14,127 $16,841 $17,340 3.0% 499
R&D and Testing Services $18,636 $22,446 $25,457 $26,663 4.7% 1,206
Total Cross-Border Exports $42,452 $47,484 $55,149 $58,012 5.2% 2,863
Tech Sales Through U.S. Affiliates to Foreign Persons 2009 2010 2011 2010-11 2010-11
Computers and Electronic Products $4,385 $4,499 $5,300 17.8% $801
Software Publishers $24,962 $35,468 $41,712 17.6% $6,244
Telecommunications $31,805 $31,038 $34,674 11.7% $3,636
Internet Services $36,248 $39,724 $50,214 26.4% $10,490
Architectural, Engineering, and Related Services $25,701 $26,324 $29,515 12.1% $3,191
Computer Systems Design and Related Services $70,482 $73,620 $81,162 10.2% $7,542
Scientific Research and Development Services $4,458 $4,306 $4,920 14.3% $614
Total Sales Through U.S. Affiliates $198,041 $214,979 $247,497 15.1% $32,518
Total U.S. Exports $401,121 $452,898 $500,681 10.6% $47,783
Definition and Methodology
The goods trade data come from the InternationalTrade
Administration’sOffice of Trade and Industry Information in the
U.S. Department of Commerce. Goods trade are those physical
products that can be put on a ship for trade and correspond to
NAICS code 334 and its subcomponents.
Tech services trade has two components,cross-border services and
sales through overseas affiliates. Cross-border represents,in the
general sense, a service that is provided from one country to
another, whereas sales through overseas affiliatesrepresents a
service that is provided by a local chapter of a multinational
company that is headquartered in a separate country.
Services trade data are collected and compiled by the U.S. Bureau
of Economic Analysis. Data for services imports was imputed for
Internet services for 2010 and 2011 in order to address a
nondisclosureissue. Services exports represent receipts for
services provided, while imports represent payments for services
provided.
All data are most current at time of publication.