Tutorial for Starting to Analyse Data with SPSS
•
0 likes•148 views

Tutorial for introducing SPSS that takes students through steps in starting an analysis on World Values Survey data.

Recommended
More Related Content
Similar to Tutorial for Starting to Analyse Data with SPSS
Similar to Tutorial for Starting to Analyse Data with SPSS (20)
Recently uploaded
Recently uploaded (20)
Tutorial for Starting to Analyse Data with SPSS
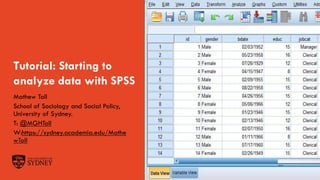
- 1. The University of Sydney Page 1 Tutorial: Starting to analyze data with SPSS Mathew Toll School of Sociology and Social Policy, University of Sydney. T: @MGHToll W:https://sydney.academia.edu/Mathe wToll
- 2. The University of Sydney Page 2 Tutorial Activities - Overview of SPSS - Manipulating data: selecting cases, splitting files by groups - Descriptive statistics (getting the minimum, max, medium, interquartile range, etc) - Cross-tabulation - Analysing World Values Survey data
- 3. The University of Sydney Page 3 Filtering Cases 1. Select ‘data’ in the top menu bar. 2. Toward the bottom of the drop-down click “select cases”. 3. In the select case box click “if condition is satisfied” and press “if”. 4. This will give you a box similar to the compute variable box, select the variable of interest from the list of variables (i.e. country code, sex, social class) and import it into the window. 5. Write “VX=Y” (VX being the name of your variable and Y being whatever value you are selecting) or, for multiple groups of cases “VX=Y or VX=Y” for as many groups as you want to select. 6. Click continue and SPSS will filter your case selections.
- 4. The University of Sydney Page 4 Splitting Files This is useful if you want to perform and compare univariate analysis for multiple groups in the same dataset. 1. Select ‘data’ in the top menu bar. 2. Choose “split file” in the dropdown menu. 3. In the split file box, select the variable you intend to split the file by and transfer it to the window (either by double clicking it or pressing the arrow). 4. If you wish to split the file either chose “compare groups” or “organize output by group”. 5. Click ok and SPSS will split the file.
- 5. The University of Sydney Page 5 Descriptive statistics 1. Select “Analyze” in the top menu bar. 2. Choose “descriptive statistics” from the dropdown menu. 3. Select “frequencies” 4. In the frequencies box select the variable(s) of interest and move them to the window. 5. Click “statistics” and select the descriptive statistics you would like (i.e. mean, medium, standard deviation, etc) and then press continue. 6. Click ok on the frequencies box and SPSS will compute your descriptive statistics and report them in the output window.
- 6. The University of Sydney Page 6 Cross-tabulation 1. Select “Analyze” in the top menu bar. 2. Choose “descriptive statistics” from the dropdown menu. 3. Select “crosstabs” 4. In the crosstab box select the variable of interest (i.e. post-materialist index) and move it to the row and categorical variable (i.e social class, sex, country code, etc) to the column . 5. Click ok and SPSS will generate your table and report it in the output window.
- 7. The University of Sydney Page 7 Today’s task 1. Select a country to analyse or two countries to compare. 2. Filter your cases/split file if needed. 3. Formulate a theory about differences between a country or between groups within a country. 4. Think of a way you might test your theory. 5. Test hypothesis using descriptive statistics (max, min, range, IQR, median) and cross-tabulation. 6. Report back what you found.