1. A Nonparametric Look at Self-Esteem Development by Gender and Socioeconomic Region
Student: Mark R. Ruprecht rupre014@umn.edu
Advisor: Nathaniel E. Helwig http://stat.umn.edu/~helwig
Department of Psychology and School of Statistics, University of Minnesota
Introduction
Self-esteem is a measure of one’s subjective self-worth.
Question: How does the self-esteem developmental trajectory
differ across gender and socioeconomic region?
Participant Characteristics
n = 45,185 participants from 171 countries ages 10–80 years old
All Regions
Age (years)
Density
10 20 30 40 50 60 70 80
0.000.040.08
n = 28071 females
n = 17114 males
Advanced Economies
Age (years)
Density
10 20 30 40 50 60 70 80
0.000.040.08
n = 23329 females
n = 13735 males
East Asia and the Pacific
Age (years)
Density
10 20 30 40 50 60 70 80
0.000.040.08
n = 1736 females
n = 801 males
Europe and Central Asia
Age (years)
Density
10 20 30 40 50 60 70 80
0.000.040.08
n = 882 females
n = 692 males
Latin America and the Caribbean
Age (years)
Density
10 20 30 40 50 60 70 80
0.000.040.08
n = 606 females
n = 472 males
Middle East and North Africa
Age (years)
Density
10 20 30 40 50 60 70 80
0.000.040.08
n = 416 females
n = 383 males
South Asia
Age (years)
Density
10 20 30 40 50 60 70 80
0.000.040.08
n = 808 females
n = 777 males
Sub−Saharan Africa
Age (years)
Density
10 20 30 40 50 60 70 80
0.000.040.08
n = 294 females
n = 254 males
Figure 1: Age/Gender distributions for each socioeconomic region.
Self-Esteem Measure
10 20 30 40 50 60 70 80
2025303540
All Regions
Age (years)
AverageSelf−Esteem
females
males
10 20 30 40 50 60 70 80
2025303540
Advanced Economies
Age (years)
AverageSelf−Esteem
females
males
10 20 30 40 50 60 70 80
2025303540
East Asia and the Pacific
Age (years)
AverageSelf−Esteem
females
males
10 20 30 40 50 60 70 80
2025303540
Europe and Central Asia
Age (years)
AverageSelf−Esteem
females
males
10 20 30 40 50 60 70 80
2025303540
Latin America and the Caribbean
Age (years)
AverageSelf−Esteem
females
males
10 20 30 40 50 60 70 80
2025303540
Middle East and North Africa
Age (years)
AverageSelf−Esteem
females
males
10 20 30 40 50 60 70 80
2025303540
South Asia
Age (years)
AverageSelf−Esteem
females
males
10 20 30 40 50 60 70 80
2025303540
Sub−Saharan Africa
Age (years)
AverageSelf−Esteem
females
males
Figure 2: Average score on Rosenberg Self-Esteem Scale (Rosenberg, 1965).
Socioeconomic Region Assignment
Advanced Economies
East Asia and the Pacific
Europe and Central Asia
Latin America and the Caribbean
Middle East and North Africa
South Asia
Sub−Saharan Africa
Figure 3: Socioeconomic region assignments based on Barro and Lee (2013).
Age-Gender Model
We use a two-way smoothing spline analysis of variance model:
yi = η(ai,gi)+ i
where
• yi is the self-esteem score for the i-th subject
• ai and gi are age and gender of i-th subject
• η is the unknown smooth function that we will estimate
• i
iid
∼ N(0,σ2) is unknown, normally distributed error term
Two possible models that we could consider:
Additive: η(a,g) = η0 +ηA(a)+ηG(g)
Interaction: η(a,g) = η0 +ηA(a)+ηG(g)+ηAG(a,g)
where
• η0 is a baseline (intercept) term
• ηA and ηG are main effects of age and gender (respectively)
• ηAG is age-gender interaction effect function
Age-Gender-Region Model
We use a three-way smoothing spline analysis of variance model:
yi = η(ai,gi,ri)+ i
where ri is socioeconomic region of i-th subject.
Nine possible models that we could consider (see Table 2).
All models were fit with bigsplines (Helwig, 2016) package in
R software environment (R Core Team, 2016).
Fit Statistics: Age-Gender Model
Table 1: Fit statistics for two-way (age-gender) SSANOVA model.
Model R2 Akaike IC Bayesian IC
1. Additive 0.070 300492.3 300703.5
2. Interaction 0.078 300155.9 300489.1
Note. IC = Information Criterion
Fit Statistics: Age-Gender-Region Model
Table 2: Fit statistics for three-way (age-gender-region) SSANOVA model.
Model R2 Akaike IC Bayesian IC
1. η• +ηAG +ηAR +ηGR +ηAGR 0.087 299778.9 300530.0
2. η• +ηAG +ηAR +ηGR 0.087 299761.8 300349.8
3. η• +ηAG +ηAR 0.086 299787.4 300352.9
4. η• +ηAG +ηGR 0.085 299787.2 300192.0
5. η• +ηAR +ηGR 0.079 300130.2 300561.7
6. η• +ηAG 0.085 299824.0 300360.8
7. η• +ηAR 0.078 300157.0 300564.6
8. η• +ηGR 0.078 300158.7 300526.1
9. η• 0.077 300184.3 300467.0
Note. IC = Information Criterion and η• = η0 +ηA +ηG +ηR
AIC selects Model 2, and BIC selects Model 4. We prefer Model 2.
Results: Age-Gender Model
10 30 50 70
2025303540
η^
0 + η^
A
Age (years)
AverageSelf−Esteem
10 30 50 70
2025303540
η^
0 + η^
A + η^
G + η^
AG
Age (years)
AverageSelf−Esteem
males
females
Figure 4: Predicted self-esteem developmental trajectory ignoring gender (left)
and including gender (right).
Results: Age-Gender-Region Model
10 20 30 40 50 60 70 80
2025303540
η^
0 + η^
A + η^
G + η^
AG
Age (years)
AverageSelf−Esteem
males
females
10 20 30 40 50 60 70 80
2025303540
η^: Advanced Economies
Age (years)
AverageSelf−Esteem
males
females
10 20 30 40 50 60 70 80
2025303540
η^: East Asia and the Pacific
Age (years)
AverageSelf−Esteem
males
females
10 20 30 40 50 60 70 80
2025303540
η^: Europe and Central Asia
Age (years)
AverageSelf−Esteem
males
females
10 20 30 40 50 60 70 80
2025303540
η^: Latin America and the Caribbean
Age (years)
AverageSelf−Esteem
males
females
10 20 30 40 50 60 70 80
2025303540
η^: Middle East and North Africa
Age (years)
AverageSelf−Esteem
males
females
10 20 30 40 50 60 70 80
2025303540
η^: South Asia
Age (years)
AverageSelf−Esteem
males
females
10 20 30 40 50 60 70 80
2025303540
η^: Sub−Saharan Africa
Age (years)
AverageSelf−Esteem
males
females
Figure 5: Model predicted self-esteem developmental trajectory by gender and
socioeconomic region.
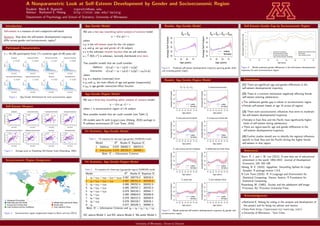
Self-Esteem Gender Gap by Socioeconomic Region
10 20 30 40 50 60 70 80
−5−4−3−2−1012
Age (years)
Self−EsteemDifference(F−M)
Advanced Economies
East Asia and the Pacific
Europe and Central Asia
Latin America and the Caribbean
Middle East and North Africa
South Asia
Sub−Saharan Africa
Figure 6: Model predicted gender differences in the self-esteem developmental
trajectory for each socioeconomic region.
Conclusions
(1) There are significant age and gender differences in the
self-esteem developmental trajectory.
(2) There is a common mechanism negatively effecting female
self-esteem entering adolescence.
• The adolescent gender gap is robust to socioeconomic region
• Female self-esteem lowest at age 14 across all regions
(3) There exist socioeconomic influences that serve to moderate
the self-esteem developmental trajectory.
• Females in East Asia and the Pacific have significantly higher
levels of self-esteem during adolescence
• There are region-specific age and gender differences in the
self-esteem developmental trajectory
(4) Further studies should aim to identify the regional influences
specific to East Asia and the Pacific driving the higher female
self-esteem in that region.
References
Barro, R. J. and J. W. Lee (2013). A new data set of educational
attainment in the world, 1950–2010. Journal of Development
Economics 104, 184–198.
Helwig, N. E. (2016). bigsplines: Smoothing Splines for Large
Samples. R package version 1.0-8.
R Core Team (2016). R: A Language and Environment for
Statistical Computing. Vienna, Austria: R Foundation for
Statistical Computing.
Rosenberg, M. (1965). Society and the adolescent self-image.
Princeton, NJ: Princeton University Press.
Acknowledgments
• Nathaniel E. Helwig for aiding in the analysis and development of
this project and for being my advisor and mentor.
• Data from http://personality-testing.info/
• University of Minnesota - Twin Cities.
University of Minnesota: Driven to Discover