More Related Content
Similar to FinalPoster_Printable (20)
FinalPoster_Printable
- 1. RESEARCH POSTER PRESENTATION DESIGN © 2015
www.PosterPresentations.com
10 20 30 40 50 60
−4−2024
F − M Difference (AIC Model)
Age (years)
Self−Esteem
Advanced Economies
East Asia and the Pacific
Europe and Central Asia
Latin America and the Caribbean
Middle East and North Africa
South Asia
Sub−Saharan Africa
10 20 30 40 50 60
−4−2024
F − M Difference (BIC Model)
Age (years)
Self−Esteem
Advanced Economies
East Asia and the Pacific
Europe and Central Asia
Latin America and the Caribbean
Middle East and North Africa
South Asia
Sub−Saharan Africa
Sample Size by Region:
Advanced Economies: 36,365 Europe and Central Asia: 1,565 Sub-Saharan Africa: 541
East Asia and the Pacific: 2,527 Middle East and North Africa: 769 South Asia:1,575
Latin America and the Caribbean: 1,069
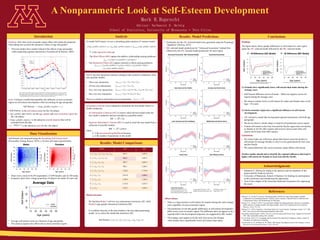
Findings:
The figure below shows gender differences in self-esteem for each region
under the AIC selected model followed by the BIC selected model.
(1) Females have significantly lower self-esteem than males during the
cccteenage years.
• Self-Esteem difference curves (Female – Male) are negative across all
regions during the teenage years
• We observe similar levels of self-esteem for males and females later in life
(age > 30 years)
(2) Socio-economic region has a significant influence on self-esteem
cccdevelopment.
• AIC selected a model that incorporated regional interactions with both age
and gender
• We do not observe similar shape or trend for all predictions across region
• Female self-esteem in the East Asia and the Pacific region does not decline
as sharply as for the other regions and recovers and exceeds male self-
esteem much faster than other regions
Limitations:
• We cannot make any inferences about what factors cause the decline in
self-esteem for teenage females or why it is less pronounced for East Asia
and the Pacific
• We cannot determine why socio-economic region affects self-esteem
Further studies should aim to identify the regional influences that lead to
higher self-esteem for females in East Asia and the Pacific.
10 20 30 40 50 60
10152025303540
Males
Age (years)
SelfEsteem
102030405060
#Responses
10 20 30 40 50 60
10152025303540
Females
Age (years)
SelfEsteem
20406080100120140
#Responses
The IE has four interaction function subspaces that could be combined to form
nine possible models:
• Three-way interaction:
• All two-way interactions:
• Two, two-way interactions:
• One, two-way interaction:
There is a model in which there are no interactions:
Information criterion were compared to determine the best model relative to
model complexity.
• An Information Criterion (AIC) is used to select the best model when the
true model is unknown and not included as a possible model.
• Bayesian Information Criterion (BIC) is used to select the true model from a
collection of possible models.
where
is the maximized log-likelihood function
is the number of parameters in the model
Question: How does socio-economic region affect self-esteem development
when taking into account the interactive effects of age and gender?
• Previous studies have mainly looked at the effects of age and gender
while neglecting regional interactions (Trzesniewski & Robins, 2005).
Goal: Construct a model that quantifies the influence of socio-economic
region on self-esteem development while accounting for age and gender.
• J is the self-esteem score for the i-th subject
• J and are the age, gender and socio-economic region for
the i-th subject
• L is the unknown smooth function that will be
estimated from the data
• J is the unknown error for the i-th subject
Self-Esteem was measured using the Rosenberg Self-Esteem Scale
(Personality Testing Project, 2014), a 10-item self-report questionnaire.
• There were a total of 44,438 respondents: 27,698 females and 16,740 males.
• Frequency plots show a large proportion of subjects are under 30 years old.
• Average self-esteem varies as a function of age and gender.
• This analysis ignores any effects due to socio-economic region.
Introduction
Data Visualization
To model Self-Esteem, we use a smoothing spline analysis of variance model:
• is the regression intercept
• The Main Effects (ME) capture the additive relationships among predictors
• The Interaction Effects (IE) capture interactive effects among predictors
Analysis
• Predictions for the AIC selected model were generated using the R package
‘bigsplines’ (Helwig, 2015)
• BIC selected model predictions for “Advanced Economies” plotted first,
followed by the AIC selected model predictions for each region
Results: Model Predictions Conclusions
References
Helwig, N. E., & Ma, P. (in press). Smoothing spline ANOVA for super-large samples: Scalable
cccomputation via rounding parameters. Statistics and Its Interface. (Special Issue on Statistical and
ccComputational Theory and Methodology for Big Data).
Helwig, N. E., & Ma, P. (2015). Fast and stable multiple smoothing parameter selection in smoothing
ccspline analysis of variance models with large samples. Journal of Computational and Graphical
ccStatistics, 24(3), 715-732.
Helwig, N. E. (2015). bigsplines: Smoothing Splines for Large Samples. R package version 1.0-7. URL:
cchttp://cran.r-project.org/web/packages/bigsplines/index.html
Personality Testing Project. (2014). Answers to the Rosenberg Self-Esteem Scale. Updated 15-Feb-2014.
ccURL: http://personality-testing.info/_rawdata/
R Core Team. (2015). R: A Language and Environment for Statistical Computing. Vienna, Austria: R
ccFoundation for Statistical Computing.
Trzesniewski, K. H., & Robins, R. W. (2005). Self-Esteem Development Across the Lifespan. Current
ccDirections in Psychological Science, 14(3), 158-162.
Acknowledgments
Model Selection:
• We find that Model 2 (all two-way interactions) minimizes AIC while
Model 6 (age-gender interaction) minimizes BIC.
• It is unlikely that any of the nine models is the true (data-generating)
model, so we select the model that minimizes AIC.
. :
. .
. A . – ,
A Nonparametric Look at Self-Esteem Development
Results: Model Comparisons
Model AIC BIC
1. 967.1 1,587.4
2. 964.3 1,603.5
3. 989.7 1,605.2
4. 986.1 1,386.2
5. 1,330.2 1,779.0
6. 1,014.9 1,383.6
7. 1,359.2 1,784.0
8. 1,352.8 1,635.6
9. 1,383.3 1,639.4
f (agei,genderi,regioni ) = f0 + fMain (agei,genderi,regioni )+ fInteraction (agei,genderi,regioni )
fMain = fA (agei )+ fG (genderi )+ fR (regioni )
fInteraction = fAG (agei,genderi )+ fAR (agei,regioni )+ fGR (genderi,regioni )
+ fAGR (agei,genderi,regioni )
f0
AIC = −2 ˆΓ + 2q
BIC = −2 ˆΓ + qln(n)
f0 + fMain + fAG + fAR
f0 + fMain + fAG + fAR + fGR + fAGR
f0 + fMain + fAG + fAR + fGR
f0 + fMain + fAG + fGR
f0 + fMain + fAR + fGR
f0 + fMain + fAG
f0 + fMain + fAR
f0 + fMain + fGR
f0 + fMain
Self-Esteemi = f0 + fA + fG + fR + fAG + fAR + fGR +εi
Observations:
• There is a large decline in self-esteem for females during the early teenage
years regardless of socio-economic region.
• The predictions reveal that gender differences in self-esteem development
differ across socio-economic region. The difference does not appear to be a
regional shift in the development trajectory (as suggested by BIC model).
• The teenage years appear to be the only time across the lifespan
when females have significantly lower self-esteem than males.
10 20 30 40 50 60
20242832
Average Data
Age (years)
SelfEsteem
males
females
Self-Esteemi = f (agei,genderi,regioni ) + εi
• Nathaniel E. Helwig for aiding in the analysis and development of this
project and for being my advisor
• University of Minnesota, School of Statistics for funding my participation
in this conference and introducing the opportunity
• Twin-Cities chapter of the American Statistical Association for organizing
the event
ˆΓ
q
Self-Esteemi
agei,genderi
f (agei,genderi,regioni )
regioni
εi ~ N(0,σ 2
)
10 20 30 40 50 60
2025303540
Advanced Economies (BIC Selected Model)
Age (years)
SelfEsteem
males
females
10 20 30 40 50 60
2025303540
Advanced Economies
Age (years)
SelfEsteem
males
females
10 20 30 40 50 60
2025303540
East Asia and the Pacific
Age (years)
SelfEsteem
males
females
10 20 30 40 50 60
2025303540
Europe and Central Asia
Age (years)
SelfEsteem
males
females
10 20 30 40 50 60
2025303540
Latin America and the Caribbean
Age (years)
SelfEsteem
males
females
10 20 30 40 50 60
2025303540
Middle East and North Africa
Age (years)
SelfEsteem
males
females
10 20 30 40 50 60
2025303540
South Asia
Age (years)
SelfEsteem
males
females
10 20 30 40 50 60
2025303540
Sub−Saharan Africa
Age (years)
SelfEsteem
males
females
fInteraction = fAG + fAR + fGR + fAGR
fInteraction = fAG + fAR + fGR
fInteraction = ( fAG + fAR ) or (fAG + fGR ) or (fAR + fGR )
fInteraction = ( fAG ) or (fAR ) or (fGR )
fInteraction = 0see also Twenge & Campbell, 2001); a large, cross-sectional
study of individuals aged 9 to 90 (Robins, Trzesniewski, Tracy,
Gosling, & Potter, 2002); and a cohort-sequential longitudinal
study of individuals aged 25 to 96 (Trzesniewski & Robins,
2004)—paint a portrait ofthe normative trajectory of self-esteem
across the lifespan (see Fig. 1). Below, we summarize the major
changes that occur from childhood to old age.
Childhood
Youngchildrenhaverelativelyhighself-esteem,whichgradually
declines over the course of childhood. Researchers have specu-
latedthatchildrenhavehighself-esteembecausetheirself-views
areunrealisticallypositive.Aschildrendevelopcognitively,they
begin to base their self-evaluations on external feedback and
social comparisons, and thus form a more balanced and accurate
appraisal of their academic competence, social skills, attrac-
tiveness, and other personal characteristics. For example, as
children move from preschool to elementary school they receive
more negative feedback from teachers, parents, and peers, and
their self-evaluations correspondingly become more negative.
Adolescence
Self-esteem continues to decline during adolescence. Re-
searchers have attributed the adolescent decline to body image
and other problems associated with puberty, the emerging ca-
pacity to think abstractly about one’s self and one’s future and
therefore to acknowledge missed opportunities and failed ex-
pectations, and the transition from grade school to the more ac-
ademically challenging and socially complex context of junior
high school.
Adulthood
Self-esteem increases gradually throughout adulthood, peaking
sometime around the late 60s. Over the course of adulthood,
individuals increasingly occupy positions of power and status,
which might promote feelings of self-worth. Many lifespan the-
orists have suggested that midlife is characterized by peaks in
achievement, mastery, and control over self and environment
(e.g., Erikson, 1985). Consistent with these theoretical specu-
lations,thepersonality changesthatoccurduringadulthoodtend
to reflect increasing levels of maturity and adjustment, as indi-
cated by higher levels of conscientiousness and emotional sta-
bility (Trzesniewski, Robins, Roberts, & Caspi, 2004).
Old Age
Self-esteem declines in old age. The few studies of self-esteem in
old age suggest that self-esteem begins to drop around age 70
(about the age when Michelangelo began working on the
Florentine Pieta`). This decline may be due to the dramatic con-
fluence of changes that occur in old age, including changes in
2.80
2.90
3.00
3.10
3.20
3.30
3.40
3.50
3.60
3.70
3.80
3.90
4.00
4.10
Age
Self-Esteem
9-12 13-17 18-22 23-29 30-39 40-49 50-59 60-69 70-79 80-90
Men
Women
Fig. 1. Mean level of self-esteem for males and females across the lifespan. Also plotted are year-by-year means,
separatelyformales(opentriangles)andfemales(opencircles).From‘‘GlobalSelf-EsteemAcrosstheLifespan,’’by
R.W. Robins, K.H. Trzesniewski, J.L. Tracy, S.D. Gosling, and J. Potter, 2002, Psychology and Aging, 17, p. 428.
Copyright 2002 by the American Psychological Association. Reprinted with permisson.
Volume 14—Number 3 159
Richard W. Robins and Kali H. Trzesniewski
BIC model doesn’t capture the interaction between gender and region.AIC model shows higher self-esteem for females in East Asia and the
Pacific. Other regions have very similar gender differences.