
Recommended

Recommended
More Related Content
What's hot
What's hot (16)
Similar to Canada Real GDP May 2017
Similar to Canada Real GDP May 2017 (20)
More from Mark MacIsaac
More from Mark MacIsaac (10)
Recently uploaded
Recently uploaded (20)
Canada Real GDP May 2017
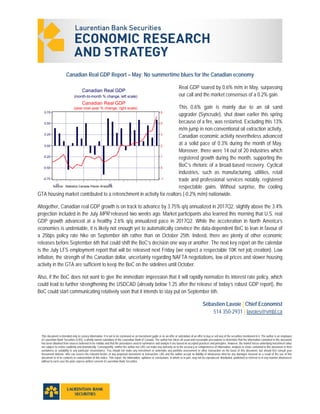
- 1. This document is intended only to convey information. It is not to be construed as an investment guide or as an offer or solicitation of an offer to buy or sell any of the securities mentioned in it. The author is an employee of Laurentian Bank Securities (LBS), a wholly owned subsidiary of the Laurentian Bank of Canada. The author has taken all usual and reasonable precautions to determine that the information contained in this document has been obtained from sources believed to be reliable and that the procedures used to summarize and analyze it are based on accepted practices and principles. However, the market forces underlying investment value are subject to evolve suddenly and dramatically. Consequently, neither the author nor LBS can make any warranty as to the accuracy or completeness of information, analysis or views contained in this document or their usefulness or suitability in any particular circumstance. You should not make any investment or undertake any portfolio assessment or other transaction on the basis of this document, but should first consult your Investment Advisor, who can assess the relevant factors of any proposed investment or transaction. LBS and the author accept no liability of whatsoever kind for any damages incurred as a result of the use of this document or of its contents in contravention of this notice. This report, the information, opinions or conclusions, in whole or in part, may not be reproduced, distributed, published or referred to in any manner whatsoever without in each case the prior express written consent of Laurentian Bank Securities. Canadian Real GDP Report – May: No summertime blues for the Canadian economy Real GDP soared by 0.6% m/m in May, surpassing our call and the market consensus of a 0.2% gain. This 0.6% gain is mainly due to an oil sand upgrader (Syncrude), shut down earlier this spring because of a fire, was restarted. Excluding this 13% m/m jump in non-conventional oil extraction activity, Canadian economic activity nevertheless advanced at a solid pace of 0.3% during the month of May. Moreover, there were 14 out of 20 industries which registered growth during the month, supporting the BoC’s rhetoric of a broad-based recovery. Cyclical industries, such as manufacturing, utilities, retail trade and professional services notably, registered respectable gains. Without surprise, the cooling GTA housing market contributed to a retrenchment in activity for realtors (-0.2% m/m) nationwide. Altogether, Canadian real GDP growth is on track to advance by 3.75% q/q annualized in 2017Q2, slightly above the 3.4% projection included in the July MPR released two weeks ago. Market participants also learned this morning that U.S. real GDP growth advanced at a healthy 2.6% q/q annualized pace in 2017Q2. While the acceleration in North America’s economies is undeniable, it is likely not enough yet to automatically convince the data-dependent BoC to lean in favour of a 25bps policy rate hike on September 6th rather than on October 25th. Indeed, there are plenty of other economic releases before September 6th that could shift the BoC’s decision one way or another. The next key report on the calendar is the July LFS employment report that will be released next Friday (we expect a respectable 10K net job creation). Low inflation, the strength of the Canadian dollar, uncertainty regarding NAFTA negotiations, low oil prices and slower housing activity in the GTA are sufficient to keep the BoC on the sidelines until October. Also, if the BoC does not want to give the immediate impression that it will rapidly normalize its interest rate policy, which could lead to further strengthening the USDCAD (already below 1.25 after the release of today’s robust GDP report), the BoC could start communicating relatively soon that it intends to stay put on September 6th. Sébastien Lavoie | Chief Economist 514 350-2931 | lavoies@vmbl.ca 1615 0.75 0.50 0.25 0.00 -0.25 -0.50 -0.75 5 4 3 2 1 0 -1 Canadian Real GDP (month-to-month % change, left scale) Canadian Real GDP (year-over-year % change, right scale) Source: Statistics Canada /Haver Analytics