1. 1
Mapping Livelihoods Value Chains in Maharashtra under
Umed – The Maharashtra State Rural Livelihoods Mission
Value chain analysis is key to designing and implementing strategic livelihoods interventions that impact production, productivity,
quality, price and sale. It is evident that value chain analysis has largely remained a priority and (as a result) area of expertise of
private organizations and corporations apart from agricultural universities that engage in value chains for academic interest. Value
chains are also looked at from a fair trade perspective where exploitative, unfair or environmentally unfriendly means of production
are tracked and corrective measures are taken to ensure fair trade. Comparatively, there are very few examples of value chain based
interventions in the development sector.
Largescale rural livelihoods programmes implemented by government and civil society organizations have attempted to support
livelihoods of the rural poor through finance and a range of extension services. However, there is a growing interest in and demand for
value chain oriented livelihoods interventions in rural livelihoods in recent times. Several value chain studies inform the livelihoods
sector today about strategic interventions (often low cost) that impact production and productivity apart from other aspects in a big
way. Very often the solutions to enhancing value chains lie in improved technology, effective financing, improved organizing and
timely and adequate access to backward and forward services.
It is important for Umed to engage in such analysis to leverage existing value chains and make systematic interventions to enhance
rural incomes.
As a first step towards understanding value chains, a rapid study at select locations was conducted with the help of Young
Professionals, District and Block Livelihoods Managers, Cluster Coordinators and a few State level managers.
The findings of the study were presented to a panel consisting of Ms.Ireena Vittal - Senior Consultant Strategic planning and Ms.
Leena Bansod, COO and CEO, Umed. Ms Ireena gave her suggestions to furthermore strengthen this study through filling the gaps
and finding out the Umed target groups within the value chains.
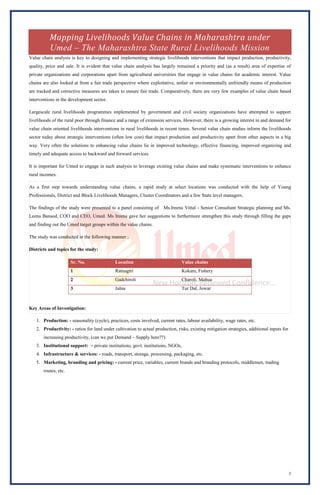
The study was conducted in the following manner ;
Districts and topics for the study:
Sr. No. Location Value chains
1 Ratnagiri Kokam, Fishery
2 Gadchiroli Charoli, Mahua
3 Jalna Tur Dal, Jowar
Key Areas of Investigation:
1. Production: - seasonality (cycle), practices, costs involved, current rates, labour availability, wage rates, etc.
2. Productivity: - ratios for land under cultivation to actual production, risks, existing mitigation strategies, additional inputs for
increasing productivity, (can we put Demand – Supply here??)
3. Institutional support: – private institutions, govt. institutions, NGOs,
4. Infrastructure & services: - roads, transport, storage, processing, packaging, etc.
5. Marketing, branding and pricing: - current price, variables, current brands and branding protocols, middlemen, trading
routes, etc.
2. 2
Value Chain Analysis of Kokum in Ratnagiri
Team Composition:
1. Mr. Satish Dombe, District Manager – Marketing, Ratnagiri
2. Ms. Meenakshi Jha, Young Professional
3. Mr. Pankaj Khot, Block Manager –Livelihoods, Ratnagiri
4. Mr. Ankush Durge, Cluster Coordinator, Ratnagiri
Process:
The process started with a one day workshop at the DMMU to discuss on the VCA, methodology, approach and key stake holders was
held. The team decided on personal interviews and focus group discussions with stake holders. 5 FGDs and 21 interviews in 6 villages
from 3 blocks were conducted during the study.
Key Findings
Kokum as a crop has high economic potential yet remains an underutilized crop. The total yield of the crop is 103 ton in within the
district. There are two varieties of Kokum – Native which matures in 7 to 8 years and the Grafts which mature in 3 to 4 years. Fruits
reach maturity for harvest during May to June. There are multiple products made from the fruit kokum – Juice, sweet rind, sour rind,
syrup and butter. Medicinal value of Kokum is very high. The kokum butter is a remedy for dysentery, piles, tumors. It has low
cholesterol content making it good for heart ailments therefore used for cooking. Kokum powder is used a raw material in Ayurvedic
pharmaceutical companies for medicines. Kokum juice is a remedy for acidity and related digestive problems. It has a cosmetic value
as it is used in winter skin cream, cracked heels and fat – reducing formulations.
The crop shares the cultivation season same as that of Mango and Cashew Nut. These two crops are the cash crops within the district
and hence employs high no. of labour at a higher daily wage rate of Rs.350 to Rs.400. Those cultivating Kokum are either plantation
owners or lease the trees. The plantation owners range from owning 100 trees to 2 trees. The home based processing units mainly
process kokum for household consumption and sell the remaining surplus to fixed clients or middleman. The large scale producers
invest in kokum products like juice where there is a high margin. There is a practice of processing it for self-consumption in
households where the fruit is abundantly available but is not looked at as a commercial activity.
Opportunity for crop:
1. Each part of the fruit can be processed into a new product which increases its commercial value.
2. Seedlings are easily available.
3. The crop has medicinal content therefore is of high demand in Ayurvedic medicine
Package of Practices:
1. As fruit matures in May to June same season of Mango and Cashewnut, hence labour to pluck the fruit is not available. In such
situations if the graft variety is fertilized with NPK they mature by April which increases labour availability.
2. The fruits freshly plucked needs to be transported and processed in the next 2 days for processing of the juice. The skill to
judge the correct ripeness allows better plucking from the same tree in period of 3 to 5 days. In case of rinds the fruits can be
shaken of and collected as well.
Price Variance:
Product SHG/ Women Distributer Retailer
Product
ion
cost/litr
e
Selling
price/
litre
Margin Margin
%
Cost
Price /
litre
Selling
price
/litre
Margin Margin
%
Cost
price/
litre
Selling
price/
litre
Margin Margin
%
Juice 82.5 90 7.5 8.3 90 95 15 25 95 118 23 19.5
Syrup 60 80 20 25 80 105 25 23.8 105 135 30 22.2
Sour
rind
95 120 25 20.8 120 145 25 17.2 145 180 35 19.4
3. 3
Key challenges:
1. The process of making products from the fruit is a labour intensive. The initial hurdle is to climb the cylindrical long tub- like
tree to pluck fruit requires skilled labour. The next aspect is of proper transportation in time.
2. The season of production for Kokum is the same as Mango and Cashew therefore it always remains as a low priority crop.
3. Pre monsoon showers decrease the fruit quality and fruit goes waste.
4. Currently the commercial processing units procure fruit from Karnataka, Sindhudurg and Kerala and not from Ratnagiri
5. It is a delicate fruit so extra care needs to be taken during transportation
6. Only fruits plucked from trees get high value whereas collected fallen fruits get lower value
7. The shelf life of fallen fruit is 1 day to the shelf life of plucked fruit is 4 to 5 days till it is transported to processing unit
8. The preparation process of kokum syrup is time taking and strenuous as it is in the same season of mango and cashew, hence
its low on priority.
9. During preparation of any product from kokum juice, the sourness of the fruit affects the hands of the labour.
10. Lack of technological support in plucking and processing the fruit as compared coconut & mango.
11. Market for the product is unexplored as compared to Mango & Cashew.
4. 4
Value Chain Analysis of Fisheries in Ratnagiri
Team Composition
1. Yogesh Bhamare, District Manager – Livelihoods, Thane
2. Malathy M, Young Professional
3. Asha Wavhal, Block Manager – Livelihoods, Ratnagiri
4. Shrinivas Kamble, Block Manager – Livelihoods, Ratnagiri
5. Meenakshi Valvi, Cluster Coordinator, Ratnagiri
Process
The study began with a one day workshop at district level to discuss Value Chain Analysis and decide the methodology and approach
for the same. The formats for the cash flow analysis were discussed along with the other methodology like focus group discussions,
interviews. The major stakeholders in Ratnagiri in marine fisheries were also listed down. 3 FGDs and 16 interviews were conducted
for the study along with informal discussions at the landing centre of Two villages in Ratnagiri block were selected on the basic of the
existence of marine fisheries activities for the study;
1. Kasarveli
2. Sakhartar
Key Findings
Fisheries is one of the major source of income in Ratnagiri with most of the population involved in fishing or allied activities like
retail, processing, ice factories etc. There are 104 fishing villages in the district with 15,515 active
fishermen. There are 80 fisheries cooperatives with 36840 members. 43 landing centres across the
district cater to the fisheries industries. The annual production in 2013- ’14 was 1,06,000 metric
tonnes. The major catch consists of squid, prawns, tuna and sardines. Over fishing has lead to
decrease in the quantity of the catch while the quality is also affected due to pollution. Thus
sustainability is a major question in this industry.
There are three major categories of boats; the hodi (which can take upto three fishermen), ballav (can
take 6-8 men) and trawlers (with varying capacities). The types of catch, seasonal impact varies for
these boats as does the maintenances and capital cost. Fishing involves high capital investment and
high maintenance costs which results in a system of advance where the ‘supplier’ (the middleman
who supplies to factories) has the right to the best and maximum share of the catch.
Informal labour is used for processing activities of fish before supplying to the factories. Hygiene is
a major issue for companies procuring from these ‘sheds’ where fish is cut and degutted. The fish
cutting sheds employ migrant labour which consists of the women whose men work in trawlers and
are from Karnataka and Andhra mostly. The rates for cutting are fixed for 35 kg of processed fish
and are not standardised. The payments are made on daily wage basis.
The retailing of fish is mostly done by women who buy fish from the at auctions at the landing
centre or sell the fish which are caught by the men in their families. They work for about 12-15 hours
a day. Wastage of fish is a major issue for the retailers as they do not have appropriate cold storage
facilities. Most of the fisheries cooperatives are inactive and merely function as the agency which
distributes the fuel subsidy. There are no other services and specifically nothing for the women who
are retailers.
5. 5
Cost Benefit Analysis for Trawler, Hodi and Retailer
Investment Costs Operating Cost Turnover Profit
Trawler Net 150000 Labour 360000 1500000 -134912
Advances 100000 Food 320000
Maintenance 200000
Ice 160000
Diesel 444912.16
1634912.16
Hodi Net 26000 Labour 0 288000 72000
Food 0
Maintenance 100000
Ice 6000
Diesel 84000
216000
Retailer Ice Box 1100 Transport 35200 216000 26950
Tray 750 Daily Purchase 144000
Ice 8000
189050
Increase in Price across the Value Chain
Key Challenges
Retailers
1. Low literacy levels among retailers
2. Less net gain due to lack of infrastructure and transport facilities and lack of social safety nets for insurance and health hazards
3. Questions of dignity and identity
4. Non bankable due lack of documentary evidence
5. No membership benefits from cooperative
Boat owners
1. High credit requirements – seems to be bonded to supplier
2. Lack of scientific vocational knowledge leading to unsustainable fishing practices
3. High working capital
4. Power dynamics – Coast guard, boat owners and supplier
5. Misunderstanding of rules, regulations and laws
6. Lack of access to safety nets
Labour
1. Migrant labourers at different stages
a. Boat
b. Fish cutting sheds
c. Loading/unloading
2. Vulnerability and high risk Seasonal labour
Consumer
Retailer sells at 170/kg
Transport :17.6 Rs Ice : Rs 4.4 Wastage : Rs 2.4 Profit: 16.6
Supplier sells at 130/kg to Retailer and 120/kg to Factory
Transport : 2.5 Rs Ice : 1 Rs Labour : 4 Rs Damage: 0.5 Rs
Profit : Rs12 from
Retailer and Rs 2
Factory
Fisherman sells at 110/kg
Boat Ice - 5 Rs Diesel - 45 Rs
Maintenance- 10
Rs
Labour - 40 Rs Profit = 10 Rs
1 Kg Catch of 100 Rs
6. 6
Value Chain Analysis of Charoli (Buchanania lanzan)
Team Composition:
1. Rohit Gharde, Young Professional, Nandurbar
2. Sanjay Gupta, Young Professional, Gondia
3. Rajendra Ingle, DM- Livelihoods (Farm), Gadchiroli
4. Sonali Bokare, DM – Livleihoods (Non Farm),
Gadchiroli
5. Gajanan Tajne, DM- KM, Gadchiroli
6. Shanta Khandekar, BM – Livelihoods, Aheri
7. Mahendra Bhisen, BM – Livelihoods, Kurkheda
8. Kunda Deotale, BM – Livelihoods, Dhanora
9. Netaji Aatram, BM – Livelihoods, Etapalli
10. Satish Umre, CC Etapalli
11. Manda Tofa, CC, Aheri
12. Dinesh Arse, CC,Etapalli
13. Reshim Neware, CC, Etapalli
Process:
A meeting with the district mission management team was held to plan for this study. Two villages from each block were selected for
the purpose of this study based on the existing knowledge and experience of the use of Charoli. A list of questions to be asked to the
stakeholders was also made during this meeting. The team was divided in two for each block. A total of 4 FGDs were conducted and
22 individual household interactions were done based on convenience sampling.
Two villages from each block selected for the purpose of this study are as follows;
Aheri Etapalli Block
1. Perimalli – 5 SHGs 1. Tomargunda – 8 SHGs
2. Aldande – 1 SHG 2. Petha – 9 SHGs
There were also interactions with the important stakeholders which included the following:
1. Kirana shops - village level
2. Small traders – Blocks and at village level
3. middle traders – District and Chattisgarh (manpur)
4. Big traders - Chattisgarh
5. Meeting with RFO – Block level
6. Meeting with DCF – District
7. Visiting various processing units – block and district
Key Findings
Buchanania lanzan also known as Chironji, Chiranji, Charoli fruits are delicious wild fruits. The seeds
of this fruit are regarded as low cost substitute for almonds. Chironji tree produces gum benzoin
similar but inferior to that from Styrax benezoin. The bark yields tannin (upto 13 percent) and is used
in tannin industries. Chironji is also used for coating tablets for delayed action. There are medicinal
uses for the plant in traditional systems like Ayurveda and Unani. The season of Charoli is quite short
starting from last week of April till first week of May.
There are two stages involved in processing of Charoli seeds. These include; (1) Soaking, washing and
peeling and (2) Removal of hard shell which is either done manually or mechanically . The cost of the
machine is about 6 lakhs but the in the whole district of Gadhchiroli there is only one machine
currently being used due to lack of availability. The manual process is a time taking and cumbersome
and there is 20% lesser yield .Thus most of the produce is sold without any processing.
The rate of Charoli after processing is about Rs 1000/kg compared to rate for unprocessed raw charoli
which is only Rs. 125/kg.
Details Raw Charoli
Production/tree/ season 5.5 kg
Collection /HH/day 1.5 kg
Total Production/HH/Season 8 kg
Quantity for domestic use 0.5 kg
Total quantity sold/season 7.5 kg
Avg Rate/ Season Rs 125/Kg
Total Avg Income/HH/season Rs. 937.5
Fig: Charoli after stage 1 and stage 2 processing
7. 7
Value Chain of Charoli
Key Challenges
1. Since the availability of Charoli is limited and the trees are located in a very large spread of area it becomes difficult to collect
Charoli in bulk.
2. Getting Charoli out of the shell is a meticulous process and while doing it people end up hurting their fingers.
3. Transportation risks
4. People do not see much profit in collection of Charoli majorly because it is not found in bulk.
5. Processing of Charoli is a labour intensive process and requires a lot of time.
6. Increasing the amount of Charoli collection is a challenge.
7. Access to market is a big challenge due to insurgency problem
8. There is no local market for Charoli. During the study it was found that the forest department had 10 kgs processed Charoli in
their possession.
8. 8
Value Chain Analysis of Mahua
Team Composition:
1. Rohit Gharde, Young Professional, Nandurbar
2. Sanjay Gupta, Young Professional, Gondia
3. Rajendra Ingle, DM- Livelihoods (Farm), Gadchiroli
4. Sonali Bokare, DM – Livleihoods (Non Farm),
Gadchiroli
5. Gajanan Tajne, DM- KM, Gadchiroli
6. Shanta Khandekar, BM – Livelihoods, Aheri
7. Mahendra Bhisen, BM – Livelihoods, Kurkheda
8. Kunda Deotale, BM – Livelihoods, Dhanora
9. Netaji Aatram, BM – Livelihoods, Etapalli
10. Satish Umre, CC Etapalli
11. Manda Tofa, CC, Aheri
12. Dinesh Arse, CC,Etapalli
13. Reshim, Neware, CC, Etapalli
Process:
A meeting with the district mission management team was held to plan for the conduct of the study. Two villages from each block
were selected for the purpose of this study based on the existing knowledge and experience of the use of Mahua A list of questions to
be asked to the stakeholders was also made during this meeting. The team was divided in two for each block. A total of 4 FGDs were
conducted and 22 individual household interactions were done based on convenience sampling.
Two villages from each block selected for the purpose of this study are as follows;
Aheri
1. Perimalli – 5 SHGs
2. Aldande – 1 SHG
Etapalli
1. Tomargunda – 8 SHGs
2. Petha – 9 SHGs
Key Findings
Mahua season lasts from Last week of March to third week of April. One tree gives flowers
for approximately 15 days. Initially the flowers obtained are large in number towards the
end of the season the collections keep on decreasing. Currently the Mahua is being sold for
Rs.25/- per kg. mahua is collected traditionally and the processing of mahua is done
manually. After collecting the mahua is dried and stored in bamboo containers covered with
plastic sheets. If stored properly mahua can be stored in these containers for over a period
of one year. The secondary processing of mahua leads to liquor and is used for domestic
use.
Every family in the villages is into Mahua collection and most of the collection is used for domestic use. Each family stores 1-1.5
quintals of mahua in their house. This mahua is used for barter or sold to meet the daily requirements as and when required. It has
been observed that when the stock of mahua gets over, people buy it from the kirana shops for as much as Rs.40/ kg.
Forest department gives a good price for the NTFP collected, but due to the limited buying capacity all the produce from the collectors
cannot be bought due to lack of funds. If the forest department increases its buying capacity a lot of illegal trade of mahua can be
brought under control. Forest department has started buying Mahua and charoli from the people for the past two years. It has been
observed that since the entry of forest department in the market the prices of Mahua have increased significantly. The price of Mahua
is decided by the CCF (chief conservator of Forest) and the collector of the district, based on the previous year’s price and the current
year’s production. No clear or systematic approach is used to decide the price. Forest department further sells the collection to the big
traders. Forest department in Gadchiroli district has taken important steps to market and process mahua. Mahua jam and juice is being
made in the Gadchiroli forest department processing unit. Currently Mahua products are being sold in various exhibitions. Forest
department is planning to expand the marketing of mahua products and is also looking to partner with professional organizations to
further promote and market mahua products.
Figure 1: Mahua Processing Unit in Gadhiroli
Forest Department
9. 9
A minimum and maximum range has been calculated for the production of mahua. The figures have been obtained by discussions with
villagers and area experts.
Activity Minimum Maximum
Per Tree Production/Season 1 Q 4 Q
Number of tress/household (HH) 6 10
Total Production/HH/Season 6 Q 40 Q
Amount of Mahua kept for domestic use 1.25 Q 2.5 Q
Total amount of Mahua sold and used in
Barter
4.75 Q 37.5 Q
Avg rate of Mahua Rs 16/kg
Avg Income /HH/Season Rs. 7600 Rs. 60000
Mahua tree holds a big place in the tribal community. Every part of the tree is useful. It is also called as ‘kalpvruksha’. It was observed
that women also consumed mahua and since it is a part of their culture they do not look at consumption of mahua as a reason for
domestic violence. There are also no figures to prove that consumption of mahua leads to domestic violence and also our study did not
revolve around that question. This can be a part of a separate study and further debate.
Value Chain of Mahua
Key Challenges
1. Health problems : As the collection season is in the summers, people face health risks such as heat
stroke, dehydration.
2. Seasonal activity and unpredictable production : Since the production of mahua flower is
unpredictable the total production of mahua in a year is difficult to estimate and people cannot
depend on mahua production for future planning.
3. Transportation risks : Most of the collection is transported to the big traders which are situated in
Chattisgarh. There is no bulk transportation available for the villagers the small traders take the
collection in small amounts and sell it to the middle and big traders.
4. Collection and access to market might get affected due to insurgency problem: Although the
insurgency problem does not hinder the collection process but it is anticipated that it might cause a
problem when concerned with access to market.
5. Large scale contamination and spoilage due to lack of proper storage facilities: There is a big
risk of large scale contamination and spoilage due to no proper handling knowledge of the produce. In some of the households
we observed that the mahua basket was kept on the ground. In cases when the mahua basket is kept on the floor the chances of
contamination increases and hence the mahua should be stored on a raised platform.
Figure 1: Mahua Stored in Bamboo Basket
10. 10
Value Chain Analysis of Jowar
Team Composition
1. Mr. Arun Rasal, District Manager - Knowledge Management
2. Ms. Swapnal Jagtap,- Young Professional , Jalna
3. Mr. S. Pakhare, Block Manger - Livelihoods, Jalna
4. Mr. Raju Rathod, Block Manager- Capacity Building , Jalna
5. Mr. Raman Sutare, Cluster coordinator,Jalna
Process
The study began with a one day workshop at district level to discuss Value Chain Analysis and decide the methodology & approach
for the same. Two villages from the each block were selected for this study. The team was divided into two persons for each block.
The formats for the cash flow analysis were discussed along with the other methodology like focus group discussions, interviews. The
major stakeholders in Jalna for Jowar were also listed down. 4 FGDs and interviews were conducted for the study along with informal
discussions at the selected villages in Jalna block
3. Ner
4. Waghrul
Team members also visited to APMC Jalna and had discussion with traders (Bhusar vyapari ) & middleman (Adatya ). They also
interacted with local kirana shop owners in villages.
Key Findings
The most significant part of the Jalna district is that about 80% of geographical area is under agricultural use. 75% area is under Kharif
crop and about 40% of land is under Rabbi Crop. The area under Jowar cultivation is 71.8 ha. (28%) in Jalna district and 2.2 ha. In
Jalna block. Bajra , Jowar, and wheat are the Major cereals grown in the district. The area under cotton is also extensive.
Details of crops pattern in Jalna district are given below
Maldandi , Moti ,Hipari Bedari and Gagadi are the main types of Jowar in Jalna district. The characteristic of this crop is that it
gives good production in non irrigated land also. The annual production in 2013-14 was 1,78,764 quintals. Farmers start sowing of
Jowar seeds in the month of October. Most of the farmers use seeds which they already have in their home from previous year. Most
of the farmers cultivate maldandi and bedari type of Jowar in Jalna block.
In Jalna production of jowar is basically for consumption at home but sometimes they sell it at the local shop. The rate is around 10 to
12 Rs. per Kg. and shopkeeper sells it at Rs. 20 to 30 Rs per kg. When the farmer brings Jowar at the district level to Agricultural
Types Name Cropping period in
months
Market (District ,
State Export )
Major Crops
(Irrigated)
Wheat
Vegetables
Oct. to Feb.
June to April
District
District
Major Crops
(Non - Irrigated)
Kharif Jowar
Rabi Jowar
Bajara
Maize
Tur
Udid
Mung
June to Sep
Oct. to Feb
June to Sep.
June to Sep.
June to Dec
June to Sep
June to sep.
District APMC
Major cash
Crops
Cotton June to Feb. District
11. 11
Production Market Committee i.e. APMC, at that time traders decide the rate with the help of middle men. Farmers sell Jowar to
traders in an open auction.
Women play a major role in cultivation & overall agriculture. But they are given very less importance when it comes to decision
taking like when and whom to sell the grains. Even it was observed that females are not brought to APMS market.
Value Chain of Jowar
Cost Benefit Analysis of Jowar /acre
Cost for Non - Irrigated (production 5 quintal )
in Rs.
Cost for Irrigated (Production 10 quintal )
in Rs.
Preparation of farm land 1000 1000
Sowing (by tractor ) 600 600
Seeds (1 bag = 5 kg) 100 100
Fertilizer (DPA or Mhadhan ) 1000 1000
Labour (6 Women) 600 600
To harvesting and other 1 quintal Jowar (2100) 1 quintal Jowar(2100)
Transportation (50 Rs. For 1
Quintal)
250 500
Commission to middleman (2.5% for
1 q )
262.5 525
Total cost 5912 6425
Market Rate for Jowar in August 2014(In Rs): 2100/1quintal
Total produce from Jowar 10500 2100
Profit 4588 14575
Key challenges
In Jalna district most of the farmers mainly cultivate cotton as cash crop and Jowar only for consumption at home.
Low production due to
Lack of water resources for cultivation or Lack of Irrigation
Drought
Unseasonal raining
Hailstorm
Farmers
For ConsumptionLocal Kirana Shop Small Traders
Bhusar Vyapari
Middle Man
(Adtya)
Traders
Mumbai
Pune
Nashik
Aurangabad
APMC कृ षी
उत्पन्न
बझार समिती
जालना
12. 12
Value Chain Analysis of Toor
Team Composition
1. Arun Rasal, District Manager – Knowledge Management, Jalna
2. Nitin Mendhe, Young Professional, Jalna
3. Geeta Gaikwad, Block Manager – Livelihoods, Bhokardan
4. Ramvilas Suryavanshi, Extension Officer, Bhokardan
5. Pandurang Dake, Cluster Coordinator, Bhokardan
6. Tukaram Kurhade, Cluster Coordinator, Bhokardan
Process
The Value Chain Analysis study started with a one day workshop at District Mission Management Unit, Jalna to discuss basic
concepts of Value Chain and decide the methodology and approach for the VCA study. Two villages namely Chandai Thombari and
Talegaon from Bhokardan block were selected for the purpose of VCA study based on the existing knowledge and experience. Four
focus group discussions (two in each village), six interviews with SHG members and farmers were conducted. A lot of informal
discussions with farmers and various stakeholders had been done to collect the information about the market structure and price trend
of toor.
Value Chain of Toor
Key Findings and Challenges
The area under cultivation is very small compared to other crops. In Chandai (Thombari) toor is a number seven while in
Talegaon it is a number four crop as per the data collected from Agriculture Department. Farmers take toor as a mixed crop
with cotton.
The motive of the farmer is to fulfill Household consumption need rather than to sell in the market and earn money.
In the whole value chain, farmers get exploited due to weak market linkages and lack of awareness.
There are very few mini dal mills in that region which processed dal. So, it is a little scope in the value chain and could be a
viable option for income generation.