Worksheets - Integrated Financial Projections - Google Sheets
1. 11-Feb-15
Amount Totals Depreciation Notes
$0
0 20.00 years
0 7.00 years
0 7.00 years
0 5.00 years
0 5.00 years
0 5.00 years
0
0
0
0
0
0
0
0
0
0
0
0
0
$0
Amount Totals Loan Rate Term in Months Monthly Payments
0.00% 0
0.00% 0
0.00% 0 9.00% 84.00 $0.00
0.00% 0 9.00% 240.00 $0.00
0.00% $0 $0.00
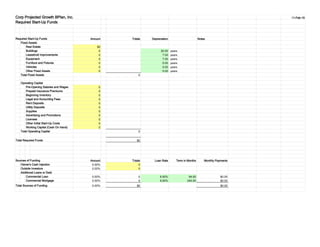
Corp Projected Growth BPlan, Inc.
Required Start-Up Funds
Required Start-Up Funds
Fixed Assets
Real Estate
Buildings
Leasehold Improvements
Equipment
Furniture and Fixtures
Vehicles
Other Fixed Assets
Total Fixed Assets
Operating Capital
Pre-Opening Salaries and Wages
Prepaid Insurance Premiums
Beginning Inventory
Legal and Accounting Fees
Rent Deposits
Utility Deposits
Supplies
Advertising and Promotions
Licenses
Other Initial Start-Up Costs
Working Capital (Cash On Hand)
Total Operating Capital
Total Required Funds
Sources of Funding
Owner's Cash Injection
Outside Investors
Additional Loans or Debt
Commercial Loan
Commercial Mortgage
Total Sources of Funding
2. 11-Feb-15
# Assumptions Wage Base Monthly Year One Year Two Year Three
3.00% 3.00%
0 $0 0 0 0
0 0 0 0 0
0 0 0 0 0
40.00
$9.00
0 0 0 0 0
20.00
$9.00
0 0 0 0
0 0 0 0 0
6.20% $102,000 0 0 0 0
1.45% 0 0 0 0
0.80% $7,000 0 0 0 0
2.70% $7,000 0 0 0 0
0.00% 0 0 0 0
0.00% 0 0 0 0
0.00% 0 0 0 0
0.00% 0 0 0 0
0 0 0 0
0 0 0 0
Corp Projected Growth BPlan, Inc.
Salaries and Wages
Salaries and Related Expenses
Percent Change
Salaries and Wages
Officer's Compensation
Salaries
Wages
Full-Time Employees
Estimated Hours Per Wee
Estimated Rate Per Hour
Part-Time Employees
Estimated Hours Per Wee
Estimated Rate Per Hour
Independent Contractors
Total Salaries and Wages
Payroll Taxes and Benefits
Social Security
Medicare
Federal Unemployment Tax (FUT
State Unemployment Tax (SUTA)
Employee Pension Programs
Worker's Compensation
Employee Health Insurance
Other Employee Benefit Program
Total Payroll Taxes and Benefits
Total Salaries and Related Expenses
3. 11-Feb-15
Monthly Year One Year Two Year Three Notes
3.00% 3.00%
$0 0 0 0
0 0 0 0
0 0 0 0
0 0 0 0
0 0 0 0
0 0 0 0
0 0 0 0
0 0 0 0
0 0 0 0
0 0 0 0
0 0 0 0
0 0 0 0
0 0 0 0
0 0 0 0
0 0 0 0
0 0 0 0
0 0 0 0
0 0 0 0
0 0 0 0
0 0 0 0
0 0 0 0
0 0 0 0
0 0 0 0
0 0 0 0
0 0 0 0
0 0 0 0
0 0 0 0
Corp Projected Growth BPlan, Inc.
Fixed Operating Expenses
Fixed Operating Expenses
Percent Change
Expenses
Advertising
Car and Truck Expenses
Commissions and Fees
Contract Labor
Credit Card and Bank Charges
Customer Discounts and Refunds
Dues and Subscriptions
Entertainment
Insurance (Liability and Property)
Internet
Legal and Professional Fees
Office Expenses
Postage and Delivery
Rent (on business property)
Rent of Vehicles and Equipment
Repairs and Maintenance
Supplies
Telephone and Communications
Travel
Utilities
Total Expenses
Other Expenses
Depreciation
Interest
Commercial Loan
Commercial Mortgage
Line of Credit
Total Other Expenses
Total Fixed Operating Expenses
4. 11-Feb-15
Assumptions % Month 1 Month 2 Month 3 Month 4 Month 5 Month 6 Month 7 Month 8 Month 9 Month 10 Month 11 Month 12 Totals
$0.00 100.00%
$0.00 0.00%
$0.00 0.00%
0.00% 0.00% 0.00% 0.00% 0.00% 0.00% 0.00% 0.00% 0.00% 0.00% 0.00% 0.00% 0.00%
0 0 0 0 0 0 0 0 0 0 0 0 0
10.00% 0 0 0 0 0 0 0 0 0 0 0 0 0
10.00% 0 0 0 0 0 0 0 0 0 0 0 0 0
50.00%
$0
0
0
0
0 0.00%
$0.00
0
$0.00 100.00%
$0.00 0.00%
$0.00 0.00%
0.00% 0.00% 0.00% 0.00% 0.00% 0.00% 0.00% 0.00% 0.00% 0.00% 0.00% 0.00% 0.00%
0 0 0 0 0 0 0 0 0 0 0 0 0
10.00% 0 0 0 0 0 0 0 0 0 0 0 0 0
10.00% 0 0 0 0 0 0 0 0 0 0 0 0 0
16.67%
$0
0
0
0
0 0.00%
$0.00
0
Corp Projected Growth BPlan, Inc.
Projected Sales Forecast
Products and Services
Product/Service A
Price Per Unit
Variable Cost Per Unit
Gross Margin Per Unit
Projected Unit Sales
Seasonality Factor
Year One
Year Two Growth
Year Three Growth
Fixed Expense Allocation
Projected Revenue
Variable Costs
Gross Margin
Fixed Expenses
Profit
Breakeven Sales Revenue
Breakeven Sales Units
Product/Service B
Price Per Unit
Variable Cost Per Unit
Gross Margin Per Unit
Projected Unit Sales
Seasonality Factor
Year One
Year Two Growth
Year Three Growth
Fixed Expense Allocation
Projected Revenue
Variable Costs
Gross Margin
Fixed Expenses
Profit
Breakeven Sales Revenue
Breakeven Sales Units
5. 11-Feb-15
Assumptions % Month 1 Month 2 Month 3 Month 4 Month 5 Month 6 Month 7 Month 8 Month 9 Month 10 Month 11 Month 12 Totals
$0.00 100.00%
$0.00 0.00%
$0.00 0.00%
0.00% 0.00% 0.00% 0.00% 0.00% 0.00% 0.00% 0.00% 0.00% 0.00% 0.00% 0.00% 0.00%
0 0 0 0 0 0 0 0 0 0 0 0 0
10.00% 0 0 0 0 0 0 0 0 0 0 0 0 0
10.00% 0 0 0 0 0 0 0 0 0 0 0 0 0
16.67%
$0
0
0
0
0 0.00%
$0.00
0
$0.00 100.00%
$0.00 0.00%
$0.00 0.00%
0.00% 0.00% 0.00% 0.00% 0.00% 0.00% 0.00% 0.00% 0.00% 0.00% 0.00% 0.00% 0.00%
0 0 0 0 0 0 0 0 0 0 0 0 0
10.00% 0 0 0 0 0 0 0 0 0 0 0 0 0
10.00% 0 0 0 0 0 0 0 0 0 0 0 0 0
16.67%
$0
0
0
0
0 0.00%
$0.00
0
Corp Projected Growth BPlan, Inc.
Projected Sales Forecast - Page 2
Products and Services
Product/Service C
Price Per Unit
Variable Cost Per Unit
Gross Margin Per Unit
Projected Unit Sales
Seasonality Factor
Year One
Year Two Growth
Year Three Growth
Fixed Expense Allocation
Projected Revenue
Variable Costs
Gross Margin
Fixed Expenses
Profit
Breakeven Sales Revenue
Breakeven Sales Units
Product/Service D
Price Per Unit
Variable Cost Per Unit
Gross Margin Per Unit
Projected Unit Sales
Seasonality Factor
Year One
Year Two Growth
Year Three Growth
Fixed Expense Allocation
Projected Revenue
Variable Costs
Gross Margin
Fixed Expenses
Profit
Breakeven Sales Revenue
Breakeven Sales Units
6. 11-Feb-15
100.00%
0.00%
0.00%
100.00%
100.00%
0.00%
0.00%
100.00%
$0.00
9.00%
0.00%
0 0
0 0
3.00 0
Corp Projected Growth BPlan, Inc.
Cash Receipts and Disbursements
Accounts Receivable Collections
Percent of Collections
0 to 30 days
31 to 60 days
More than 60 days
Total Collections Percentage
Accounts Payable Disbursements
Number of Days to Pay Suppliers
0 to 30 days
31 to 60 days
More than 60 days
Total Disbursements Percentage
Line of Credit Assumptions
Desired Minimum Cash Balance
Line of Credit Interest Rate
Income Tax Assumptions
Effective Income Tax Rate
Amortization of Start-Up Expenses
Amortization Period in Years
7. 12/31/12 %
0
0
0
0
0
0
0
0
0
0
0
0
0
0
0
0
0
0
0
0
0
Corp Projected Growth BPlan, Inc.
Balance Sheet (Prior EOY)
Assets
Current Assets
Cash
Accounts Receivable
Inventory
Prepaid Expenses
Other Current
Total Current Assets
Fixed Assets
Real Estate
Buildings
Leasehold Improvements
Equipment
Furniture and Fixtures
Vehicles
Other Fixed Assets
Total Fixed Assets
Less: Accumulated Depreciation
Total Assets
Liabilities and Owner's Equity
Liabilities
Accounts Payable
Notes Payable
Mortgage Payable
Line of Credit Balance
Total Liabilities
Owner's Equity
12. Base Period End of Year One
0 0
0 0
0 0
0 0
0 0
0 0
0 0
0 0
0 0
0 0
0 0
0 0
0 0
0 0
0 0
0 0
0 0
0 0
0 0
0 0
0 0
Corp Projected Growth BPlan, Inc.
Balance Sheet - Year One
Assets
Current Assets
Cash
Accounts Receivable
Inventory
Prepaid Expenses
Other Current
Total Current Assets
Fixed Assets
Real Estate
Buildings
Leasehold Improvements
Equipment
Furniture and Fixtures
Vehicles
Other Fixed Assets
Total Fixed Assets
Less: Accumulated Depreciation
Total Assets
Liabilities and Owner's Equity
Liabilities
Accounts Payable
Notes Payable
Mortgage Payable
Line of Credit Balance
Total Liabilities
Owner's Equity
13. 0 0
0 0
0 0
0 0
0 0
Statement Balances Statement Balances
Common Stock
Retained Earnings
Dividends Dispersed
Total Owner's Equity
Total Liabilities and Owner's Equity
14. Year One % Year Two % Year Three %
0 0 0
0 0 0
0 0 0
0 0 0
0 100.00% 0 100.00% 0 100.00%
0 0 0
0 0 0
0 0 0
0 0 0
0 0.00% 0 0.00% 0 0.00%
0 0.00% 0 0.00% 0 0.00%
0 0 0
0 0 0
0 0 0
0 0 0
0 0 0
0 0 0
0 0.00% 0 0.00% 0 0.00%
0 0 0
0 0 0
0 0 0
0 0 0
0 0 0
0 0 0
0 0 0
0 0 0
0 0 0
0 0 0
0 0 0
0 0 0
0 0 0
0 0 0
0 0 0
0 0 0
Corp Projected Growth BPlan, Inc.
Year End Summary
Income
Product/Service A
Product/Service B
Total Income
Cost of Sales
Product/Service A
Product/Service B
Total Cost of Sales
Gross Margin
Salaries and Wages
Officer's Compensation
Salaries
Full-Time Employees
Part-Time Employees
Independent Contractors
Payroll Taxes and Benefits
Total Salary and Wages
Fixed Business Expenses
Advertising
Car and Truck Expenses
Commissions and Fees
Contract Labor
Credit Card and Bank Charges
Customer Discounts and Refunds
Dues and Subscriptions
Entertainment
Insurance (Liability and Property)
Internet
Legal and Professional Fees
Office Expenses
Postage and Delivery
Rent (on business property)
Rent of Vehicles and Equipment
Repairs and Maintenance
15. 0 0 0
0 0 0
0 0 0
0 0 0
0 0.00% 0 0.00% 0 0.00%
0 0 0
0 0 0
0 0 0
0 0 0
0 0 0
0 0 0
0 0.00% 0 0.00% 0 0.00%
0 0.00% 0 0.00% 0 0.00%
Supplies
Telephone and Communications
Travel
Utilities
Total Fixed Business Expenses
Other Expenses
Amortized Start-up Expenses
Depreciation
Interest
Commercial Loan
Commercial Mortgage
Line of Credit
Taxes
Total Other Expenses
Net Income
19. End of Year One End of Year Two
0 0
0 0
0 0
0 0
0 0
0 0
0 0
0 0
0 0
0 0
0 0
0 0
0 0
0 0
0 0
0 0
0 0
0 0
0 0
0 0
0 0
Corp Projected Growth BPlan, Inc.
Balance Sheet - Year Two
Assets
Current Assets
Cash
Accounts Receivable
Inventory
Prepaid Expenses
Other Current
Total Current Assets
Fixed Assets
Real Estate
Buildings
Leasehold Improvements
Equipment
Furniture and Fixtures
Vehicles
Other Fixed Assets
Total Fixed Assets
Less: Accumulated Depreciation
Total Assets
Liabilities and Owner's Equity
Liabilities
Accounts Payable
Notes Payable
Mortgage Payable
Line of Credit Balance
Total Liabilities
Owner's Equity
20. 0 0
0 0
0 0
0 0
0 0
Statement Balances Statement Balances
Common Stock
Retained Earnings
Dividends Dispersed
Total Owner's Equity
Total Liabilities and Owner's Equity
24. End of Year Two End of Year Three
0 0
0 0
0 0
0 0
0 0
0 0
0 0
0 0
0 0
0 0
0 0
0 0
0 0
0 0
0 0
0 0
0 0
0 0
0 0
0 0
0 0
Corp Projected Growth BPlan, Inc.
Balance Sheet - Year Three
Assets
Current Assets
Cash
Accounts Receivable
Inventory
Prepaid Expenses
Other Current
Total Current Assets
Fixed Assets
Real Estate
Buildings
Leasehold Improvements
Equipment
Furniture and Fixtures
Vehicles
Other Fixed Assets
Total Fixed Assets
Less: Accumulated Depreciation
Total Assets
Liabilities and Owner's Equity
Liabilities
Accounts Payable
Notes Payable
Mortgage Payable
Line of Credit Balance
Total Liabilities
Owner's Equity
25. 0 0
0 0
0 0
0 0
0 0
Statement Balances Statement Balances
Common Stock
Retained Earnings
Dividends Dispersed
Total Owner's Equity
Total Liabilities and Owner's Equity
26. Year One Year Two Year Three
0.00 [1] 0.00 0.00
0.00 [2] 0.00 0.00
0.00 [3] 0.00 0.00
0.00 [4] 0.00 0.00
0.00 [5] 0.00 0.00
0.00 [6] 0.00 0.00
0.00 [7] 0.00 0.00
0.00 [8] 0.00 0.00
0.00 [9] 0.00 0.00
0.00 [10] 0.00 0.00
0.00 [11] 0.00 0.00
0.00 [12] 0.00 0.00
0.00 [13] 0.00 0.00
0.00 [14] 0.00 0.00
0.00 [15] 0.00 0.00
0.00 [16] 0.00 0.00
0.00 [17] 0.00 0.00
Corp Projected Growth BPlan, Inc.
Financial Ratios
Ratio
Liquidity
Current Ratio
Quick Ratio
Safety
Debt to Equity Ratio
Debt to Coverage Ratio
Profitability
Sales Growth
COGS to Sales
Gross Profit Margin
SG&A to Sales
Net Profit Margin
Return on Equity
Return on Assets
Owner's Compensation to Sales
Efficiency
Days in Receivables
Accounts Receivable Turnover
Days in Inventory
Inventory Turnover
Sales to Total Assets
27. Dollars Percent
$0 100.00%
0 0.00%
0 0.00%
0
0
0
0
0.00%
$0
to do ? variable costs
Corp Projected Growth BPlan, Inc.
Breakeven Analysis
Breakeven Analysis
Annual Sales Revenue
Cost of Sales
Gross Margin
Salaries and Wages
Fixed Operating Expenses
Total Fixed Business Expenses
Breakeven Sales Calculation
Breakeven Sales in Dollars
29. Value
0.00%
0.00%
9.00%
84
9.00%
240.00
0.00%
0.00%
$0
0.00%
0.00%
$0
0.00%
$0
$0
0.00%
0
0
0.00%
Corp Projected Growth BPlan, Inc.
Financial Diagnostics
This sheet performs a few tests on your numbers to see if they seem within certain reasonable ranges.
Remember, no computer can tell whether your projections are truly well-constructed, only a human can do that.
But these tests can at least look for values that are critically out of range.
Financial Diagnostics Notes: Observations & Assessments
General Financing Assumptions
Owner's Cash Injection into the Business Owner's injection might be too low in relation to the amount
Cash Request as percent of Total Required Funds Cash request seems reasonable with respect to total request
Loan Assumptions
Commercial Loan Interest rate Interest rate seems reasonable
Commercial Loan Term in Months Loan term seems within range for this type of loan
Commercial Mortgage Interest rate Interest rate seems reasonable
Commercial Mortgage Term in Months Loan term seems within range for this type of loan
Loan Payments as a Percent of Projected Sales Calculated loan payments as a percent of sales seem reson
Income Statement
Gross Margin as a Percent of Sales Gross margin percentage seems very low
Owner's Compensation Lower Limit Check An owner's compensation amount has not been established
Owner's Compensation Upper Limit Check Owner's compensation seems reasonable
Advertising Expense Levels as a Percent of Sales Advertising as a percent of sales may be too low
Profitability Levels The business is showing a profit
Profitability as a Percent of Sales The projection does not seem highly unreasonable
Cash Flow Statement
Desired Operating cash Flow Levels The financial projection provides the desired level of cash flo
Line of Credit Drawdowns The business doesn't seem to require a line of credit
Accounts Receivable Ratio to Sales Accounts receivable amount as a percent of sales seems re
Balance Sheet
Does the Base Period Balance Sheet Balance? The balance sheet does balance
Does the Final Balance Sheet Balance The balance sheet does balance
Debt to Equity Ratio The debt to equity ratio seems reasonable
31. [1] An indication of a company's ability to meet short-term debt obligations.
[2] The ratio between all assets quickly convertible into cash and current liabilities. Measures a company's liquidity. Also
called acid-test ratio.
[3] This ratio expresses the relationship between capital contributed by creditors and that contributed by owners.
[4] This ratio indicates how well your cash flow covers debt and the capability of the business to take on additional debt.
[5] This ratio calculates the percentage of increase (or decrease) in sales between the current year and the previous year.
[6] The percentage of sales used to pay for the COGS (expenses which directly vary with sales) is expressed in this ratio.
[7] This ratio indicates how much profit is earned on your products without consideration of indirect costs, selling and
administration costs.
[8] This ratio measures the percentage of selling, general and administrative costs to your amount of sales.
[9] Net profit margin shows how much profit comes from every dollar of sales.
[10] Return on equity determines the rate of return on your investment in the business. As an owner or shareholder this is one
of the most important ratios as it shows the hard fact about the business - are you making enough of a profit to compensate
you for the risk of being in business?
[11] This ratio measures how effectively assets are used to generate a return.
[12] This ratio measures the owner's compensation as a percentage of sales.
[13] Days in receivable calculates the average number of days it takes to collect your account receivable (number of days of
sales in receivables).
[14] This ratio tells you the number of times accounts receivable turnover during the year.
[15] This ratio shows the average number of days it will take to sell your inventory.
[16] This ratio calculates the number of times inventory is turned over (or sold) during the year.
[17] This ratio indicates how efficiently your business generates sales on every dollar of assets.