SlideShare a Scribd company logo
1 of 64
Professional Case Management
Vol. 19 , No. 6 , 255 - 262
Copyright 2014 © Wolters Kluwer Health | Lippincott Williams
& Wilkins
Vol. 19/No. 6 Professional Case Management 255
Copyright © 2014 Lippincott Williams & Wilkins. Unauthorized
reproduction of this article is prohibited.
CE 2.0 ANCCContact Hours
A B S T R A C T
Purpose of Study: In response to the U.S. Affordable Care
Act, the Centers for Medicare & Medicaid Services
proposed a change in reimbursement penalties for hospitals
beginning October 1, 2012. Reducing the
occurrence of unplanned readmissions has become a more
urgently focused topic. As part of the health care
system, care management aligns with physicians to signifi
cantly improve service, fi nancial, and clinical care
outcomes. To address the changing health care climate in 2008,
care management services were restructured
at an academic university medical center located in 1 of the 3
largest counties in California. Changing from
a unit-based to a service-based care management model
partnered care managers and social workers with
physician services. We sought to assess the effect of this change
on surrogates for patient experience and
clinical quality of care.
Primary Practice Setting: Tertiary academic medical center
in southern California.
Methodology and Sample: Retrospective data were
collected from 2 databases for all hospital patient care
services from November 2008 to January 2010 to determine
whether clinical quality of care and experiential
service improvements were realized. Primary outcomes included
all-cause and related readmission rates.
Secondary outcomes were Hospital Consumer Assessment of
Healthcare Providers and Systems (H-CAHPS)
scores. An interrupted time series analysis compared data from
the single institution for the diffusion and
postintervention periods.
Results: Comparing data from the diffusion and
postintervention periods, the rate of disease-related
readmissions
decreased signifi cantly (mean 5.43–4.58, p < .05), and all-
cause readmissions also decreased, although the
difference failed to achieve statistical signifi cance (11.42-
10.49, p = .056). H-CAHPS scores with the patient
response of “recommend this hospital” was unchanged over the
2 time points (mean 78.9%–77.8%, p = .26731).
Data also showed stable care management staffi ng rates
whereas average daily census (ADC) increased over
time (ADC 274–297).
Implications for Case Management Practice: With health
reform driving value-driven care transformation,
partnering care managers and social workers with physician
services has the potential to impact the patient’s
experience as well as fi nancial and clinical care outcomes. Care
managers serve a signifi cant role in improving
the clinical quality of care by reinforcing a consistent and clear
message by the health care team to the patient
during the entire hospitalization, not just at the time of
discharge. At one institution, partnering physicians
with care managers through the acute care continuum (service-
based care management) appeared to reduce
readmissions without compromising patient satisfaction. Both
readmission reduction and effective patient
satisfaction scores impact the Centers for Medicare & Medicaid
Services value-based purchasing reimbursement
calculations.
Key words: organization, quality, readmission,
reimbursement, satisfaction
Reduce Readmissions With
Service-Based Care Management
Alpesh N. Amin , MD, MBA, MACP, SFHM ,
Heather Hofmann , MD , Mary M. Owen , RN, MPA
,
Hai Tran , MPA , Saran Tucker , PhD, MPH ,
and Sherrie H. Kaplan , PhD, MPH
DOI: 10.1097/NCM.0000000000000051
I
n response to the U.S. Affordable Care Act signed
on March 23, 2010, the Centers for Medicare &
Medicaid Services (CMS) sought to reduce Medi-
care payments to hospitals through a Value-Based
Purchasing program ( CMS, 2011 ; McCarthy, John-
son, & Audet, 2013; U.S. Department of Health &
Human Services, 2013 ). This new approach included
a change in reimbursement penalties for hospitals
beginning October 1, 2012. As an opportunity for
improvement in service, quality, and cost, reduc-
ing the occurrence of unplanned readmissions has
become a more urgently focused topic. According
to one study, unplanned all-cause readmissions cost
Medicare $17.4 billion in 2004, with 20% of the
Medicare fee-for-service patients readmitted within
30 days of discharge ( Jencks, Williams, & Coleman,
Address correspondence to Alpesh N. Amin, MD, MBA,
MACP, SFHM, University of California, Irvine Health,
333 City Boulevard West, Suite 400, Orange, CA 92868
( [email protected] ).
The authors report no confl icts of interest.
PCM-D-14-00011_LR 255PCM-D-14-00011_LR 255
19/09/14 7:20 AM19/09/14 7:20 AM
256 Professional Case Management Vol. 19/No. 6
g
Copyright © 2014 Lippincott Williams & Wilkins. Unauthorized
reproduction of this article is prohibited.
2009 ). Whether interventions target all-cause or
diagnosis-specifi c readmissions, this change in reim-
bursement policies and practices makes generating
effective interventions to improve effi ciency, quality
and patient experience of care a systemwide priority
( Hines, Yu, & Randall, 2010 ).
At the national level, the Agency for Healthcare
Research and Quality (AHRQ) supports and offers
information regarding two evidence-based projects to
help prevent avoidable readmissions: Project BOOST
and Project RED (AHRQ, 2012b). Project BOOST,
or Project Better Outcomes for Older adults through
Safe Transitions, reduces readmissions in two ways:
mentor “hospital teams to map current processes and
create and implement action plans for organizational
change,” as well as provide “a suite of evidence-based
clinical interventions that can be easily adapted and
integrated into each unique hospital environment”
( Society of Hospital Medicine, 2012 ). The project
focuses on general medicine patients and recognizes
length of stay (LOS) and Hospital Consumer Assess-
ment of Healthcare Providers and Systems (H-CAHPS)
scores as areas of improvement ( Society of Hospital
Medicine, 2012 ). Project Re-Engineered Discharge
(RED) “is a patient-centered standardized approach
to discharge planning” that prepares patients for
discharge by immediately “designating a Discharge
Advocate to coordinate discharge with the care team
and patient” ( AHRQ, 2012a , 2012b ). Both programs
have associated hard costs for personnel to focus on
the targeted population, but costs vary depending on
the institution size. Care managers can provide the
level of patient advocacy needed to decrease the ten-
sion between evidence-based clinical processes and the
patient’s comprehension and readiness for discharge.
With health reform driving value-driven care
transformation, aligning care management with phy-
sician services can signifi cantly improve the patient’s
experience as well as fi nancial and clinical care
outcomes. Care managers serve a signifi cant role in
reducing readmissions ( Hughes, 2012 ). One meta-
analysis of 12 studies, 7 of which were conducted in
the United States, identifi ed “a 6% decrease in read-
mission rate for patients who received hospital-based
care management interventions” ( Kim & Soeken,
2005 ). However, few studies have examined the rela-
tionship between the structure of care management
and readmissions.
According to the Case Management Society of
America ( 2012 ), “case management is a collabora-
tive process … to meet an individual’s health needs [in
order] to promote quality cost-effective outcomes.” A
well-established model of outcomes management—
the Vanderbilt model—established the care manager
as part of a triad with the social worker and utilization
management to best coordinate a patient’s hospitaliza-
tion ( Erickson, 1998 ). The arrangement of care man-
agement varies by hospital, with staff often assigned as
either service- or unit-based. Both methods have pros
and cons that must be considered if converting from
one system to another ( Zander & Warren, 2005 ).
S ERVICE -B ASED C ARE M ANAGEMENT
In 2009, care management services were restructured
at the University of California, Irvine (UCI) Medi-
cal Center, a health care setting that renders tertiary
acute and ambulatory services for patients. The
transition from a unit-based to service-based system
was in response to perceived overstaffi ng of the care
management department based on a review by an
independent consulting fi rm in early 2008. By June
2008, a resource management expert reviewed the
care management program structure and functional
responsibilities. Given the national emphasis on effi -
ciency and effectiveness at the bedside, the consul-
tants recommended realignment to a service-based
model. Service-based care management provided uni-
form care coordination, decreased confusion between
care teams and patient families, managed expenses at
the point of service, and mobilized a team leader to
coordinate care from admission to discharge, with a
handoff to the ambulatory setting when necessary. It
was determined that a reduction in care management
staffi ng was not necessary, but rather an enhanced
emphasis on resource management was needed.
A multidisciplinary work team was assembled
and comprised care managers, nonlicensed autho-
rization coordinators, and clinical social workers,
championed by the executive director, UCI Hospi-
talist Program, and other medical staff leaders along
with the Director of Case Management, with the
support of the chief medical offi cer for UCI Medical
Center. The team outlined goals, including a target of
improving effi ciencies in care delivery and reducing
readmissions, while maintaining effective discharge
With health reform driving value-driven care transformation,
aligning care
management with physician services can signifi cantly improve
the patient’s experience
as well as fi nancial and clinical care outcomes .
PCM-D-14-00011_LR 256PCM-D-14-00011_LR 256
19/09/14 7:20 AM19/09/14 7:20 AM
Vol. 19/No. 6 Professional Case Management 257
Copyright © 2014 Lippincott Williams & Wilkins. Unauthorized
reproduction of this article is prohibited.
satisfaction scores. The roles and responsibilities of
the disciplines were defi ned, with the understanding
that each service line would function as a team, often
with roles overlapping on the basis of the case (see
Table 1 ).
By August 2008, the staffi ng and resource needs
were drafted utilizing historical case mix index, aver-
age LOS, and volume (the number of discharges and
patient days) for the physician service lines. The payer
mix was also considered an important element due
to insurance resource limitations that often drive the
ability, or inability, to transition care to the next level.
Based on staffi ng guidelines from the Center for Case
Management, it was anticipated that the service-line
model would require 12.7 additional staff, including
3.4 clinical social workers, 4.2 RN care managers,
and one decision support analyst ( Center for Case
Management, 2007 ). The team proceeded in support
of the resource management expert opinion and did
not seek additional staff at that time.
The service-based care management model was
offi cially rolled out in April 2009. We evaluated the
impact of this program on 30-day all-cause and dis-
ease-specifi c readmission rates and patient experience.
M ETHODS
Research Design
Retrospective data for all services from April 2009
to January 2010 were abstracted to assess the impact
of the program on clinical service improvements.
Improvements were a measure of reduced 30-day
readmission rates and increase or maintenance of
patient satisfaction following implementation of the
program. Two databases were available and used:
University Health System Consortium (UHC) and
Offi ce of Statewide Health Planning & Develop-
ment (OSHPD). Primary outcomes include all-cause
and related readmission rates. H-CAHPS scores were
secondary outcomes. The study time period was
evaluated on the basis of 2 defi ned periods of inter-
vention: April 2009 through August 2009 represents
implementation and diffusion of the intervention, and
TABLE 1
Service-Based Care Management Functional Team Practices
Clinical Social Worker Care Manager Care Coordinator
Verify discharge issues
Interact with family and care team
Educate on resources
Initiate border letters
Assess adjustments to illnesses (social)
Evaluate presumptive disability
Initiate disability letters/FMLA
Arrange patient/family conferences
Monitor compliance with advance health care directive
Collaborate with team on alternative care plans
Plan community resource needs
Verify discharge needs
Interact with family and care team
Facilitate resources
Initiate border letters
Assess adjustments to illnesses (social)
Evaluate presumptive disability
Initiate disability letters/FMLA
Arrange patient/family conferences
Assess adjustments to illnesses (clinical)
Collaborate with team on alternative care plans
Plan community resource needs
Conduct retrospective reviews on discharged cases
Monitor utilization management with payer
Evaluate resource utilization opportunities for
organizational improvement
Negotiate with payers to secure resources for safe
patient discharge
Facilitate follow-up care with physicians, anticoagulation
clinic, and education
Arrange follow-up care for unfunded
Collaborate with Pharmacy on medication needs for
safe discharge
Coordinate psychiatric/acute patient transfers
Verify discharge needs
Obtain equipment
Arrange resources
Research border resources
Note . FMLA = Family and Medical Leave Act.
Service-based care management
provided uniform care coordination,
decreased confusion between care
teams and patient families, managed
expenses at the point of service, and
mobilized a team leader to coordinate
care from admission to discharge, with
a handoff to the ambulatory setting
when necessary .
PCM-D-14-00011_LR 257PCM-D-14-00011_LR 257
19/09/14 7:20 AM19/09/14 7:20 AM
258 Professional Case Management Vol. 19/No. 6
Copyright © 2014 Lippincott Williams & Wilkins. Unauthorized
reproduction of this article is prohibited.
September 2009 through January 2010 represents the
postintervention time period.
Data Abstraction
Data were collected for the study time period on
patients discharged from UCI Medical Center and then
they experienced a subsequent readmission within
30 days of the index admission. Data collected from
UHC exclude chemotherapy, radiation therapy, reha-
bilitation, dialysis, newborn deliveries, mental diseases,
and alcohol and drug use patients. Patient satisfaction
scores refl ect patients older than 18 years with a hospi-
tal admission during the defi ned study period.
Intervention Periods
Two time periods were evaluated in this study. The
diffusion period was April 2009 through August
2009 and represents the period of implementa-
tion. Implementation began in April 2009 with full
implementation complete by August 2009. The pos-
tintervention period was September 2009 through
January 2010. This was the period following full
implementation of the intervention and represents a
period of equal length of time to the diffusion period.
Description of Measures
All-Cause Readmission
All-cause readmission monthly rate calculations were
based upon patients aged greater than 18 years who
returned to the hospital within 30 days of discharge
from the index admission, regardless of the Medicare
diagnosis-related group (MS-DRG) of either admission.
Related Readmission
Related readmission monthly rates were limited
to patients who returned to the hospital within
30 days with an MS-DRG related to the index
admission.
Analysis
Data Consistency
Trends comparing two data sources for 30-day read-
missions during the study time period were evalu-
ated to confi rm the observed trends for data col-
lected from the primary data source, UHC. Pearson’s
r (see Table 2 ) was calculated to evaluate the correla-
tion of monthly UCI 30-day readmission rates from
the UHC database to the rates from OSHPD data
source.
Interrupted Time Series
An interrupted time series (ITS) analysis (see Table 2 )
was conducted comparing trends between the diffu-
sion and postintervention periods for both all-cause
and related monthly 30-day readmission rates. An
autoregressive integrated moving average model (see
Table 2 ) was used to assess the difference in slope
TABLE 2
Glossary of Statistical Terms
Term Defi nition
Pearson’s r Linear or product
moment correlation
Measures the strength of the linear relationship between 2
variables. The correlation coeffi cient, r , ranges
from − 1 to 1. A value of 0 indicates no association.
ITS Interrupted time series
analysis
A method of statistical analysis to compare time trends before
and after intervention.
ARIMA Autoregressive
integrated moving
average
ARIMA methodology is applied to stationary time series data to
describe movement as a function of
autoregressive (AR) and moving average (MA) parameters.
AR Autoregressive Assessment of how a data set is related to
itself over time.
MA Moving average Used as a form of smoothing, by relating
what happens in a time period to the random error on the
previous time period
From “Interrupted Time-Series Analysis and Its Application to
Behavioral Data,” by D. P. Hartmann, J. M. Gottman, R. R.
Jones, W. Gardner, A. E. Kazdin, and R. S. Vaught,
1980, Journal of Applied Behavior Analysis , 13(4), pp. 543-
559.
…the staffi ng and resource needs
were drafted utilizing historical case
mix index, average length of stay, and
volume (the number of discharges
and patient days) for the physician
service lines. The payer mix was also
considered an important element due
to insurance resource limitations that
often drive the ability, or inability, to
transition care to the next level .
PCM-D-14-00011_LR 258PCM-D-14-00011_LR 258
19/09/14 7:20 AM19/09/14 7:20 AM
Vol. 19/No. 6 Professional Case Management 259
Copyright © 2014 Lippincott Williams & Wilkins. Unauthorized
reproduction of this article is prohibited.
between the diffusion and postintervention periods
for each measure.
Overall Mean Comparison
Mean 30-day readmission rates for the diffusion
and postintervention periods were also compared
to assess an overall change in 30-day readmission
rates following implementation and diffusion of the
intervention. Mean monthly hospital satisfaction
scores from the H-CAHPS survey were also assessed
as a secondary outcome to determine impact of the
service-based model on the patient’s satisfaction with
regard to recommending the hospital.
R ESULTS
Readmission Rates
Pearson’s r evaluating the correlation of monthly
UCI 30-day readmission rates from the UHC data-
base to the rates from OSHPD data source showed
a signifi cant correlation verifying consistency of the
observed trends in the primary data source ( r = .9,
p < .001).
The ITS analysis for 30-day readmission rates
for all-cause and related readmissions showed insig-
nifi cant negative slope changes comparing diffusion
with postintervention periods. An overall reduction
in mean readmission rates for all-cause and related
30-day readmissions was noted from diffusion of
intervention to postintervention (see Table 3 ). A
reduction in mean all-cause 30-day readmission from
11.42% to 10.49% readmissions was noted with a
signifi cant reduction in the mean related 30-day read-
mission rate from 5.43% to 4.58% readmissions.
Patient Satisfaction
The ITS analysis performed on monthly patient sat-
isfaction scores for nursing communication showed
insignifi cant slope changes comparing intervention
periods. In addition, there was no signifi cant change
in overall mean satisfaction between diffusion of
intervention and postintervention time periods (see
Table 4 ).
Staffi ng
Service-based care management typically requires
additional staffi ng due to logistical challenges of
services not geographically localized. However,
additional staff was not hired for this realignment.
As the census increased during the diffusion period
of the study due to hospital growth, additional per
diem staff supplemented the team as needed. From
November 2008 through January 2010, 1.67 addi-
tional FTEs were used while the census increased by
TABLE 3
Comparison of Mean Proportion of 30-Day Readmissions for
Diffusion and Postintervention Periods
Readmission Type Phase Mean Rate Mean Difference SE
average n a p
All-cause Diffusion 11.42 0.931 0.429 1474 0.056
Post 10.49 0.301 1444
Related Diffusion 5.43 0.857 0.271 1474 0.02
Post 4.58 0.226 1444
Note . All-cause = patients older than 18 years who returned
to the hospital within 30 days of discharge from index
admission, regardless of Medicare diagnosis-related
group (MS-DRG) of either admission. Related = patients older
than 18 years who returned to the hospital within 30 days of
discharge from index admission, with an MS-
DRG related to the index admission.
Diffusion period = April–August 2009.
Postintervention period = September 2009–January 2010. SE
= standard error.
a Average number of cases per month.
TABLE 4
Comparison of Mean Satisfaction Scores for Diffusion and
Postintervention Periods
Phase Mean Rate Mean Difference SE Average n a p
Diffusion 78.9 1.08 1.43 185 0.267
Post 77.8 0.86 178
Note . Satisfaction scores obtained from H-CAHPS survey
response to “Recommend the hospital.” Diffusion Period =
April–August 2009; Postintervention Period =
September 2009–January 2010. SE = standard error.
a Average number of cases per month.
PCM-D-14-00011_LR 259PCM-D-14-00011_LR 259
19/09/14 7:20 AM19/09/14 7:20 AM
260 Professional Case Management Vol. 19/No. 6
Copyright © 2014 Lippincott Williams & Wilkins. Unauthorized
reproduction of this article is prohibited.
approximately 25 patients per day (1:15 ratio equiva-
lent; see Figure 1 ).
D ISCUSSION
When faced with limited resources and reductions
in reimbursement for readmissions, changing from a
unit-based to a service-based care management model
assisted with reductions in readmissions without
compromising patients’ experience of the quality of
care. Given the importance of transitions of care, dis-
charge planning is a key focus for reducing readmis-
sions. It is well established that care management is
a fi eld that can effectively assist with discharge plan-
ning ( Maramba, Richards, Myers, & Larrabee, 2004 ;
Naylor, Aiken, Kurtzman, Olds, & Hirschman, 2011 ;
Simmons, 2005 ).
Numerous factors lie at the core of the issue of
readmissions. For one, studies have shown that there
is an important link between clinical quality and the
patient experience, referred to as experiential quality
( Chandrasekaran, Senot, & Boyer, 2012 ; Glickman et
al., 2010 ). Chandrasekaran’s team found that “CMS
process management is positively associated with
clinical quality but negatively associated with expe-
riential quality, suggesting a tension between the two
healthcare outcomes.” When they further explored
the link between readmissions and experiential quality
among 2,942 hospitals, a signifi cant and much stron-
ger correlation was identifi ed than found with clinical
process measures. In addition to experiential qual-
ity, factors such as insurance status and LOS greater
than 2 days can predict a readmission for medicine
service patients (Hasan et al., 2009). Others argue
that there are numerous barriers beyond tangible fac-
tors. According to an online survey of 51 National
Association of Public Hospitals and Health Systems
member facilities, one of four categories of barriers
to reducing readmissions is “hospital quality of care
barriers—systems or processes within a hospital that
When faced with limited resources
and reductions in reimbursement
for readmissions, changing from a
unit-based to a service-based care
management model assisted with
reductions in readmissions without
compromising patients’ experience of
the quality of care .
FIGURE 1
Care management staffi ng versus average daily census for
care managers. Staffi ng, number of care managers
during the given month. Average Daily Census, number of cases
supported by care managers on average per day
during the given month. Preintervention Period, November
2008–March 2009. Diffusion Period, April–August 2009.
Postintervention Period, September 2009–January 2010.
PCM-D-14-00011_LR 260PCM-D-14-00011_LR 260
19/09/14 7:20 AM19/09/14 7:20 AM
Vol. 19/No. 6 Professional Case Management 261
Copyright © 2014 Lippincott Williams & Wilkins. Unauthorized
reproduction of this article is prohibited.
directly contribute to poor quality of care for patients
(e.g., poor coordination of care)” ( Siegel, 2011 ).
Addressing these factors is a viable focus for improve-
ment in the quality of care. Employing care manage-
ment in patient satisfaction may reduce readmissions
and LOS ( Patient Satisfaction Planner, 2007 ).
The Affordable Care Act includes provisions for
hospital-level accountability for patients’ experience of
health care quality. As a community safety-net hospital
in southern California, this type of hospital has incurred
greater reimbursement reductions due to unfavorable
readmission rates ( Berenson & Shih, 2012 ; Joynt &
Jha, 2013 ; Rau, 2012 ). Extrapolation of these fi ndings
to other institution types is limited. However, all hospi-
tals should strive for improved patient experience that
service-based care management maintained.
In the age of value-based purchasing, one must
question the most appropriate intervention for care
management structure and readmission management.
Projects RED & BOOST may be less cost-effective
to pursue, compared with changing from a unit- to
service-based structure.
Factors external to the implementation of the ser-
vice-based care management model may have contrib-
uted to the success, given the organizational focus on
improving heart failure, acute myocardial infarction,
and pneumonia readmission rates. With the care man-
agement team aligned by service, the level of expertise
and knowledge of that population’s needs resulted in a
more proactive approach to discharge planning.
Targeted resource utilization analysis for specifi c
diagnostic-related groups (DRG) and cost of care
are currently being evaluated to determine secondary
improvements. A Resource Utilization Council employs
the expertise of the care management experts to help
delineate opportunities for effi ciency and effectiveness
improvements by DRGs within each service line.
There are several limitations to this study. First,
this is a retrospective study, with index cases from
a 5-month period. Data stem from a single institu-
tion, which may limit its application to other popu-
lations. Furthermore, readmissions were considered
if both the index and second admission occurred at
our institution. Failure to capture a readmission at
another institution limits the generalization to larger-
scale readmission reduction efforts. Finally, reliance
on H-CAHPS scores excludes patients who did not
complete the survey and may be an insuffi cient sur-
rogate for all components of patient satisfaction.
C ONCLUSIONS
The presence of care management in patient care is
essential to reducing readmissions. Our service-based
care management model contributed to reducing
related readmissions for all physician service lines
despite decreased staffi ng and without compromising
patient satisfaction.
ACKNOWLEDGMENT
The authors thank Susan Kelleghan, RN, for assis-
tance in H-CAHPS data analysis.
R EFERENCES
Agency for Healthcare Research and Quality . ( 2012a ).
Pre-
venting avoidable readmissions: Improving the hospi-
tal discharge process . Retrieved June 13, 2012, from
http://www.ahrq.gov/qual/impptdis.htm
Agency for Healthcare Research and Quality . ( 2012b ).
Project RED (Re-Engineered Discharge) training pro-
gram . Retrieved June 13, 2012, from http://www.ahrq
.gov/qual/projectred/
Berenson , J. , & Shih , A. ( 2012 ). Higher
readmissions at
safety-net hospitals and potential policy solutions .
New York, NY: The Commonwealth Fund .
Case Management Society of America . ( 2012 ). What is a
case manager? Retrieved June 19, 2012, from http://
www.cmsa.org/Home/CMSA/WhatisaCaseManager/
tabid/224/Default.aspx
Center for Case Management . ( 2007 ). Proposed frame-
work to plan/evaluate/benchmark staffi ng . Wellesley,
MA: Author.
Centers for Medicare & Medicaid Services . ( 2011 ).
Medi-
care program; hospital inpatient prospective payment
systems for acute care hospitals and the long-term care
hospital prospective payment system and FY 2012
rates; hospitals’ FTE resident caps for graduate medi-
cal education payment (No. Volume 76, No. 160) .
Washington, DC: Department of Health and Human
Services .
Chandrasekaran , A. , Senot , C. , & Boyer ,
K. K. ( 2012 ).
Process management impact on clinical and experi-
ential quality: Managing tensions between safe and
patient-centered healthcare . Manufacturing & Service
Operations Management , 14 ( 4 ), 548 . doi:10.1287/
msom.1110.0374
Erickson , S. M. ( 1998 ). The Vanderbilt model of
outcomes
management . Critical Care Nursing Clinics of North
America , 10 ( 1 ), 13 – 20 . Retrieved from http://www.
ncbi.nlm.nih.gov/pubmed/9644344
Glickman , S. W. , Boulding , W. , Manary , M.
, Staelin , R. ,
Roe , M. T. , Wolosin , R. J. , … Schulman , K.
A. ( 2010 ).
Patient satisfaction and its relationship with clinical
quality and inpatient mortality in acute myocardial
With the care management team
aligned by service, the level of expertise
and knowledge of that population’s
needs resulted in a more proactive
approach to discharge planning .
PCM-D-14-00011_LR 261PCM-D-14-00011_LR 261
19/09/14 7:20 AM19/09/14 7:20 AM
262 Professional Case Management Vol. 19/No. 6
Copyright © 2014 Lippincott Williams & Wilkins. Unauthorized
reproduction of this article is prohibited.
infarction . Circulation: Cardiovascular Quality
and Outcomes , 3 ( 2 ), 188 – 195 . doi:10.1161/CIRC
OUTCOMES.109.900597
Hartmann , D. P. , Gottman , J. M. , Jones , R.
R. , Gardner , W. ,
Kazdin , A. E. , & Vaught , R. S. ( 1980 ).
Interrupted time-
series analysis and its application to behavioral data .
Journal of Applied Behavior Analysis , 13 ( 4 ), 543 – 559 .
Hasan , O. , Meltzer , D. O. , Shaykevich , S. A.
, Bell , C. M. ,
Kaboli , P. J. , Auerbach , A. D. , … Schnipper ,
J. L. ( 2009 ).
Hospital readmission in general medicine patients: A
prediction model . Journal of General Internal Medi-
cine , 25 ( 3 ), 211 – 219 . doi:10.1007/s11606-009-1196-1
Hines , P. A. , Yu , K. , & Randall , M. (
2010 ). Preventing
heart failure readmissions: is your organization pre-
pared ? Nursing Economics , 28 ( 2 ), 74 – 85 . Retrieved
from http://www.ncbi.nlm.nih.gov/pubmed/20446378
Hughes , L. ( 2012 , May 15). A hybrid approach:
Univer-
sity Missouri improves 30-day all-cause readmissions
by 20%. Paper presented at the UHC Imperatives for
Quality Member Spotlight Web Conference . Retrieved
from https:// www.uhc.edu/docs/49016776_UHCread
missionspresentation (fi nal).pdf
Jencks , S. F. , Williams , M. V. , & Coleman ,
E. A. ( 2009 ).
Rehospitalizations among patients in the Medicare
fee-for-service program . The New England Jour-
nal of Medicine , 360 ( 14 ), 1418 – 1428 . doi:10.1056/
NEJMsa0803563
Joynt , K. E. , & Jha , A. K. ( 2013 ).
Characteristics of hos-
pitals receiving penalties under the Hospital Readmis-
sions Reduction Program . JAMA , 309 ( 4 ), 342 – 343 .
doi:10.1001/jama.2012.94856
Kim , Y.-J. , & Soeken , K. L. ( 2005 ). A meta-
analysis of the
effect of hospital-based case management on hospital
length-of-stay and readmission . Nursing Research ,
54 ( 4 ), 255 – 264 . Retrieved from http://www.ncbi.nlm
.nih.gov/pubmed/16027568
Maramba , P. J. , Richards , S. , Myers , A. L. ,
& Larrabee ,
J. H. ( 2004 ). Discharge planning process: applying a
model for evidence-based practice . Journal of Nursing
Care Quality , 19 ( 2 ), 123 – 129 . Retrieved from http://
www.ncbi.nlm.nih.gov/pubmed/15077829
McCarthy , D. , Johnson , M. B. , & Audet ,
A.-M. ( 2013 ).
Recasting readmissions by placing the hospital role
in community context . JAMA , 309 ( 4 ), 351 – 352 .
doi:10.1001/jama.2013
Naylor , M. D. , Aiken , L. H. , Kurtzman , E.
T. , Olds , D.
M. , & Hirschman , K. B. ( 2011 ). The care span: The
importance of transitional care in achieving health
reform . Health affairs (Project Hope) , 30 ( 4 ), 746 – 754 .
doi:10.1377/hlthaff.2011.0041
Patient satisfaction planner . ( 2007 ). Six Sigma project
slashes LOS for SNF discharges. Initiative targets
ambulation, early assessment . Hospital Peer Review ,
32 ( 12 ), 167 – 169 . Retrieved from http://www.ncbi
.nlm.nih.gov/pubmed/18232292
Rau , J. ( 2012 , August 8–12). Hospitals treating the
poor
hardest hit by readmissions penalties . Kaiser Health
News . Retrieved February 6, 2013, from http://
www.kaiserhealthnews.org/Stories/2012/August/13/
hospitals-treating-poor-hardest-hit-readmissions-
penalties.aspx
Siegel , B. ( 2011 ). Reducing readmissions in safety
net hospi-
tals & health systems (Research Brief). National Associ-
ation of Public Hospitals and Health Systems . pp. 1 – 16 .
Retrieved from http://www.naph.org/Main-Menu-
Category/Our-Work/Quality-Overview/Reducing-
Readmissions/Reducing-Readmissions-in-Safety-Net-
Hospitals-and-Health-Systems.aspx?FT = .pdf
Simmons , F. M. ( 2005 ). Hospital overcrowding: An
oppor-
tunity for case managers . The Case Manager , 16 ( 4 ),
52 – 54 ; quiz 55. doi:10.1016/j.casemgr.2005.06.004
Society of Hospital Medicine . ( 2012 ). Learn how BOOST
reduces readmission rates . Retrieved June 13, 2012,
from http://www.hospitalmedicine.org/AM/Template
. c f m ? S e c t i o n = H o m e & Te m p l a t e = / C M / H
T M L
Display.cfm&ContentID = 27576
U.S. Department of Health & Human Services . ( 2013 ).
Healthcare.gov . The Health Care Law & You .
Retrieved January 24, 2013, from http://www.health-
care.gov/law/index.html
Zander , K. , & Warren , C. ( 2005 ). Converting
case man-
agers from MD/service to unit-based assignments: A
before and after comparison . Lippincott’s Case Man-
agement: Managing the Process of Patient Care , 10 ( 4 ),
180 – 184 . Retrieved from http://www.ncbi.nlm.nih
.gov/pubmed/16056113
Alpesh N. Amin, MD, MBA, MACP, SFHM, is Tom and Mary
Cesario Chairman, Department of Medicine, the University of
California–
Irvine (UC Irvine). He is Professor of Medicine, Business,
Public Health
and Nursing at UC Irvine. He is also founder and executive
director of the
Hospitalist Program.
Heather Hofmann, MD, is a resident physician in the Depart-
ment of Medicine at UC Irvine with a research interest in
quality improve-
ment in the inpatient setting.
Mary M. Owen, RN, MPA, is currently the director of Patient
Experience at the University of California, Irvine Health.
Previously, she
spent 15 years as the senior director of Quality and Care
Management at
UC Irvine Health, where the service-based care management
model was
implemented.
Hai Tran, MPA, is currently a senior analyst in Quality &
Patient
Safety Department at UC Irvine Health.
Saran Tucker, PhD, MPH, is currently a part-time Professor
of Health Sciences at California State University, Fullerton. She
is also
founder of The Data Result, LLC, a data management consulting
fi rm.
Previously, she was the manager of Quality & Patient Safety
Department
at UC Irvine Health.
Sherrie H. Kaplan, PhD, MPH, is the assistant vice chancellor
of
Healthcare Measurement and Evaluation in the UC Irvine
School of Medi-
cine and executive co-director of the Health Policy Research
Institute at the
University of California, Irvine.
For more than 41 additional continuing education articles
related to
Case Management topics, go to NursingCenter.com/CE.
PCM-D-14-00011_LR 262PCM-D-14-00011_LR 262
19/09/14 7:20 AM19/09/14 7:20 AM
Managing to improve quality: The
relationship between accreditation
standards, safety practices, and
patient outcomes
Deirdre K. Thornlow
Elizabeth Merwin
Background: Given the trend toward eliminating reimbursement
for ‘‘never events,’’ hospital administrators are
challenged to implement practices designed to prevent their
occurrence. Little evidence exists, however, that
patient safety practices, as evaluated using accreditation
criteria, are related to the achievement of patient safety
outcomes.
Purpose: The aim of this study was to examine the relationship
between patient safety practices, as measured by
accreditation standards, and patient safety outcomes as
measured by hospital rates of infections, decubitus
ulcers, postoperative respiratory failure, and failure to rescue.
Methodology: Secondary data were used to examine
relationships between patient-safety-related accreditation
standards and patient outcomes in U.S. acute care hospitals.
Accreditation performance areas were reduced
into subscores to represent patient safety practices. Outcome
rates were calculated using the Agency for
Healthcare Research and Quality Patient Safety Indicator
software. Multivariate regression was performed to
determine the significance of the relationships.
Findings: Three of four multivariate models significantly
explained variance in hospital patient safety indicator
rates. Accreditation standards reflecting patient safety practices
were related to some outcomes but not others.
Rates of infections and decubitus ulcers occurred more
frequently in hospitals with poorer performance in
utilizing patient safety practices, but no differences were noted
in rates of postoperative respiratory failure or
failure to rescue.
Practice Implications: Certain adverse events, such as infections
and decubiti, may be reduced by preventive
protocols that are reflected in accreditation standards, whereas
other events, such as failure to rescue and
postoperative respiratory failure, may require multifaceted
strategies that are less easily translated into protocols.
Our approach may have influenced the observed associations yet
represents progress toward assessing whether
safety practices, as measured by accreditation standards, are
related to patient outcomes.
July–September � 2009262
Deirdre K. Thornlow, PhD, RN, CPHQ, is Assistant Professor,
School of Nursing, Duke University, Durham, North Carolina.
E-mail:
[email protected]
Elizabeth Merwin, PhD, RN, FAAN, is Associate Dean,
Research, Madge M. Jones Professor of Nursing, and Director,
Rural Health Care
Research Center, School of Nursing, University of Virginia,
Charlottesville. E-mail: [email protected]
This study was approved by the institutional review board
(UVA No. 2004-0255-00) and supported by Grant No. F31
NR009320-01 from the
National Institute for Nursing Research. The contents of this
article are solely the responsibility of the authors and do not
necessarily represent the
official views of the National Institute for Nursing Research.
Key words: adverse events, hospital accreditation, outcomes,
patient safety, safety practices
Health Care Manage Rev, 2009, 34(3), 262-272
Copyright A 2009 Wolters Kluwer Health | Lippincott Williams
& Wilkins
9Copyright @ 200 Lippincott Williams & Wilkins.
Unauthorized reproduction of this article is prohibited.
H
ospitals should be motivated more than ever to
commit resources and attention to patient safety,
for beginning October 2008, the Centers for
Medicare and Medicaid Services (CMS) eliminated or
reduced payments for pressure ulcers, hospital-acquired
infections, and other ‘‘never events,’’ defined as prevent-
able adverse events that should never occur in health care
(CMS, 2007). This change in reimbursement follows
earlier CMS initiatives that now require hospitals to
submit evidence-based quality measures or suffer reduc-
tions in their Medicare Annual Payment Updates. The
CMS is expanding reimbursement models by reward-
ing hospitals with higher Medicare payment for better
mortality outcomes; poor performing hospitals will be
penalized with reduced payments. Such reimbursement
changes may be justified by research evidence demon-
strating that most medical errors, or adverse events, are
preventable (Lehman, Puopolo, Shaykevich, & Brennan,
2005; Thomas et al., 2000) and hospitalized patients who
experience a medical error remain hospitalized longer
and accrue greater costs when compared with controls
(Nordgren, Johnson, Kirschbaum, & Peterson, 2004;
Rojas, Silver, Llewellyn, & Rances, 2005).
The research approach in this study may inform
hospitals about the influence of organizational character-
istics and processes of care on patient safety outcomes.
Although studies have shown associations between char-
acteristics of hospital systems, such as teaching status,
ownership status, nurse staffing, and patient safety out-
comes (Ayanian, & Weissman, 2002; Devereaux et al.,
2002; Kupersmith, 2005; Stanton, 2004), few studies have
examined how these hospital characteristics influence
utilization of patient safety practices, and even fewer
studies have examined the impact of using patient safety
practices on patient outcomes. In designing patient
safeguards, it is essential to consider how patient safety
practices, defined as types of care processes whose
application reduces the probability of an adverse event
(Shojania, Duncan, McDonald, & Wachter, 2002), con-
tribute to safe care. This is challenging, as little evidence
suggests that safety practices, such as those commonly used
in non-health-care fields, confer benefit in acute care
hospitals, especially on patient outcomes (Shojania et al.,
2002). When evidence does exist regarding efficacy of
safety processes, organizations have made attempts to
translate such evidence into practice, to include incorpo-
rating patient safety standards into the hospital accredi-
tation process (Kizer & Blum 2005; Leape, Berwick, &
Bates, 2002); however, the link between these practices
and outcomes has not yet been clarified.
In this study, secondary data were used to examine
relationships among hospital systems, utilization of patient
safety practices, as measured by accreditation standards,
and patient outcomes in acute care hospitals to determine
whether the use of patient safety practices influences rates
of four patient safety indicators: infections due to medical
care, decubitus ulcers, postoperative respiratory failure,
and failure to rescue. We hypothesized that teaching
hospitals, hospitals with higher nurse staffing levels, and
hospitals using more patient safety practices would ex-
perience lower rates of these patient safety incidents than
would nonteaching hospitals, hospitals with lower levels of
nurse staffing, and hospitals using fewer patient safety
practices. Findings, implications for current practice, and
suggestions for future research designed to improve patient
safety in acute care hospitals will be presented.
Conceptual Framework
The Quality Health Outcomes Model (QHOM; Mitchell,
Ferketich, & Jennings, 1998) served as the conceptual
framework for this study. In 1998, the Expert Panel on
Quality Health Care of the American Academy of
Nursing published the QHOM as a conceptual framework
for quality and outcomes research, most specifically as a
means to test relationships among the elements of struc-
ture, process, and outcomes. The QHOM built on these
three elements from Donabedian’s (1966) seminal work in
assessing the quality of medical care and incorporated
client, or patient, characteristics as a fourth construct. The
QHOM realigned the constructs to capture their dynamic,
rather than linear, relationships. The traditional ‘‘struc-
ture’’ construct was renamed ‘‘system’’ in the QHOM,
whereas the traditional ‘‘process’’ construct was renamed
‘‘intervention.’’ The QHOM posits reciprocal interactions
among the four constructs (system, intervention, outcome,
and client), thus serving as a useful conceptual guide for
health care systems researchers. Several investigators have
used the QHOM model in acute and community care to
organize their choice of variables among the four con-
structs and to build evidence regarding the quality of
health care (Mayberry & Gennarro, 2001; Radwin &
Fawcett, 2002; Sin, Belza, LoGerfo, & Cunningham,
2005). In this study, system variables included hospital
characteristics such as teaching status, ownership status,
size, location, and nurse staffing levels; intervention vari-
ables were defined as utilization of patient safety practices;
outcomes, or patient safety indicators, were defined by the
Agency for Healthcare Research and Quality (AHRQ,
2007); and client characteristics were defined as risk-
adjusted variables including diagnosis, age, and gender.
The client variables were used to flag potentially pre-
ventable complications and to create hospital-level risk-
adjusted patient safety indicator rates (AHRQ, 2007).
Measures for each of the constructs are described below.
Methods
Secondary data were analyzed from a stratified probability
sample of acute care hospitals. Hospital-level data were
Safety Practices and Patient Outcomes 263
9Copyright @ 200 Lippincott Williams & Wilkins.
Unauthorized reproduction of this article is prohibited.
gathered from the 2002 American Hospital Association
(AHA) annual survey data and 2002 Joint Commission
(JC) accreditation performance reports. Hospital accred-
itation performance reports were retrieved online from
JC Quality Check (www.jointcommission.org) in 2005.
Patient-level data were gathered from the 2002 Nation-
wide Inpatient Sample (NIS), the largest all-payer
inpatient database in the United States which contains
patient-level clinical and resource data on hospital stays
from states participating in the Healthcare Cost and
Utilization Project and is designed to approximate a 20%
stratified probability sample of U.S. community hospitals
(AHRQ, 2008). Patient characteristics were risk adjusted
by age, gender, diagnoses, and comorbidities using the
AHRQ (2007) comorbidity software algorithm, as de-
scribed in the ‘‘Measures’’ section.
Study Sample
General medical–surgical community hospitals, as clas-
sified by AHA, served as the population for study.
Specialty hospitals, such as children’s, psychiatric, and
rehabilitation hospitals, were excluded because the se-
lected patient safety indicators address incidents that
are more likely to occur in general medical–surgical
adult patients. The 2002 NIS inpatient discharge-level
file, which contains data for 100% of the discharges (n =
7,853,982) from 995 hospitals in 35 participating states,
was used. Of the 35 states in the 2002 NIS sample, 10
states prohibit release of AHA hospital identifiers; there-
fore, these states’ hospitals were excluded. In addition,
one state did not code patient comorbidities, data that
are necessary to risk adjust; therefore, this state and its
hospitals also were excluded from the sample. And fi-
nally, to complete analyses, it was necessary to match the
2002 NIS data to 2002 JC survey data; therefore, only
those hospitals surveyed by JC in 2002 were included in
this study—four states had no surveyed hospitals in the
2002 NIS sample. The study sample was composed of
1,430,981 inpatient discharge records from 115 hospitals
in 20 states. Sample size equaled less than 115 hospitals
for two of four outcomes studied due to coding limitations
in two states that precluded inclusion (e.g., missing ad-
mission type).
Measures
Data were used to construct variables that measured
hospital systems, utilization of patient safety practices, and
risk-adjusted patient outcomes. Hospital system variables
were constructed from NIS and AHA survey data. These
descriptive structural measures included nurse staffing
(ratio of RN full-time equivalents to adjusted average
daily census [A-ADC]), teaching status, hospital location
(urban or rural based on metropolitan statistical area
population standards), hospital size (A-ADC), and owner-
ship. Certain variables were recoded to conserve degrees
of freedom. First, the continuous variable A-ADC was
used to measure hospital size rather than NIS-designated
categories small, medium, and large. Second, hospital
ownership was originally classified by NIS in five cate-
gories: government nonfederal; private, not-for-profit;
private, investor owned; and two additional categories
into which smaller strata of hospitals were collapsed.
Federal hospitals are not sampled in NIS. Due to the
large numbers of hospitals within the two NIS-collapsed
categories, precise ownership information for each of
the 115 sample hospitals was obtained from the 2006
AHA directory so that all hospitals could be accurately
categorized, without the need for collapsed categories.
Ownership was then coded into two levels: for-profit
and other.
Joint Commission Accreditation Performance Reports
were used to construct a measure of each hospital’s
utilization of patient safety practices. During accreditation
surveys, 45 performance areas encompassing nearly 500
standards are evaluated and scored. It should be noted that
accreditation performance areas were scored on a scale of 1
to 5, with 5 being the poorest score; thus, a higher score
indicates poorer performance in using that safety practice.
Because only half of the JC standards related to patient
safety, as noted by the JC (2003), and little variation
existed among our study hospitals in their overall ac-
creditation scores (M = 92.3, SD = 3.68), we sought a
parsimonious method to differentiate patient safety
practices among hospitals. Using a 4-point scale (1 =
‘‘not relevant’’ to 4 = ‘‘very relevant’’), an expert panel
composed of hospital quality improvement directors and
nurse executives, excluding the authors, evaluated the
45 performance areas to determine, in their expert
opinion, which performance areas most embodied patient
safety. The expert panelists unanimously rated 12 per-
formance measures as most relevant to patient safety
(rating of 3 or greater). The content validity index was
measured by percentage reviewer agreement for each item
and for the total 45-item instrument. Across the in-
strument, the content validity index equaled 0.74; a score
of 0.78 or better indicates good content validity (Polit,
Beck, & Owen, 2007). We then conducted principal
components analysis, using an orthogonal rotation, to
determine the underlying structure for the 12 retained
measures; this produced a four-component solution that
was evaluated as adequate using four criteria: eigenvalue
>1, variance, scree plot, and residuals. In this study, factor
loadings ranged from .414 to .798, with an average of .631,
generally considered very good (Comrey & Lee, 1992;
Fleury, 1998). Aggregate factor scores created parsimony
in variables tested; likewise, an additional strength of this
technique is that, because factors are orthogonal, the
factor scores are nearly uncorrelated and can be used in
July–September � 2009264 Health Care Management REVIEW
9Copyright @ 200 Lippincott Williams & Wilkins.
Unauthorized reproduction of this article is prohibited.
regression analyses without producing multicollinearity
among the subsets of variables (Tabachnick & Fidell,
2001). The four regression factor scores were used to
represent patient safety practices in this study and were
named ‘‘surveillance capacity,’’ ‘‘assessing patient needs,’’
‘‘care procedures,’’ and ‘‘measuring processes.’’ Detailed
information regarding this factor analysis has been
published elsewhere (Thornlow, 2008).
Hospital rates of occurrence for each of four indicators,
infections due to medical care, decubitus ulcers, failure to
rescue, and postoperative respiratory failure, were calcu-
lated by applying the Patient Safety Indicator (PSI) soft-
ware (version 3.0a) to the NIS data set (http://www.
qualityindicators.ahrq.gov/psi_download.htm). These indi-
cators were selected because prior research has suggested
that these outcomes are potentially attributable to organi-
zational characteristics (AHRQ, 2007; Romano, Geppert,
Davies, Miller, Elixhauser, & McDonald, 2003), includ-
ing nurse staffing (Aiken, Clarke, Sloane, Sochalski, &
Silber, 2002; Blegen, Goode, & Reed, 1998; Kovner &
Gergen, 1998; Lichting, Knauf, & Milholland, 1999;
Needleman, Buerhaus, Mattke, Stewart, & Zelevinsky,
2002; Unruh, 2003) and care processes (Danks, 2006;
Frantz, 2004; Gastmeier & Geffers, 2006; Kovner &
Gergen, 1998; Lyder, 2003). In calculating rates, the PSI
software generates an algorithm that uses the ICD-9-CM
diagnosis and procedure codes, date of procedure, and pa-
tient characteristics, including age, gender, and diagnosis-
related group, to flag potentially preventable complications.
In running the software, hospital-level risk-adjusted ratios
with smoothing were calculated for the four patient safety
indicators. The smoothing process applies shrinkage fac-
tors to reflect a reliability adjustment unique to each in-
dicator. The less reliable the PSI is over time and across
hospitals, the more the estimate shrinks the PSI toward
the overall mean. The resulting rate appears ‘‘smoother,’’
or more conservative than the raw rate, and random year-
to-year fluctuations in performance are likely to be re-
duced (AHRQ, 2007).
Data Analysis
Univariate and multivariate regression analyses were
conducted at the hospital level; each PSI outcome was
analyzed separately. Moderate to strong statistically
significant correlations existed among the raw, risk-
adjusted, and smoothed rates for each PSI; therefore, all
analyses were conducted on smoothed PSI outcome
rates as smoothed rates had been reported in similar
studies (Miller et. al., 2005; Thornlow & Stukenborg,
2006). Although we tested its association with patient
outcomes, overall accreditation score was not significant
in either univariate or multivariate regression analyses
and was thus not included in further testing. To com-
plete hypothesis testing, final regression models were
built using variables that were hypothesized to be
significant a priori; variables found to be significantly
associated with patient outcomes in preliminary univar-
iate regression analyses ( p < .05) or in preliminary
multivariate regression analysis ( p < .05) were included
in the final multivariate models.
Findings
Most of the 115 hospitals included in the sample were
classified as urban (n = 78), nonteaching (n = 88), and
not-for-profit (n = 76); almost half were considered large
institutions (n = 56) and approximately 43 hospitals
(37%) were located in the South (Table 1). Study
sample hospitals differed from the 2002 NIS sample in
that the study sample had fewer small hospitals, fewer
rural hospitals, fewer government nonfederal hospitals,
and fewer hospitals located in the Midwest than the
national NIS sample did. No differences in teaching
status existed between the 2002 NIS sample and the
study sample (Table 1). The A-ADC of study hospitals
ranged from 10 to 1,397 patients per day (M = 265.59,
SD = 247.68) with an average nurse ratio of 1.18 RN
full-time equivalents (SD = 0.44). Overall accreditation
scores ranged from 83 to 99 on a scale of 100 (M = 92.3,
SD = 3.68). Hospital risk-adjusted (smoothed) rates for
the patient safety indicators ranged from 1.8 cases of
infection per 1,000 discharges (0.0018) to 9.8 cases of
postoperative respiratory failure per 1,000 elective sur-
gical discharges (0.0098) to 21.5 incidences of decubitus
ulcers per 1,000 discharges (0.0215) to 133.9 cases of
failure to rescue, or deaths, per 1,000 discharges among
patients who developed potentially preventable compli-
cations during their hospital stay (0.1339). These rates
are comparable to 2002 national rates for these indi-
cators (http://hcupnet.ahrq.gov/; Table 2).
Overall, three of the four multivariate models attained
significance. Results are shown for the preliminary
multivariate regression models rather than for the final
multivariate regression models because no appreciable
differences were noted in the strength or direction of
relationships or amount of variance explained between the
preliminary and final multivariate models (Table 3).
Hospital system characteristics and patient safety practices
accounted for 21.9% of the adjusted variance in hospital
rates of infection ( p = .000), 13.0% of the adjusted
variance in hospital rates of postoperative respiratory
failure ( p = .011), and 8.9% of the adjusted variance in
hospital rates of decubitus ulcers ( p = .029). None of the
models significantly explained variance in hospital rates of
failure to rescue ( p = .436).
Hospital system characteristics were not consistently
associated with patient outcomes in either univariate or
multivariate regression analyses (Table 3). Although not
hypothesized to be significant a priori, larger hospitals
Safety Practices and Patient Outcomes 265
9Copyright @ 200 Lippincott Williams & Wilkins.
Unauthorized reproduction of this article is prohibited.
had higher rates of infections due to medical care and
postoperative respiratory failure than did smaller hos-
pitals, but no differences were noted by hospital size in
either failure to rescue or decubitus ulcers. And when
compared with not-for-profit and government nonfed-
eral hospitals, for-profit hospitals exhibited higher rates
of decubitus ulcers and postoperative respiratory fail-
ure, but no differences were noted by ownership for rates
for failure to rescue or infections due to medical care.
No differences in hospital patient safety indicator rates
were noted by teaching status or levels of nurse staf-
fing (Table 3).
Utilization of patient safety practices, as measured by
accreditation standards, was significantly associated with
two of the four patient safety outcomes in both
univariate and multivariate analyses. Hospitals with
poorer performance using the patient safety practice
‘‘assessing patient needs’’ (Subscore 2) had higher rates
of infection due to medical care than did hospitals with
better performance using that practice, and hospitals
with poorer performance using ‘‘care procedures’’ (Sub-
score 3) had higher rates of decubitus ulcers than did
hospitals with better performance using that patient
safety practice. Utilization of patient safety practices was
not associated with hospital rates of postoperative
respiratory failure or failure to rescue in either univariate
or multivariate analyses.
Discussion
In this study, hospital system characteristics did not
consistently explain patient outcomes, echoing previous
findings in which associations varied depending on the
outcome measured (Baker et al., 2002; Romano et al.,
2003; Thornlow & Stukenborg, 2006). In this study, larger
hospitals demonstrated higher rates of adverse events
than smaller hospitals did, but for only two of the four
indicators analyzed: infections due to medical care and
postoperative respiratory failure. Perhaps, increased con-
tact from a larger number of staff increases the probability
of cross-contamination and infection; likewise, the need
for interdisciplinary communication among the many pro-
viders in a large hospital may predispose such institutions
to higher rates of postoperative respiratory failure than in a
Table 1
Comparison of study sample hospitals to NIS sample hospitals
Study hospitals
(sample, n = 115)
National sample
hospitals (NIS,
n = 995)
Difference between
study and
national samples
Hospital characteristics n % n % �2
Hospital teaching status 2.76
Nonteaching 88 76.5 729 82.8
Teaching 27 23.5 151 17.2
Hospital ownership (five categories) 17.34**
Government or private, collapsed 49 42.6 290 33.0
Government, nonfederal (public) 9 7.8 193 21.9
Private, collapsed 27 23.5 168 19.1
Private, not-for-profit 19 16.5 103 11.7
Private, investor owned 11 9.6 126 14.3
Hospital location 8.68**
Rural 37 32.2 411 46.7
Urban 78 67.8 469 53.3
Hospital bed size 22.13***
Small 20 17.4 343 39.0
Medium 39 33.9 255 29.0
Large 56 48.7 282 32.1
Hospital region 9.75*
Northeast 24 20.9 112 12.7
Midwest 22 19.1 262 29.8
South 43 37.4 340 38.6
West 26 22.6 166 18.9
Note. NIS = Nationwide Inpatient Sample.
*Significant at p < .05.
**Significant at p < .01.
***Significant at p < .001.
July–September � 2009266 Health Care Management REVIEW
9Copyright @ 200 Lippincott Williams & Wilkins.
Unauthorized reproduction of this article is prohibited.
Table 2
Descriptive statistics for study sample hospitals (n = 115)
Variable Operational definition Mean SD
2002 National
PSI rate
Nurse staffing Measured as the ratio of RN full-time
equivalents to A-ADC
1.18 0.44 –
A-ADC Hospital size was measured as A-ADC.
A-ADC reflects the average number
of both inpatients and outpatients
treated at the hospital on a daily basis.
265.59 247.68 –
Overall score This score is derived from an assessment
of an organization’s compliance
with all applicable Joint Commission
standards at the time of the full
triennial accreditation survey.
Score is based on a scale of 0 to
100, with 100 representing the
highest score.
92.30 3.68 –
Decubitus ulcer
(n = 115 hospitals)
Decubitus ulcer development
per 1,000 discharges in lengths
of stay of five or more days.
Excludes patients with paralysis,
diseases of the skin, subcutaneous
tissue, and breast. Excludes
obstetrical admissions and
admissions from long-term care.
0.0215 (21.50) 0.01 (23.63)
Failure to rescue
(n = 99 hospitals)
Deaths per 1,000 discharges among
patients who develop potentially
preventable complications during
their hospital stay. Excludes patients
transferred in or out, patients admitted
from long-term care, neonates, and
patients over 74 years.
0.1339 (133.90) 0.02 (129.37)
Selected infections
due to medical
care (n = 115
hospitals)
Rate per 1,000 discharges of infections
due to medical care, primarily those
related to intravenous lines and catheters.
Defined by including cases based on
secondary diagnosis associated with the
same admission. Excludes patients with
potentially immunocompromised states
(e.g., AIDS and cancer).
0.00181 (1.81) 0.00 (1.53)
Postoperative
respiratory failure
(n = 100 hospitals)
Rates of postoperative respiratory failure
per 1,000 elective surgical discharges.
Limits code to secondary diagnoses
to eliminate respiratory failure that
was present on admission. Excludes
patients who have major respiratory
or circulatory disorders. Limits
the population at risk to elective
surgery patients.
0.0098 (9.80) 0.00 (7.97)
Variable Operational definition Median SD Cronbach’s �
Patient safety
practices/
subscores
Subscore 1 (surveillance capacity)
Reassessment procedures
Implementation of patient safety plans �0.2754 1 .510
Orientation, training staff
Assessing staff competency
(continues)
Safety Practices and Patient Outcomes 267
9Copyright @ 200 Lippincott Williams & Wilkins.
Unauthorized reproduction of this article is prohibited.
smaller hospital. Additional research is needed to examine
why larger hospitals demonstrated higher rates for these
patient outcomes.
For-profit hospitals had higher rates of adverse events
than did not-for-profit and nonfederal government
hospitals, but again, for only two of four indicators:
decubitus ulcer and postoperative respiratory failure.
Reasons for these findings are unclear yet support those
of other studies where for-profit hospitals had higher
rates of postoperative pneumonia, pulmonary compro-
mise (Kovner & Gergen, 1998), postoperative respira-
tory failure, and decubitus ulcers (Romano et al., 2003)
than other hospital types did. For-profit and not-for-
profit hospitals may differ in the types of resources used
Table 3
Multivariate regression analysis: relationship of hospital
systems and utilization of
patient safety practices to patient safety outcomes
Standardized � coefficients
Decubitus ulcer
Failure to
rescue
Infection due
to medical care
Postoperative
respiratory failure
Hospital characteristics
Western region .09 .13 .16 .00
Urban location .07 �.01 .04 .11
Hospital size (A-ADC) .17 .17 .30* .36*
Teaching hospital .05 �.11 .08 �.02
For-profit owner .24* .04 .02 .32*
RN staffing (FTE/A-ADC) �.05 �.08 .12 �.16
Patient safety practices
Subscore 1: surveillance capacity .03 .10 �.13 �.09
Subscore 2: assessing patients �.04 .06 .25* .07
Subscore 3: care procedures .27** �.12 �.10 .07
Subscore 4: measuring process .11 .19 �.15 .11
F test 2.12 1.11 4.20 2.48
Model significance .03* .44 .00*** .01*
R2 .17 .10 .29 .22
Adjusted R2 .09 .00 .22 .13
Note. A-ADC = adjusted average daily census; FTE = full-time
equivalent.
*Significant at p < .05.
**Significant at p < .01.
***Significant at p < .001.
Table 2
Continued
Variable Operational definition Median SD Cronbach’s �
Subscore 2 (assessing patient needs)
Initial assessment �0.1212 1 .533
Availability of patient-specific information
Medication use
Subscore 3 (care procedures)
Infection control 0.0611 1 .096
Planning and providing care
Operative procedures
Subscore 4 (measuring processes)
Patient and family education �0.2055 1 .024
Measurement of processes and outcomes
Note. A-ADC = adjusted average daily census; PSI = Patient
Safety Indicator.
July–September � 2009268 Health Care Management REVIEW
9Copyright @ 200 Lippincott Williams & Wilkins.
Unauthorized reproduction of this article is prohibited.
to detect early signs of respiratory distress in postoper-
ative patients, such as pulse oximetry or capnography, or
in the equipment used to prevent pressure sores, such
as specialty beds and/or mattresses. Further study may
illuminate these differences.
Similarly, accreditation standards specific to patient
safety processes did not appear related to all four outcomes
analyzed in this study. Rates of infections and decubitus
ulcers occurred more frequently in hospitals with poorer
performance in utilizing patient safety practices, but no
differences were noted in rates of postoperative respiratory
failure or failure to rescue. One possible explanation
suggests that infections and decubitus ulcers may be more
amenable to the implementation of policies and proce-
dures targeted to prevent their occurrence. Additional
research is needed to determine whether patient safety
practices geared toward the more complicated problems,
failure to rescue and postoperative respiratory failure, are
equally as effective in reducing these events.
Our measurement approach constitutes only one way
of conceptualizing patient safety practices and assumes
that such practices can be measured by JC accreditation
standards. In reality, these standards may not measure
those practices and procedures that are most important
for ensuring safe patient care. That we found associations
for only two of the four indicators and that previous stud-
ies reported no association between JC survey assessments
and other measures of quality and patient outcomes
(Chen, Rathore, Radford, & Krumholz, 2003; Miller
et al., 2005) suggest the limitation in this approach. It
may be that variables crafted to measure nursing sur-
veillance, critical thinking, leadership, communication,
and collaboration would more effectively gauge the ef-
fects of patient safety practices, especially for the more
complicated outcomes failure to rescue and postoperative
respiratory failure. Research examining the relationship
of these patient safety attributes to adverse events is war-
ranted and, if found to be significant, suggests the possible
need to modify accreditation standards.
Certain limitations exist in this study, including that
most administrative data used for secondary analysis
consist of data initially collected for other purposes
(Zhan & Miller, 2003) and may thus carry potential bias
in detecting certain types of patient safety events due
to ICD-9-CM coding limitations. Additional concerns
exist when calculating severity of illness (Lawthers et al.,
2000; Zhan & Miller, 2003); however, the AHRQ
Comorbidity Method, which was used in this study
to risk adjust patient characteristics, was formulated to
be used in conjunction with the PSI software and
is designed to be used with administrative data
(Elixhauser, Steiner, Harris, & Coffey, 1998). As noted
earlier, the hospitals in this study are smaller, less rural,
less likely to be government or nonfederal hospitals, and
less likely to be located in the Midwest than are
hospitals in the national sample. These differences
probably related to the need to match medical–surgical
hospitals in the 2002 NIS database with hospitals that
were surveyed by the JC in 2002. It has been reported
that smaller and more rural hospitals are less likely to
participate in JC surveys (Miller et al., 2005). The factor
analysis was effective in reducing the number of
accreditation items determined to be most relevant to
patient safety by the external panelists; however, the
low reliability coefficients for Subscores 3 and 4 may
indicate low intercorrelation among factored items
(Table 2). The significant influence of Subscore 3 on
decubitus ulcers was likely due to one item, ‘‘planning
and providing patient care,’’ which was the only item
that attained significance when the three individual
items replaced the aggregate factor score in post hoc
regression analysis. When individual items, rather than
aggregate scores, were included in post hoc regression
models, these items continued to demonstrate nonsig-
nificant relationships with outcomes.
Practice Implications
The relationship between the utilization of patient safety
practices and patient outcomes has not been well studied,
which makes it difficult for hospitals to identify mod-
ifications needed to improve patient outcomes. Our find-
ings suggest that certain adverse events, such as infections
and decubitus ulcers, may be reduced by preventive
protocols that are reflected in accreditation standards,
whereas other events, such as failure to rescue and
postoperative respiratory failure, may require multifaceted
strategies that are less easily translated into protocols. To
illustrate, research has shown that decubitus ulcers can be
prevented or treated successfully when evidence-based
care, such as identifying patients at risk and reducing
pressure over bony prominences, is provided (Armstrong
& Bortz, 2001; Cullum, McInnes, & Bell-Syer, 2004;
Frantz, 2004; Lyder, 2003). Employing procedures such as
the Guidelines for the Prevention and Treatment of Pressure
Ulcers (Wound, Ostomy, Continence Nursing, 2003) in
acute care hospitals is crucial because length of stay is
almost twice as long for the patients who develop pressure
ulcers as compared with patients who are at risk but do not
develop pressures ulcers (Loan, Jennings, Brosch, Depaul,
& Hildreth, 2003). Decubitus ulcers are significant in-
dependent predictors of hospital costs, with the estimated
cost of managing a single full-thickness pressure ulcer
as high as $70,000 and the total cost for treatment
of pressure ulcers in the United States estimated at
$11 billion per year (Reddy, Gill, & Rochon, 2006;
Redelings, Lee, & Sorvillo, 2005).
Similarly, policies and procedures such as the Guide-
lines for the Prevention of Intravascular Catheter-Related In-
fections (O’Grady et. al., 2002) have been found effective
Safety Practices and Patient Outcomes 269
9Copyright @ 200 Lippincott Williams & Wilkins.
Unauthorized reproduction of this article is prohibited.
in reducing catheter-related bloodstream infection rates
(Behrenholtz, Pronovost, & Lipsett, 2004; Theaker,
2005). However, despite evidence that guidelines are
effective, researchers have repeatedly demonstrated prob-
lems with health care workers’ compliance to infection
control policies and procedures, including compliance to
hand hygiene measures (Larson, Albrecht, & O’Keefe,
2005; McKinley et al., 2005; Peterson & Walker, 2006).
As many as 250,000 hospital-acquired venous catheter-
related bloodstream infections occur annually in the
United States, and treatment cost averages as much
as $56,000 (O’Grady et al., 2002). Hospital-acquired in-
fections not only increase costs but also increase mor-
bidity, extend hospital stays, and are associated with
significant increases in in-hospital mortality (Coffin &
Zaoutis, 2005).
In this study, hospitals using fewer patient safety
practices demonstrated higher rates of infection and
decubitus ulcers, suggesting that requisite policies and
procedures were not followed. Applying evidence-based
guidelines provides an efficient and cost-effective
method for preventing these types of adverse events.
Alternatively, failure to rescue and postoperative re-
spiratory failure may reflect situations that require mul-
tifaceted approaches that are less easily translated into
protocols. Recently, however, hospitals have begun to
institute practices such as rapid response teams that are
designed to assist bedside staff to intervene upon early
signs of patient deterioration. This study preceded the
large-scale implementation of such protocols yet high-
lights the importance of applying patient safety practices
to prevent the occurrence of adverse events.
The AHRQ quality and patient safety indicators have
been identified as possible sources for expanded com-
parative public reporting. Our measurement approach
represents a potential method for assessing patient safety
practices, using accreditation standards, and associating
these practices with patient outcomes. Hospitals can
employ a similar approach by running the AHRQ PSI
software on their own inpatient discharge billing data to
screen for potentially preventable adverse events and
never events; to identify opportunities for improvement
that may justify review of practices, policies, or procedures
designed to prevent occurrence; and to benchmark their
hospital rates to the national rates posted on the AHRQ
Web site (http://hcupnet.ahrq.gov).
Rates are also categorized by hospital type so that
administrators can ascertain whether their hospital’s
characteristics (e.g., ownership status and hospital size)
may have influenced their adverse event rates. Such rate
comparisons allow for introspection so that preventive
measures, such as pressure relieving devices, improved
infection control procedures, and interdisciplinary com-
munication tools, can be instituted and evaluated for
their impact on patient safety.
Conclusion
This study examined the association between hospital
characteristics and the use of patient safety practices on
patient outcomes. We found that certain hospital charac-
teristics were significantly associated with some patient
outcomes, but not others, and accreditation standards
specific to patient safety practices did not appear related to
all four outcomes studied. Certain adverse events, such as
infections and decubitus ulcers, may be reduced through
preventive procedures, whereas other events, such as failure
to rescue and postoperative respiratory failure, may reflect
situations that require multifaceted strategies that are less
easily translated into protocols or less easily measured
by accreditation standards.
This study provides a useful reflection on the challenge
of determining relationships between organizational
characteristics and patient outcomes and highlights the
need for additional inquiry regarding appropriate mea-
surement of acute care processes, especially patient safety
practices. Our measurement approach may have influ-
enced the observed associations between protective safety
practices and patient outcomes; however, it represents
progress toward examining this relationship. With the
continual addition of patient safety-related standards and
National Patient Safety Goals into the JC accreditation
process, more research is needed to determine whether
these practices have impacted patient outcomes. Such
research has the potential to be not only cost saving due to
changes in reimbursement but also life saving for
hospitalized patients.
Acknowledgments
The authors wish to thank other members of the dis-
sertation committee, including Patricia Hollen, PhD,
RN, FAAN; Arlene Keeling, PhD, RN; and William
Knaus, MD. Special thanks to Ruth Anderson, PhD,
RN, FAAN, who reviewed this manuscript.
References
Agency for Healthcare Research and Quality. (2007). Quality
indicators: Guide to patient safety indicators. Rockville, MD:
Agency for Healthcare Research and Quality. Retrieved
October 10, 2007, from http://www.qualityindicators.ahrq.
gov/psioverview
Agency for Healthcare Research and Quality. (2008). Overview
of the Nationwide Inpatient Sample (NIS). Retrieved September
13, 2008, from http://www.hcup.ahrq.gov/nisoverview
Aiken, L., Clarke, S., Sloane, D., Sochalski, J., & Silber, J.
(2002). Hospital nurse staffing and patient mortality, nurse
burnout, and job dissatisfaction. JAMA, 288, 1987–1993.
Armstrong, D., & Bortz, P. (2001). An integrative review of
pressure relief in surgical patients. AORN Journal, 73(3),
645–648.
Ayanian, J. Z., & Weissman, J. S. (2002). Teaching hospitals
July–September � 2009270 Health Care Management REVIEW
9Copyright @ 200 Lippincott Williams & Wilkins.
Unauthorized reproduction of this article is prohibited.
and quality of care: A review of the literature. Milbank
Quarterly, 80(3), 569–593.
Baker, C. M., Messmer, P. L., Gyurko, C. C., Domagala, S. E.,
Conly, F. M., Eads, T. S., et al. (2002). Hospital owner-
ship, performance, and outcomes: Assessing the state-
of-the-science. Journal of Nursing Administration, 30(5),
227–240.
Behrenholtz, S., Pronovost, P., & Lipsett, P. (2004).
Eliminating
catheter-related blood stream infections in the intensive care
unit. Critical Care Medicine, 32(10), 2014–2020.
Blegen, M., Goode, C., & Reed, L. (1998). Nurse staffing and
patient outcomes. Nursing Research, 47(1), 43–50.
Centers for Medicare and Medicaid Services. (2007). HHS
reports to Congress on Value-Based Purchasing of Hospital
Services by Medicare. Retrieved November 2007, from
http://www.hhs.gov.news/press/2007/11/pr20071126a
Chen, J., Rathore, S. S., Radford, M. J., & Krumholz, H. M.
(2003). JCAHO accreditation and quality of care for acute
myocardial infarction. Health Affairs, 22(2), 243–254.
Coffin, S., & Zaoutis, T. E. (2005). Infection control, epi-
demiology, and patient safety. Infectious Disease Clinics of
North America, 19, 647–665.
Comrey, A. L., & Lee, H. B. (1992). A first course in factor
analysis. (2nd ed.). Hillsdale, NJ: Lawrence Erlbaum Asso-
ciates Publishers.
Cullum, N., McInnes, E., & Bell-Syer, S. E. M. (2004).
Support surfaces for pressure ulcer prevention. Update of
Cochrane Database of Systematic Reviews 2004(3):CD001735.
Danks, L. A. (2006). Central venous catheters: A review of
skin cleansing and dressings. British Journal of Nursing,
15(12), 650–654.
Devereaux, P. J., Choi, P., Lachetti, C., Weaver, B.,
Schunemann, H., Haines, T., et al. (2002). A systematic
review and meta-analysis of studies comparing mortality
rates of private for-profit and private not-for profit
hospitals. Canadian Medical Association Journal, 166,
1399–1406.
Donabedian, A. (1966). Evaluating the quality of medical care.
Milbank Memorial Fund Quarterly, 44(3, Suppl. 1), 66–206.
Elixhauser, A., Steiner, C., Harris, D. R., & Coffey, R. M.
(1998). Comorbidity measures for use with administrative
data. Medical Care, 36(1), 8–27.
Fleury, J. (1998). The index of self-regulation; Development
and psychometric analysis. Journal of Nursing Measurement,
6(1), 3–17.
Frantz, R. A. (2004). Evidence-based protocol: Prevention of
pressure ulcers. Journal of Gerontological Nursing, 30(2), 4–11.
Gastmeier, P., & Geffers, C. (2006). Prevention of catheter-
related bloodstream infections: Analysis of studies pub-
lished between 2002 and 2005. Journal of Hospital Infection,
64(4), 326–335.
Joint Commission on Accreditation of Healthcare Organiza-
tions. (2003). Facts about patient safety. Retrieved August
18, 2004, from http://www.jcaho.org
Kizer, K. W., & Blum, L. N. (2005). Safe practices for better
health care. In Advances in patient safety: From research to
implementation. Volumes 1–4 (AHRQ Publication No.
050021; 1–4). Rockville, MD: Agency for Healthcare
Research and Quality.
Kovner, C., & Gergen, P. J. (1998). Nurse staffing levels and
adverse events following surgery in U.S. hospitals. Image:
Journal of Nursing Scholarship, 30(4), 315–321.
Kupersmith, J. (2005). Quality of care in teaching hospitals: A
literature review. Academic Medicine, 80(5), 458–466.
Larson, E. L., Albrecht, S., & O’Keefe, M. (2005). Hand
hygiene behavior in a pediatric emergency department and
a pediatric intensive care unit: Comparison of use of 2
dispenser systems. American Journal of Critical Care, 14(4),
304–312.
Lawthers, A., McCarthy, E., Davis, R., Peterson, L., Palmer, H.,
& Iezzoni, L. I. (2000). Identification of in-hospital com-
plications from claims data: Is it valid? Medical Care, 38(8),
785–795.
Leape, L., Berwick, D., & Bates, D. (2002). What practices will
most improve safety? JAMA, 288(4), 501–507.
Lehman, L., Puopolo, A., Shaykevich, S., & Brennan, T. (2005).
Iatrogenic events resulting in intensive care admission:
Frequency, cause, and disclosure to patients and institutions.
American Journal of Medicine, 118, 409–413.
Lichting, L. K., Knauf, R., & Milholland, D. K. (1999). Some
impacts of nursing on acute care hospital outcomes. Journal
of Nursing Administration, 29(2), 25–33.
Loan, L. A., Jennings, B. M., Brosch, L. R., Depaul, D., &
Hildreth,
P. (2003). Indicators of nursing care quality: Findings from a
pilot study. Outcomes Management, 7(2), 51–58
Lyder, C. H. (2003). Pressure ulcer prevention and manage-
ment. JAMA, 289(2), 223–226.
Mayberry, L. J., & Gennarro, S. (2001). A quality of health
outcomes model for guiding obstetrical practice. Journal of
Nursing Scholarship, 33, 141–146.
McKinley, R., Gillepsie, W., Kraus, J., Harrison, S., Medeiros,
R., Hawkins, et al. (2005). Focus group data as a tool in
assessing effectiveness of a hand hygiene campaign.
American Journal of Infection Control, 33(6), 368–373.
Miller, M. R., Pronovost, P., Donithan, M., Zeger, S., Zhan, C.,
Morlock, L., et al. (2005). Relationship between performance
measurement and accreditation: Implications for quality of
care and patient safety. American Journal of Medical Quality,
20(5), 239–252.
Mitchell, P., Ferketich, S., & Jennings, B. (1998). Quality
Health Outcomes Model: American Academy of Nursing
Expert Panel on Quality Health Care. Journal of Nursing
Scholarship, 30, 43–46.
Needleman, J., Buerhaus, P., Mattke, S., Stewart, M., &
Zelevinsky, K. (2002). Nurse-staffing levels and the quality
of care in hospitals. New England Journal of Medicine, 346,
1715–1722.
Nordgren, L. D., Johnson, T., Kirschbaum, M., & Peterson, M.
L.
(2004). Medical errors: Excess hospital costs and lengths of
stay. Journal for Healthcare Quality, 26(2), 42–48.
O’Grady, N. P., Alexander, M., Dellinger, P., Gerberding, J.,
Heard, S., Maki, D., et al. (2002). Guidelines for the pre-
vention of intravascular catheter-related infections. Infection
Control and Hospital Epidemiology, 23(12), 759–769.
Peterson, A. M., & Walker, P. H. (2006). Hospital-acquired
infections as patient safety indicators. Annual Review of
Nursing Research, 24, 75–99.
Polit, D. F., Beck, C. T., & Owen, S. V. (2007). Is the CVI an
acceptable indicator of content validity? Appraisal and
recommendations. Research in Nursing and Health, 30(4),
459–467.
Radwin, L., & Fawcett, J. (2002). A conceptual model-based
program of nursing research: Retrospective and prospective
applications. Journal of Advanced Nursing, 40, 355–360.
Safety Practices and Patient Outcomes 271
9Copyright @ 200 Lippincott Williams & Wilkins.
Unauthorized reproduction of this article is prohibited.
Reddy, M., Gill, S. S., & Rochon, P. A. (2006). Preventing
pressure ulcers: A systematic review. JAMA, 296, 974–984.
Redelings, M. D., Lee, N. E., & Sorvillo, F. (2005). Pressure
ulcers: More lethal than we thought? Advances in Skin &
Wound Care, 18(7), 367–372.
Rojas, M., Silver, A., Llewellyn, C., & Rances, L. (2005). Study
of adverse occurrences and major functional impairment
following surgery. In Advances in patient safety: From research
to implementation. Volumes 1–4 (AHRQ Publication No.
050021; 1–4). Rockville, MD: Agency for Healthcare
Research and Quality.
Romano, P. S., Geppert, J. J., Davies, S., Miller, M. R.,
Elixhauser, A., & McDonald, K. M. (2003). A national
profile of patient safety in US hospitals. Health Affairs,
22(2), 154–165.
Shojania, K., Duncan, B., McDonald, K., & Wachter, R.
(2002). Safe but sound: Patient safety meets evidence-
based medicine. JAMA, 288(4), 508–513.
Sin, M., Belza, B., LoGerfo, J., & Cunningham, S. (2005). Eval-
uation of a community-based exercise program for elderly
Korean immigrants. Public Health Nursing, 22(5), 407–413.
Stanton, M. (2004). Hospital nurse staffing and quality of
care (Research in Action Issue 14. AHRQ Publication
No. 04-0029). Rockville, MD: Agency for Healthcare
Research and Quality.
Tabachnick, B. G., & Fidell, L. S. (2001). Using multivariate
statistics (4th ed.). Boston, MA: Allyn & Bacon.
Theaker, C. (2005). Infection control issues in central venous
catheter care. Intensive & Critical Care Nursing, 21(2), 99–109.
Thomas, E., Studdert, D., Burstin, H., Orav, E., Zeena, T.,
Williams, E., et al. (2000). Incidence and types of adverse
events and negligent care in Utah and Colorado. Medical
Care, 38(3), 261–271.
Thornlow, D. (2008). Relationship of patient safety practices to
patient outcomes. Saarbrucken, Germany: VDM Publishing.
Thornlow, D. K., & Stukenborg, G. J. (2006). The association
between hospital characteristics and rates of preventable com-
plications and adverse events. Medical Care, 44(3), 265–269.
Unruh, L. (2003). Licensed nurse staffing and adverse events
in hospitals. Medical Care, 41(1), 142–152.
Wound, Ostomy, Continence Nursing (WOCN). (2003).
Guidelines for the prevention and treatment of pressure ulcers.
Retrieved April 1, 2005, from www.wocn.org
Zhan, C., & Miller, M. (2003). Administrative data based
patient safety research: A critical review. Quality and Safety
in Health Care, 12(Suppl. 2), ii58–ii63.
July–September � 2009272 Health Care Management REVIEW
9Copyright @ 200 Lippincott Williams & Wilkins.
Unauthorized reproduction of this article is prohibited.

More Related Content

Similar to Professional Case Management Vol. 19 , No. 6 , 255 - 262.docx

JONAVolume 41, Number 5, pp 204-210Copyright B 2011 Wolter
JONAVolume 41, Number 5, pp 204-210Copyright B 2011 WolterJONAVolume 41, Number 5, pp 204-210Copyright B 2011 Wolter
JONAVolume 41, Number 5, pp 204-210Copyright B 2011 WolterMerrileeDelvalle969
 
NRS 493 Grand Canyon University Improving Patients Quality Discussion.pdf
NRS 493 Grand Canyon University Improving Patients Quality Discussion.pdfNRS 493 Grand Canyon University Improving Patients Quality Discussion.pdf
NRS 493 Grand Canyon University Improving Patients Quality Discussion.pdfbkbk37
 
Medical home Navy
Medical home Navy Medical home Navy
Medical home Navy Paul Grundy
 
System of Transition of Care Part 2 Paper.pdf
System of Transition of Care Part 2 Paper.pdfSystem of Transition of Care Part 2 Paper.pdf
System of Transition of Care Part 2 Paper.pdfsdfghj21
 
Sat_0955am_Breaking_It_Down_Building_It_Up_Hudson_Reiboldt.pptx
Sat_0955am_Breaking_It_Down_Building_It_Up_Hudson_Reiboldt.pptxSat_0955am_Breaking_It_Down_Building_It_Up_Hudson_Reiboldt.pptx
Sat_0955am_Breaking_It_Down_Building_It_Up_Hudson_Reiboldt.pptxAhsanCarpenter
 
Impact Of Improved Documentation On An Academic Neurosurgical Practice
Impact Of Improved Documentation On An Academic Neurosurgical PracticeImpact Of Improved Documentation On An Academic Neurosurgical Practice
Impact Of Improved Documentation On An Academic Neurosurgical PracticeAntoinette Williams
 
4508 Final Quality Project Part 2 Clinical Quality Measur.docx
4508 Final Quality Project Part 2 Clinical Quality Measur.docx4508 Final Quality Project Part 2 Clinical Quality Measur.docx
4508 Final Quality Project Part 2 Clinical Quality Measur.docxblondellchancy
 
4508 Final Quality Project Part 2 Clinical Quality Measur
4508 Final Quality Project Part 2 Clinical Quality Measur4508 Final Quality Project Part 2 Clinical Quality Measur
4508 Final Quality Project Part 2 Clinical Quality Measurromeliadoan
 
NCQA_Future Vision for Medicare Value-Based Payments Final
NCQA_Future Vision for Medicare Value-Based Payments FinalNCQA_Future Vision for Medicare Value-Based Payments Final
NCQA_Future Vision for Medicare Value-Based Payments FinalTony Fanelli
 
Partial and Incremental PCMH Practice Transformation: Implications for Qualit...
Partial and Incremental PCMH Practice Transformation: Implications for Qualit...Partial and Incremental PCMH Practice Transformation: Implications for Qualit...
Partial and Incremental PCMH Practice Transformation: Implications for Qualit...Paul Grundy
 
Hospital-Physician Clinical Integration
Hospital-Physician Clinical IntegrationHospital-Physician Clinical Integration
Hospital-Physician Clinical Integrationjhdgroup
 
The Physician Value Index. A Tool for Effective Physician Integration.
The Physician Value Index. A Tool for Effective Physician Integration. The Physician Value Index. A Tool for Effective Physician Integration.
The Physician Value Index. A Tool for Effective Physician Integration. pscisolutions
 
Drhatemelbitar (1)MEDICAL CASE MANAGEMENTد حاتم البيطار
Drhatemelbitar (1)MEDICAL CASE MANAGEMENTد حاتم البيطارDrhatemelbitar (1)MEDICAL CASE MANAGEMENTد حاتم البيطار
Drhatemelbitar (1)MEDICAL CASE MANAGEMENTد حاتم البيطارد حاتم البيطار
 
Improve Nursing Performance and Staff Engagement using the CLIPSE Model April...
Improve Nursing Performance and Staff Engagement using the CLIPSE Model April...Improve Nursing Performance and Staff Engagement using the CLIPSE Model April...
Improve Nursing Performance and Staff Engagement using the CLIPSE Model April...iCareQuality.us
 
and Quality for APNs Essay Example Paper.docx
and Quality for APNs Essay Example Paper.docxand Quality for APNs Essay Example Paper.docx
and Quality for APNs Essay Example Paper.docx4934bk
 
Implementing Fixed Patient For Nurse Ratios
Implementing Fixed Patient For Nurse RatiosImplementing Fixed Patient For Nurse Ratios
Implementing Fixed Patient For Nurse RatiosTanya Williams
 

Similar to Professional Case Management Vol. 19 , No. 6 , 255 - 262.docx (20)

JONAVolume 41, Number 5, pp 204-210Copyright B 2011 Wolter
JONAVolume 41, Number 5, pp 204-210Copyright B 2011 WolterJONAVolume 41, Number 5, pp 204-210Copyright B 2011 Wolter
JONAVolume 41, Number 5, pp 204-210Copyright B 2011 Wolter
 
NRS 493 Grand Canyon University Improving Patients Quality Discussion.pdf
NRS 493 Grand Canyon University Improving Patients Quality Discussion.pdfNRS 493 Grand Canyon University Improving Patients Quality Discussion.pdf
NRS 493 Grand Canyon University Improving Patients Quality Discussion.pdf
 
Medical home Navy
Medical home Navy Medical home Navy
Medical home Navy
 
SOPWhitePaperandCrosswalk_final
SOPWhitePaperandCrosswalk_finalSOPWhitePaperandCrosswalk_final
SOPWhitePaperandCrosswalk_final
 
System of Transition of Care Part 2 Paper.pdf
System of Transition of Care Part 2 Paper.pdfSystem of Transition of Care Part 2 Paper.pdf
System of Transition of Care Part 2 Paper.pdf
 
Sat_0955am_Breaking_It_Down_Building_It_Up_Hudson_Reiboldt.pptx
Sat_0955am_Breaking_It_Down_Building_It_Up_Hudson_Reiboldt.pptxSat_0955am_Breaking_It_Down_Building_It_Up_Hudson_Reiboldt.pptx
Sat_0955am_Breaking_It_Down_Building_It_Up_Hudson_Reiboldt.pptx
 
Impact Of Improved Documentation On An Academic Neurosurgical Practice
Impact Of Improved Documentation On An Academic Neurosurgical PracticeImpact Of Improved Documentation On An Academic Neurosurgical Practice
Impact Of Improved Documentation On An Academic Neurosurgical Practice
 
UMC's Journey to a Strong Value Proposition
UMC's Journey to a Strong Value PropositionUMC's Journey to a Strong Value Proposition
UMC's Journey to a Strong Value Proposition
 
4508 Final Quality Project Part 2 Clinical Quality Measur.docx
4508 Final Quality Project Part 2 Clinical Quality Measur.docx4508 Final Quality Project Part 2 Clinical Quality Measur.docx
4508 Final Quality Project Part 2 Clinical Quality Measur.docx
 
4508 Final Quality Project Part 2 Clinical Quality Measur
4508 Final Quality Project Part 2 Clinical Quality Measur4508 Final Quality Project Part 2 Clinical Quality Measur
4508 Final Quality Project Part 2 Clinical Quality Measur
 
Merger 4
Merger 4Merger 4
Merger 4
 
NCQA_Future Vision for Medicare Value-Based Payments Final
NCQA_Future Vision for Medicare Value-Based Payments FinalNCQA_Future Vision for Medicare Value-Based Payments Final
NCQA_Future Vision for Medicare Value-Based Payments Final
 
Partial and Incremental PCMH Practice Transformation: Implications for Qualit...
Partial and Incremental PCMH Practice Transformation: Implications for Qualit...Partial and Incremental PCMH Practice Transformation: Implications for Qualit...
Partial and Incremental PCMH Practice Transformation: Implications for Qualit...
 
Hospital-Physician Clinical Integration
Hospital-Physician Clinical IntegrationHospital-Physician Clinical Integration
Hospital-Physician Clinical Integration
 
The Physician Value Index. A Tool for Effective Physician Integration.
The Physician Value Index. A Tool for Effective Physician Integration. The Physician Value Index. A Tool for Effective Physician Integration.
The Physician Value Index. A Tool for Effective Physician Integration.
 
Drhatemelbitar (1)MEDICAL CASE MANAGEMENTد حاتم البيطار
Drhatemelbitar (1)MEDICAL CASE MANAGEMENTد حاتم البيطارDrhatemelbitar (1)MEDICAL CASE MANAGEMENTد حاتم البيطار
Drhatemelbitar (1)MEDICAL CASE MANAGEMENTد حاتم البيطار
 
Improve Nursing Performance and Staff Engagement using the CLIPSE Model April...
Improve Nursing Performance and Staff Engagement using the CLIPSE Model April...Improve Nursing Performance and Staff Engagement using the CLIPSE Model April...
Improve Nursing Performance and Staff Engagement using the CLIPSE Model April...
 
and Quality for APNs Essay Example Paper.docx
and Quality for APNs Essay Example Paper.docxand Quality for APNs Essay Example Paper.docx
and Quality for APNs Essay Example Paper.docx
 
Implementing Fixed Patient For Nurse Ratios
Implementing Fixed Patient For Nurse RatiosImplementing Fixed Patient For Nurse Ratios
Implementing Fixed Patient For Nurse Ratios
 
Healthcare Transformation 021115
Healthcare Transformation 021115Healthcare Transformation 021115
Healthcare Transformation 021115
 

More from MARRY7

Part 1.....InstructionsSelect one of the age groups disc.docx
Part 1.....InstructionsSelect one of the age groups disc.docxPart 1.....InstructionsSelect one of the age groups disc.docx
Part 1.....InstructionsSelect one of the age groups disc.docxMARRY7
 
Part 1 – Add to Website PlanList at least three .docx
Part 1 – Add to Website PlanList at least three .docxPart 1 – Add to Website PlanList at least three .docx
Part 1 – Add to Website PlanList at least three .docxMARRY7
 
Part 1 True or False Questions. (10 questions at 1 point each).docx
Part 1 True or False Questions. (10 questions at 1 point each).docxPart 1 True or False Questions. (10 questions at 1 point each).docx
Part 1 True or False Questions. (10 questions at 1 point each).docxMARRY7
 
Part 11. Why is it so important in system engineering to become .docx
Part 11. Why is it so important in system engineering to become .docxPart 11. Why is it so important in system engineering to become .docx
Part 11. Why is it so important in system engineering to become .docxMARRY7
 
Part 1 Using the internet, search for commercial IDPS systems. What.docx
Part 1 Using the internet, search for commercial IDPS systems. What.docxPart 1 Using the internet, search for commercial IDPS systems. What.docx
Part 1 Using the internet, search for commercial IDPS systems. What.docxMARRY7
 
Part 1- Create an outline of the assignment below thenPart 2-1000 .docx
Part 1- Create an outline of the assignment below thenPart 2-1000 .docxPart 1- Create an outline of the assignment below thenPart 2-1000 .docx
Part 1- Create an outline of the assignment below thenPart 2-1000 .docxMARRY7
 
Part 1 Review QuestionsWhat is the difference between criminal la.docx
Part 1 Review QuestionsWhat is the difference between criminal la.docxPart 1 Review QuestionsWhat is the difference between criminal la.docx
Part 1 Review QuestionsWhat is the difference between criminal la.docxMARRY7
 
Part 1 Review QuestionsWhat is the difference between authenticat.docx
Part 1 Review QuestionsWhat is the difference between authenticat.docxPart 1 Review QuestionsWhat is the difference between authenticat.docx
Part 1 Review QuestionsWhat is the difference between authenticat.docxMARRY7
 
Part 1 SQLDatabase workScenarioDevelopment of a relationa.docx
Part 1 SQLDatabase workScenarioDevelopment of a relationa.docxPart 1 SQLDatabase workScenarioDevelopment of a relationa.docx
Part 1 SQLDatabase workScenarioDevelopment of a relationa.docxMARRY7
 
Part 1 Review QuestionsWhat functions constitute a complete infor.docx
Part 1 Review QuestionsWhat functions constitute a complete infor.docxPart 1 Review QuestionsWhat functions constitute a complete infor.docx
Part 1 Review QuestionsWhat functions constitute a complete infor.docxMARRY7
 
Part 1A persons lifestyle has a significant influence on the p.docx
Part 1A persons lifestyle has a significant influence on the p.docxPart 1A persons lifestyle has a significant influence on the p.docx
Part 1A persons lifestyle has a significant influence on the p.docxMARRY7
 
Part 1 Review QuestionsWhat is the definition of information secu.docx
Part 1 Review QuestionsWhat is the definition of information secu.docxPart 1 Review QuestionsWhat is the definition of information secu.docx
Part 1 Review QuestionsWhat is the definition of information secu.docxMARRY7
 
Part 1 Review QuestionsWhat is a security modelWhat are the es.docx
Part 1 Review QuestionsWhat is a security modelWhat are the es.docxPart 1 Review QuestionsWhat is a security modelWhat are the es.docx
Part 1 Review QuestionsWhat is a security modelWhat are the es.docxMARRY7
 
Part 1 Listed below are several key Supreme Court decisions that .docx
Part 1 Listed below are several key Supreme Court decisions that .docxPart 1 Listed below are several key Supreme Court decisions that .docx
Part 1 Listed below are several key Supreme Court decisions that .docxMARRY7
 
Part 1 Infrastructure DesignCreate an 8–10-page infrastructur.docx
Part 1 Infrastructure DesignCreate an 8–10-page infrastructur.docxPart 1 Infrastructure DesignCreate an 8–10-page infrastructur.docx
Part 1 Infrastructure DesignCreate an 8–10-page infrastructur.docxMARRY7
 
part 1 I attended an international conference on Biotechnology and .docx
part 1 I attended an international conference on Biotechnology and .docxpart 1 I attended an international conference on Biotechnology and .docx
part 1 I attended an international conference on Biotechnology and .docxMARRY7
 
Part 1 Chapter 7 Summary plus end of chapter discussion of Alfred.docx
Part 1 Chapter 7 Summary plus end of chapter discussion of Alfred.docxPart 1 Chapter 7 Summary plus end of chapter discussion of Alfred.docx
Part 1 Chapter 7 Summary plus end of chapter discussion of Alfred.docxMARRY7
 
Parent Involvement Plan This week you will create a Parent Involve.docx
Parent Involvement Plan This week you will create a Parent Involve.docxParent Involvement Plan This week you will create a Parent Involve.docx
Parent Involvement Plan This week you will create a Parent Involve.docxMARRY7
 
Parenting Practices Over GenerationsGeneration 1 Years children.docx
Parenting Practices Over GenerationsGeneration 1 Years children.docxParenting Practices Over GenerationsGeneration 1 Years children.docx
Parenting Practices Over GenerationsGeneration 1 Years children.docxMARRY7
 
ParamsThe interface must be pleasing to look at (a basic form wit.docx
ParamsThe interface must be pleasing to look at (a basic form wit.docxParamsThe interface must be pleasing to look at (a basic form wit.docx
ParamsThe interface must be pleasing to look at (a basic form wit.docxMARRY7
 

More from MARRY7 (20)

Part 1.....InstructionsSelect one of the age groups disc.docx
Part 1.....InstructionsSelect one of the age groups disc.docxPart 1.....InstructionsSelect one of the age groups disc.docx
Part 1.....InstructionsSelect one of the age groups disc.docx
 
Part 1 – Add to Website PlanList at least three .docx
Part 1 – Add to Website PlanList at least three .docxPart 1 – Add to Website PlanList at least three .docx
Part 1 – Add to Website PlanList at least three .docx
 
Part 1 True or False Questions. (10 questions at 1 point each).docx
Part 1 True or False Questions. (10 questions at 1 point each).docxPart 1 True or False Questions. (10 questions at 1 point each).docx
Part 1 True or False Questions. (10 questions at 1 point each).docx
 
Part 11. Why is it so important in system engineering to become .docx
Part 11. Why is it so important in system engineering to become .docxPart 11. Why is it so important in system engineering to become .docx
Part 11. Why is it so important in system engineering to become .docx
 
Part 1 Using the internet, search for commercial IDPS systems. What.docx
Part 1 Using the internet, search for commercial IDPS systems. What.docxPart 1 Using the internet, search for commercial IDPS systems. What.docx
Part 1 Using the internet, search for commercial IDPS systems. What.docx
 
Part 1- Create an outline of the assignment below thenPart 2-1000 .docx
Part 1- Create an outline of the assignment below thenPart 2-1000 .docxPart 1- Create an outline of the assignment below thenPart 2-1000 .docx
Part 1- Create an outline of the assignment below thenPart 2-1000 .docx
 
Part 1 Review QuestionsWhat is the difference between criminal la.docx
Part 1 Review QuestionsWhat is the difference between criminal la.docxPart 1 Review QuestionsWhat is the difference between criminal la.docx
Part 1 Review QuestionsWhat is the difference between criminal la.docx
 
Part 1 Review QuestionsWhat is the difference between authenticat.docx
Part 1 Review QuestionsWhat is the difference between authenticat.docxPart 1 Review QuestionsWhat is the difference between authenticat.docx
Part 1 Review QuestionsWhat is the difference between authenticat.docx
 
Part 1 SQLDatabase workScenarioDevelopment of a relationa.docx
Part 1 SQLDatabase workScenarioDevelopment of a relationa.docxPart 1 SQLDatabase workScenarioDevelopment of a relationa.docx
Part 1 SQLDatabase workScenarioDevelopment of a relationa.docx
 
Part 1 Review QuestionsWhat functions constitute a complete infor.docx
Part 1 Review QuestionsWhat functions constitute a complete infor.docxPart 1 Review QuestionsWhat functions constitute a complete infor.docx
Part 1 Review QuestionsWhat functions constitute a complete infor.docx
 
Part 1A persons lifestyle has a significant influence on the p.docx
Part 1A persons lifestyle has a significant influence on the p.docxPart 1A persons lifestyle has a significant influence on the p.docx
Part 1A persons lifestyle has a significant influence on the p.docx
 
Part 1 Review QuestionsWhat is the definition of information secu.docx
Part 1 Review QuestionsWhat is the definition of information secu.docxPart 1 Review QuestionsWhat is the definition of information secu.docx
Part 1 Review QuestionsWhat is the definition of information secu.docx
 
Part 1 Review QuestionsWhat is a security modelWhat are the es.docx
Part 1 Review QuestionsWhat is a security modelWhat are the es.docxPart 1 Review QuestionsWhat is a security modelWhat are the es.docx
Part 1 Review QuestionsWhat is a security modelWhat are the es.docx
 
Part 1 Listed below are several key Supreme Court decisions that .docx
Part 1 Listed below are several key Supreme Court decisions that .docxPart 1 Listed below are several key Supreme Court decisions that .docx
Part 1 Listed below are several key Supreme Court decisions that .docx
 
Part 1 Infrastructure DesignCreate an 8–10-page infrastructur.docx
Part 1 Infrastructure DesignCreate an 8–10-page infrastructur.docxPart 1 Infrastructure DesignCreate an 8–10-page infrastructur.docx
Part 1 Infrastructure DesignCreate an 8–10-page infrastructur.docx
 
part 1 I attended an international conference on Biotechnology and .docx
part 1 I attended an international conference on Biotechnology and .docxpart 1 I attended an international conference on Biotechnology and .docx
part 1 I attended an international conference on Biotechnology and .docx
 
Part 1 Chapter 7 Summary plus end of chapter discussion of Alfred.docx
Part 1 Chapter 7 Summary plus end of chapter discussion of Alfred.docxPart 1 Chapter 7 Summary plus end of chapter discussion of Alfred.docx
Part 1 Chapter 7 Summary plus end of chapter discussion of Alfred.docx
 
Parent Involvement Plan This week you will create a Parent Involve.docx
Parent Involvement Plan This week you will create a Parent Involve.docxParent Involvement Plan This week you will create a Parent Involve.docx
Parent Involvement Plan This week you will create a Parent Involve.docx
 
Parenting Practices Over GenerationsGeneration 1 Years children.docx
Parenting Practices Over GenerationsGeneration 1 Years children.docxParenting Practices Over GenerationsGeneration 1 Years children.docx
Parenting Practices Over GenerationsGeneration 1 Years children.docx
 
ParamsThe interface must be pleasing to look at (a basic form wit.docx
ParamsThe interface must be pleasing to look at (a basic form wit.docxParamsThe interface must be pleasing to look at (a basic form wit.docx
ParamsThe interface must be pleasing to look at (a basic form wit.docx
 

Recently uploaded

How to Make a Pirate ship Primary Education.pptx
How to Make a Pirate ship Primary Education.pptxHow to Make a Pirate ship Primary Education.pptx
How to Make a Pirate ship Primary Education.pptxmanuelaromero2013
 
Computed Fields and api Depends in the Odoo 17
Computed Fields and api Depends in the Odoo 17Computed Fields and api Depends in the Odoo 17
Computed Fields and api Depends in the Odoo 17Celine George
 
_Math 4-Q4 Week 5.pptx Steps in Collecting Data
_Math 4-Q4 Week 5.pptx Steps in Collecting Data_Math 4-Q4 Week 5.pptx Steps in Collecting Data
_Math 4-Q4 Week 5.pptx Steps in Collecting DataJhengPantaleon
 
Software Engineering Methodologies (overview)
Software Engineering Methodologies (overview)Software Engineering Methodologies (overview)
Software Engineering Methodologies (overview)eniolaolutunde
 
Introduction to AI in Higher Education_draft.pptx
Introduction to AI in Higher Education_draft.pptxIntroduction to AI in Higher Education_draft.pptx
Introduction to AI in Higher Education_draft.pptxpboyjonauth
 
ECONOMIC CONTEXT - LONG FORM TV DRAMA - PPT
ECONOMIC CONTEXT - LONG FORM TV DRAMA - PPTECONOMIC CONTEXT - LONG FORM TV DRAMA - PPT
ECONOMIC CONTEXT - LONG FORM TV DRAMA - PPTiammrhaywood
 
Presiding Officer Training module 2024 lok sabha elections
Presiding Officer Training module 2024 lok sabha electionsPresiding Officer Training module 2024 lok sabha elections
Presiding Officer Training module 2024 lok sabha electionsanshu789521
 
Class 11 Legal Studies Ch-1 Concept of State .pdf
Class 11 Legal Studies Ch-1 Concept of State .pdfClass 11 Legal Studies Ch-1 Concept of State .pdf
Class 11 Legal Studies Ch-1 Concept of State .pdfakmcokerachita
 
The Most Excellent Way | 1 Corinthians 13
The Most Excellent Way | 1 Corinthians 13The Most Excellent Way | 1 Corinthians 13
The Most Excellent Way | 1 Corinthians 13Steve Thomason
 
Crayon Activity Handout For the Crayon A
Crayon Activity Handout For the Crayon ACrayon Activity Handout For the Crayon A
Crayon Activity Handout For the Crayon AUnboundStockton
 
भारत-रोम व्यापार.pptx, Indo-Roman Trade,
भारत-रोम व्यापार.pptx, Indo-Roman Trade,भारत-रोम व्यापार.pptx, Indo-Roman Trade,
भारत-रोम व्यापार.pptx, Indo-Roman Trade,Virag Sontakke
 
Paris 2024 Olympic Geographies - an activity
Paris 2024 Olympic Geographies - an activityParis 2024 Olympic Geographies - an activity
Paris 2024 Olympic Geographies - an activityGeoBlogs
 
How to Configure Email Server in Odoo 17
How to Configure Email Server in Odoo 17How to Configure Email Server in Odoo 17
How to Configure Email Server in Odoo 17Celine George
 
Call Girls in Dwarka Mor Delhi Contact Us 9654467111
Call Girls in Dwarka Mor Delhi Contact Us 9654467111Call Girls in Dwarka Mor Delhi Contact Us 9654467111
Call Girls in Dwarka Mor Delhi Contact Us 9654467111Sapana Sha
 
Biting mechanism of poisonous snakes.pdf
Biting mechanism of poisonous snakes.pdfBiting mechanism of poisonous snakes.pdf
Biting mechanism of poisonous snakes.pdfadityarao40181
 
A Critique of the Proposed National Education Policy Reform
A Critique of the Proposed National Education Policy ReformA Critique of the Proposed National Education Policy Reform
A Critique of the Proposed National Education Policy ReformChameera Dedduwage
 
EPANDING THE CONTENT OF AN OUTLINE using notes.pptx
EPANDING THE CONTENT OF AN OUTLINE using notes.pptxEPANDING THE CONTENT OF AN OUTLINE using notes.pptx
EPANDING THE CONTENT OF AN OUTLINE using notes.pptxRaymartEstabillo3
 
Alper Gobel In Media Res Media Component
Alper Gobel In Media Res Media ComponentAlper Gobel In Media Res Media Component
Alper Gobel In Media Res Media ComponentInMediaRes1
 

Recently uploaded (20)

How to Make a Pirate ship Primary Education.pptx
How to Make a Pirate ship Primary Education.pptxHow to Make a Pirate ship Primary Education.pptx
How to Make a Pirate ship Primary Education.pptx
 
Computed Fields and api Depends in the Odoo 17
Computed Fields and api Depends in the Odoo 17Computed Fields and api Depends in the Odoo 17
Computed Fields and api Depends in the Odoo 17
 
_Math 4-Q4 Week 5.pptx Steps in Collecting Data
_Math 4-Q4 Week 5.pptx Steps in Collecting Data_Math 4-Q4 Week 5.pptx Steps in Collecting Data
_Math 4-Q4 Week 5.pptx Steps in Collecting Data
 
Software Engineering Methodologies (overview)
Software Engineering Methodologies (overview)Software Engineering Methodologies (overview)
Software Engineering Methodologies (overview)
 
Model Call Girl in Bikash Puri Delhi reach out to us at 🔝9953056974🔝
Model Call Girl in Bikash Puri  Delhi reach out to us at 🔝9953056974🔝Model Call Girl in Bikash Puri  Delhi reach out to us at 🔝9953056974🔝
Model Call Girl in Bikash Puri Delhi reach out to us at 🔝9953056974🔝
 
Introduction to AI in Higher Education_draft.pptx
Introduction to AI in Higher Education_draft.pptxIntroduction to AI in Higher Education_draft.pptx
Introduction to AI in Higher Education_draft.pptx
 
ECONOMIC CONTEXT - LONG FORM TV DRAMA - PPT
ECONOMIC CONTEXT - LONG FORM TV DRAMA - PPTECONOMIC CONTEXT - LONG FORM TV DRAMA - PPT
ECONOMIC CONTEXT - LONG FORM TV DRAMA - PPT
 
Presiding Officer Training module 2024 lok sabha elections
Presiding Officer Training module 2024 lok sabha electionsPresiding Officer Training module 2024 lok sabha elections
Presiding Officer Training module 2024 lok sabha elections
 
Class 11 Legal Studies Ch-1 Concept of State .pdf
Class 11 Legal Studies Ch-1 Concept of State .pdfClass 11 Legal Studies Ch-1 Concept of State .pdf
Class 11 Legal Studies Ch-1 Concept of State .pdf
 
The Most Excellent Way | 1 Corinthians 13
The Most Excellent Way | 1 Corinthians 13The Most Excellent Way | 1 Corinthians 13
The Most Excellent Way | 1 Corinthians 13
 
Crayon Activity Handout For the Crayon A
Crayon Activity Handout For the Crayon ACrayon Activity Handout For the Crayon A
Crayon Activity Handout For the Crayon A
 
भारत-रोम व्यापार.pptx, Indo-Roman Trade,
भारत-रोम व्यापार.pptx, Indo-Roman Trade,भारत-रोम व्यापार.pptx, Indo-Roman Trade,
भारत-रोम व्यापार.pptx, Indo-Roman Trade,
 
Paris 2024 Olympic Geographies - an activity
Paris 2024 Olympic Geographies - an activityParis 2024 Olympic Geographies - an activity
Paris 2024 Olympic Geographies - an activity
 
How to Configure Email Server in Odoo 17
How to Configure Email Server in Odoo 17How to Configure Email Server in Odoo 17
How to Configure Email Server in Odoo 17
 
Call Girls in Dwarka Mor Delhi Contact Us 9654467111
Call Girls in Dwarka Mor Delhi Contact Us 9654467111Call Girls in Dwarka Mor Delhi Contact Us 9654467111
Call Girls in Dwarka Mor Delhi Contact Us 9654467111
 
Biting mechanism of poisonous snakes.pdf
Biting mechanism of poisonous snakes.pdfBiting mechanism of poisonous snakes.pdf
Biting mechanism of poisonous snakes.pdf
 
A Critique of the Proposed National Education Policy Reform
A Critique of the Proposed National Education Policy ReformA Critique of the Proposed National Education Policy Reform
A Critique of the Proposed National Education Policy Reform
 
EPANDING THE CONTENT OF AN OUTLINE using notes.pptx
EPANDING THE CONTENT OF AN OUTLINE using notes.pptxEPANDING THE CONTENT OF AN OUTLINE using notes.pptx
EPANDING THE CONTENT OF AN OUTLINE using notes.pptx
 
Model Call Girl in Tilak Nagar Delhi reach out to us at 🔝9953056974🔝
Model Call Girl in Tilak Nagar Delhi reach out to us at 🔝9953056974🔝Model Call Girl in Tilak Nagar Delhi reach out to us at 🔝9953056974🔝
Model Call Girl in Tilak Nagar Delhi reach out to us at 🔝9953056974🔝
 
Alper Gobel In Media Res Media Component
Alper Gobel In Media Res Media ComponentAlper Gobel In Media Res Media Component
Alper Gobel In Media Res Media Component
 

Professional Case Management Vol. 19 , No. 6 , 255 - 262.docx

  • 1. Professional Case Management Vol. 19 , No. 6 , 255 - 262 Copyright 2014 © Wolters Kluwer Health | Lippincott Williams & Wilkins Vol. 19/No. 6 Professional Case Management 255 Copyright © 2014 Lippincott Williams & Wilkins. Unauthorized reproduction of this article is prohibited. CE 2.0 ANCCContact Hours A B S T R A C T Purpose of Study: In response to the U.S. Affordable Care Act, the Centers for Medicare & Medicaid Services proposed a change in reimbursement penalties for hospitals beginning October 1, 2012. Reducing the occurrence of unplanned readmissions has become a more urgently focused topic. As part of the health care system, care management aligns with physicians to signifi cantly improve service, fi nancial, and clinical care outcomes. To address the changing health care climate in 2008, care management services were restructured at an academic university medical center located in 1 of the 3 largest counties in California. Changing from a unit-based to a service-based care management model partnered care managers and social workers with physician services. We sought to assess the effect of this change on surrogates for patient experience and clinical quality of care. Primary Practice Setting: Tertiary academic medical center
  • 2. in southern California. Methodology and Sample: Retrospective data were collected from 2 databases for all hospital patient care services from November 2008 to January 2010 to determine whether clinical quality of care and experiential service improvements were realized. Primary outcomes included all-cause and related readmission rates. Secondary outcomes were Hospital Consumer Assessment of Healthcare Providers and Systems (H-CAHPS) scores. An interrupted time series analysis compared data from the single institution for the diffusion and postintervention periods. Results: Comparing data from the diffusion and postintervention periods, the rate of disease-related readmissions decreased signifi cantly (mean 5.43–4.58, p < .05), and all- cause readmissions also decreased, although the difference failed to achieve statistical signifi cance (11.42- 10.49, p = .056). H-CAHPS scores with the patient response of “recommend this hospital” was unchanged over the 2 time points (mean 78.9%–77.8%, p = .26731). Data also showed stable care management staffi ng rates whereas average daily census (ADC) increased over time (ADC 274–297). Implications for Case Management Practice: With health reform driving value-driven care transformation, partnering care managers and social workers with physician services has the potential to impact the patient’s experience as well as fi nancial and clinical care outcomes. Care managers serve a signifi cant role in improving the clinical quality of care by reinforcing a consistent and clear message by the health care team to the patient during the entire hospitalization, not just at the time of discharge. At one institution, partnering physicians with care managers through the acute care continuum (service- based care management) appeared to reduce
  • 3. readmissions without compromising patient satisfaction. Both readmission reduction and effective patient satisfaction scores impact the Centers for Medicare & Medicaid Services value-based purchasing reimbursement calculations. Key words: organization, quality, readmission, reimbursement, satisfaction Reduce Readmissions With Service-Based Care Management Alpesh N. Amin , MD, MBA, MACP, SFHM , Heather Hofmann , MD , Mary M. Owen , RN, MPA , Hai Tran , MPA , Saran Tucker , PhD, MPH , and Sherrie H. Kaplan , PhD, MPH DOI: 10.1097/NCM.0000000000000051 I n response to the U.S. Affordable Care Act signed on March 23, 2010, the Centers for Medicare & Medicaid Services (CMS) sought to reduce Medi- care payments to hospitals through a Value-Based Purchasing program ( CMS, 2011 ; McCarthy, John- son, & Audet, 2013; U.S. Department of Health & Human Services, 2013 ). This new approach included a change in reimbursement penalties for hospitals beginning October 1, 2012. As an opportunity for improvement in service, quality, and cost, reduc- ing the occurrence of unplanned readmissions has become a more urgently focused topic. According
  • 4. to one study, unplanned all-cause readmissions cost Medicare $17.4 billion in 2004, with 20% of the Medicare fee-for-service patients readmitted within 30 days of discharge ( Jencks, Williams, & Coleman, Address correspondence to Alpesh N. Amin, MD, MBA, MACP, SFHM, University of California, Irvine Health, 333 City Boulevard West, Suite 400, Orange, CA 92868 ( [email protected] ). The authors report no confl icts of interest. PCM-D-14-00011_LR 255PCM-D-14-00011_LR 255 19/09/14 7:20 AM19/09/14 7:20 AM 256 Professional Case Management Vol. 19/No. 6 g Copyright © 2014 Lippincott Williams & Wilkins. Unauthorized reproduction of this article is prohibited. 2009 ). Whether interventions target all-cause or diagnosis-specifi c readmissions, this change in reim- bursement policies and practices makes generating effective interventions to improve effi ciency, quality and patient experience of care a systemwide priority ( Hines, Yu, & Randall, 2010 ). At the national level, the Agency for Healthcare Research and Quality (AHRQ) supports and offers information regarding two evidence-based projects to help prevent avoidable readmissions: Project BOOST and Project RED (AHRQ, 2012b). Project BOOST,
  • 5. or Project Better Outcomes for Older adults through Safe Transitions, reduces readmissions in two ways: mentor “hospital teams to map current processes and create and implement action plans for organizational change,” as well as provide “a suite of evidence-based clinical interventions that can be easily adapted and integrated into each unique hospital environment” ( Society of Hospital Medicine, 2012 ). The project focuses on general medicine patients and recognizes length of stay (LOS) and Hospital Consumer Assess- ment of Healthcare Providers and Systems (H-CAHPS) scores as areas of improvement ( Society of Hospital Medicine, 2012 ). Project Re-Engineered Discharge (RED) “is a patient-centered standardized approach to discharge planning” that prepares patients for discharge by immediately “designating a Discharge Advocate to coordinate discharge with the care team and patient” ( AHRQ, 2012a , 2012b ). Both programs have associated hard costs for personnel to focus on the targeted population, but costs vary depending on the institution size. Care managers can provide the level of patient advocacy needed to decrease the ten- sion between evidence-based clinical processes and the patient’s comprehension and readiness for discharge. With health reform driving value-driven care transformation, aligning care management with phy- sician services can signifi cantly improve the patient’s experience as well as fi nancial and clinical care outcomes. Care managers serve a signifi cant role in reducing readmissions ( Hughes, 2012 ). One meta- analysis of 12 studies, 7 of which were conducted in the United States, identifi ed “a 6% decrease in read- mission rate for patients who received hospital-based care management interventions” ( Kim & Soeken, 2005 ). However, few studies have examined the rela-
  • 6. tionship between the structure of care management and readmissions. According to the Case Management Society of America ( 2012 ), “case management is a collabora- tive process … to meet an individual’s health needs [in order] to promote quality cost-effective outcomes.” A well-established model of outcomes management— the Vanderbilt model—established the care manager as part of a triad with the social worker and utilization management to best coordinate a patient’s hospitaliza- tion ( Erickson, 1998 ). The arrangement of care man- agement varies by hospital, with staff often assigned as either service- or unit-based. Both methods have pros and cons that must be considered if converting from one system to another ( Zander & Warren, 2005 ). S ERVICE -B ASED C ARE M ANAGEMENT In 2009, care management services were restructured at the University of California, Irvine (UCI) Medi- cal Center, a health care setting that renders tertiary acute and ambulatory services for patients. The transition from a unit-based to service-based system was in response to perceived overstaffi ng of the care management department based on a review by an independent consulting fi rm in early 2008. By June 2008, a resource management expert reviewed the care management program structure and functional responsibilities. Given the national emphasis on effi - ciency and effectiveness at the bedside, the consul- tants recommended realignment to a service-based model. Service-based care management provided uni- form care coordination, decreased confusion between care teams and patient families, managed expenses at the point of service, and mobilized a team leader to
  • 7. coordinate care from admission to discharge, with a handoff to the ambulatory setting when necessary. It was determined that a reduction in care management staffi ng was not necessary, but rather an enhanced emphasis on resource management was needed. A multidisciplinary work team was assembled and comprised care managers, nonlicensed autho- rization coordinators, and clinical social workers, championed by the executive director, UCI Hospi- talist Program, and other medical staff leaders along with the Director of Case Management, with the support of the chief medical offi cer for UCI Medical Center. The team outlined goals, including a target of improving effi ciencies in care delivery and reducing readmissions, while maintaining effective discharge With health reform driving value-driven care transformation, aligning care management with physician services can signifi cantly improve the patient’s experience as well as fi nancial and clinical care outcomes . PCM-D-14-00011_LR 256PCM-D-14-00011_LR 256 19/09/14 7:20 AM19/09/14 7:20 AM Vol. 19/No. 6 Professional Case Management 257 Copyright © 2014 Lippincott Williams & Wilkins. Unauthorized reproduction of this article is prohibited. satisfaction scores. The roles and responsibilities of the disciplines were defi ned, with the understanding
  • 8. that each service line would function as a team, often with roles overlapping on the basis of the case (see Table 1 ). By August 2008, the staffi ng and resource needs were drafted utilizing historical case mix index, aver- age LOS, and volume (the number of discharges and patient days) for the physician service lines. The payer mix was also considered an important element due to insurance resource limitations that often drive the ability, or inability, to transition care to the next level. Based on staffi ng guidelines from the Center for Case Management, it was anticipated that the service-line model would require 12.7 additional staff, including 3.4 clinical social workers, 4.2 RN care managers, and one decision support analyst ( Center for Case Management, 2007 ). The team proceeded in support of the resource management expert opinion and did not seek additional staff at that time. The service-based care management model was offi cially rolled out in April 2009. We evaluated the impact of this program on 30-day all-cause and dis- ease-specifi c readmission rates and patient experience. M ETHODS Research Design Retrospective data for all services from April 2009 to January 2010 were abstracted to assess the impact of the program on clinical service improvements. Improvements were a measure of reduced 30-day readmission rates and increase or maintenance of patient satisfaction following implementation of the
  • 9. program. Two databases were available and used: University Health System Consortium (UHC) and Offi ce of Statewide Health Planning & Develop- ment (OSHPD). Primary outcomes include all-cause and related readmission rates. H-CAHPS scores were secondary outcomes. The study time period was evaluated on the basis of 2 defi ned periods of inter- vention: April 2009 through August 2009 represents implementation and diffusion of the intervention, and TABLE 1 Service-Based Care Management Functional Team Practices Clinical Social Worker Care Manager Care Coordinator Verify discharge issues Interact with family and care team Educate on resources Initiate border letters Assess adjustments to illnesses (social) Evaluate presumptive disability Initiate disability letters/FMLA Arrange patient/family conferences Monitor compliance with advance health care directive Collaborate with team on alternative care plans Plan community resource needs Verify discharge needs Interact with family and care team Facilitate resources Initiate border letters Assess adjustments to illnesses (social) Evaluate presumptive disability Initiate disability letters/FMLA Arrange patient/family conferences Assess adjustments to illnesses (clinical)
  • 10. Collaborate with team on alternative care plans Plan community resource needs Conduct retrospective reviews on discharged cases Monitor utilization management with payer Evaluate resource utilization opportunities for organizational improvement Negotiate with payers to secure resources for safe patient discharge Facilitate follow-up care with physicians, anticoagulation clinic, and education Arrange follow-up care for unfunded Collaborate with Pharmacy on medication needs for safe discharge Coordinate psychiatric/acute patient transfers Verify discharge needs Obtain equipment Arrange resources Research border resources Note . FMLA = Family and Medical Leave Act. Service-based care management provided uniform care coordination, decreased confusion between care teams and patient families, managed expenses at the point of service, and mobilized a team leader to coordinate care from admission to discharge, with
  • 11. a handoff to the ambulatory setting when necessary . PCM-D-14-00011_LR 257PCM-D-14-00011_LR 257 19/09/14 7:20 AM19/09/14 7:20 AM 258 Professional Case Management Vol. 19/No. 6 Copyright © 2014 Lippincott Williams & Wilkins. Unauthorized reproduction of this article is prohibited. September 2009 through January 2010 represents the postintervention time period. Data Abstraction Data were collected for the study time period on patients discharged from UCI Medical Center and then they experienced a subsequent readmission within 30 days of the index admission. Data collected from UHC exclude chemotherapy, radiation therapy, reha- bilitation, dialysis, newborn deliveries, mental diseases, and alcohol and drug use patients. Patient satisfaction scores refl ect patients older than 18 years with a hospi- tal admission during the defi ned study period. Intervention Periods Two time periods were evaluated in this study. The diffusion period was April 2009 through August 2009 and represents the period of implementa- tion. Implementation began in April 2009 with full implementation complete by August 2009. The pos- tintervention period was September 2009 through
  • 12. January 2010. This was the period following full implementation of the intervention and represents a period of equal length of time to the diffusion period. Description of Measures All-Cause Readmission All-cause readmission monthly rate calculations were based upon patients aged greater than 18 years who returned to the hospital within 30 days of discharge from the index admission, regardless of the Medicare diagnosis-related group (MS-DRG) of either admission. Related Readmission Related readmission monthly rates were limited to patients who returned to the hospital within 30 days with an MS-DRG related to the index admission. Analysis Data Consistency Trends comparing two data sources for 30-day read- missions during the study time period were evalu- ated to confi rm the observed trends for data col- lected from the primary data source, UHC. Pearson’s r (see Table 2 ) was calculated to evaluate the correla- tion of monthly UCI 30-day readmission rates from the UHC database to the rates from OSHPD data source. Interrupted Time Series An interrupted time series (ITS) analysis (see Table 2 ) was conducted comparing trends between the diffu- sion and postintervention periods for both all-cause
  • 13. and related monthly 30-day readmission rates. An autoregressive integrated moving average model (see Table 2 ) was used to assess the difference in slope TABLE 2 Glossary of Statistical Terms Term Defi nition Pearson’s r Linear or product moment correlation Measures the strength of the linear relationship between 2 variables. The correlation coeffi cient, r , ranges from − 1 to 1. A value of 0 indicates no association. ITS Interrupted time series analysis A method of statistical analysis to compare time trends before and after intervention. ARIMA Autoregressive integrated moving average ARIMA methodology is applied to stationary time series data to describe movement as a function of autoregressive (AR) and moving average (MA) parameters. AR Autoregressive Assessment of how a data set is related to itself over time. MA Moving average Used as a form of smoothing, by relating what happens in a time period to the random error on the previous time period
  • 14. From “Interrupted Time-Series Analysis and Its Application to Behavioral Data,” by D. P. Hartmann, J. M. Gottman, R. R. Jones, W. Gardner, A. E. Kazdin, and R. S. Vaught, 1980, Journal of Applied Behavior Analysis , 13(4), pp. 543- 559. …the staffi ng and resource needs were drafted utilizing historical case mix index, average length of stay, and volume (the number of discharges and patient days) for the physician service lines. The payer mix was also considered an important element due to insurance resource limitations that often drive the ability, or inability, to transition care to the next level . PCM-D-14-00011_LR 258PCM-D-14-00011_LR 258 19/09/14 7:20 AM19/09/14 7:20 AM Vol. 19/No. 6 Professional Case Management 259 Copyright © 2014 Lippincott Williams & Wilkins. Unauthorized reproduction of this article is prohibited. between the diffusion and postintervention periods for each measure. Overall Mean Comparison Mean 30-day readmission rates for the diffusion
  • 15. and postintervention periods were also compared to assess an overall change in 30-day readmission rates following implementation and diffusion of the intervention. Mean monthly hospital satisfaction scores from the H-CAHPS survey were also assessed as a secondary outcome to determine impact of the service-based model on the patient’s satisfaction with regard to recommending the hospital. R ESULTS Readmission Rates Pearson’s r evaluating the correlation of monthly UCI 30-day readmission rates from the UHC data- base to the rates from OSHPD data source showed a signifi cant correlation verifying consistency of the observed trends in the primary data source ( r = .9, p < .001). The ITS analysis for 30-day readmission rates for all-cause and related readmissions showed insig- nifi cant negative slope changes comparing diffusion with postintervention periods. An overall reduction in mean readmission rates for all-cause and related 30-day readmissions was noted from diffusion of intervention to postintervention (see Table 3 ). A reduction in mean all-cause 30-day readmission from 11.42% to 10.49% readmissions was noted with a signifi cant reduction in the mean related 30-day read- mission rate from 5.43% to 4.58% readmissions. Patient Satisfaction The ITS analysis performed on monthly patient sat-
  • 16. isfaction scores for nursing communication showed insignifi cant slope changes comparing intervention periods. In addition, there was no signifi cant change in overall mean satisfaction between diffusion of intervention and postintervention time periods (see Table 4 ). Staffi ng Service-based care management typically requires additional staffi ng due to logistical challenges of services not geographically localized. However, additional staff was not hired for this realignment. As the census increased during the diffusion period of the study due to hospital growth, additional per diem staff supplemented the team as needed. From November 2008 through January 2010, 1.67 addi- tional FTEs were used while the census increased by TABLE 3 Comparison of Mean Proportion of 30-Day Readmissions for Diffusion and Postintervention Periods Readmission Type Phase Mean Rate Mean Difference SE average n a p All-cause Diffusion 11.42 0.931 0.429 1474 0.056 Post 10.49 0.301 1444 Related Diffusion 5.43 0.857 0.271 1474 0.02 Post 4.58 0.226 1444 Note . All-cause = patients older than 18 years who returned to the hospital within 30 days of discharge from index
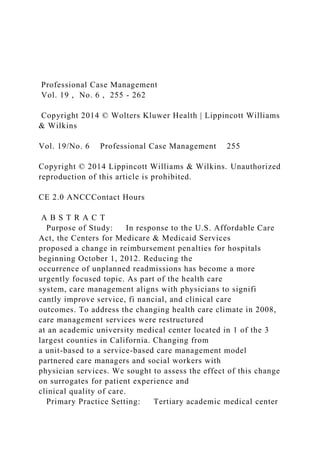
  • 17. admission, regardless of Medicare diagnosis-related group (MS-DRG) of either admission. Related = patients older than 18 years who returned to the hospital within 30 days of discharge from index admission, with an MS- DRG related to the index admission. Diffusion period = April–August 2009. Postintervention period = September 2009–January 2010. SE = standard error. a Average number of cases per month. TABLE 4 Comparison of Mean Satisfaction Scores for Diffusion and Postintervention Periods Phase Mean Rate Mean Difference SE Average n a p Diffusion 78.9 1.08 1.43 185 0.267 Post 77.8 0.86 178 Note . Satisfaction scores obtained from H-CAHPS survey response to “Recommend the hospital.” Diffusion Period = April–August 2009; Postintervention Period = September 2009–January 2010. SE = standard error. a Average number of cases per month. PCM-D-14-00011_LR 259PCM-D-14-00011_LR 259 19/09/14 7:20 AM19/09/14 7:20 AM 260 Professional Case Management Vol. 19/No. 6 Copyright © 2014 Lippincott Williams & Wilkins. Unauthorized reproduction of this article is prohibited.
  • 18. approximately 25 patients per day (1:15 ratio equiva- lent; see Figure 1 ). D ISCUSSION When faced with limited resources and reductions in reimbursement for readmissions, changing from a unit-based to a service-based care management model assisted with reductions in readmissions without compromising patients’ experience of the quality of care. Given the importance of transitions of care, dis- charge planning is a key focus for reducing readmis- sions. It is well established that care management is a fi eld that can effectively assist with discharge plan- ning ( Maramba, Richards, Myers, & Larrabee, 2004 ; Naylor, Aiken, Kurtzman, Olds, & Hirschman, 2011 ; Simmons, 2005 ). Numerous factors lie at the core of the issue of readmissions. For one, studies have shown that there is an important link between clinical quality and the patient experience, referred to as experiential quality ( Chandrasekaran, Senot, & Boyer, 2012 ; Glickman et al., 2010 ). Chandrasekaran’s team found that “CMS process management is positively associated with clinical quality but negatively associated with expe- riential quality, suggesting a tension between the two healthcare outcomes.” When they further explored the link between readmissions and experiential quality among 2,942 hospitals, a signifi cant and much stron- ger correlation was identifi ed than found with clinical process measures. In addition to experiential qual- ity, factors such as insurance status and LOS greater than 2 days can predict a readmission for medicine service patients (Hasan et al., 2009). Others argue
  • 19. that there are numerous barriers beyond tangible fac- tors. According to an online survey of 51 National Association of Public Hospitals and Health Systems member facilities, one of four categories of barriers to reducing readmissions is “hospital quality of care barriers—systems or processes within a hospital that When faced with limited resources and reductions in reimbursement for readmissions, changing from a unit-based to a service-based care management model assisted with reductions in readmissions without compromising patients’ experience of the quality of care . FIGURE 1 Care management staffi ng versus average daily census for care managers. Staffi ng, number of care managers during the given month. Average Daily Census, number of cases supported by care managers on average per day during the given month. Preintervention Period, November 2008–March 2009. Diffusion Period, April–August 2009. Postintervention Period, September 2009–January 2010. PCM-D-14-00011_LR 260PCM-D-14-00011_LR 260 19/09/14 7:20 AM19/09/14 7:20 AM Vol. 19/No. 6 Professional Case Management 261 Copyright © 2014 Lippincott Williams & Wilkins. Unauthorized reproduction of this article is prohibited.
  • 20. directly contribute to poor quality of care for patients (e.g., poor coordination of care)” ( Siegel, 2011 ). Addressing these factors is a viable focus for improve- ment in the quality of care. Employing care manage- ment in patient satisfaction may reduce readmissions and LOS ( Patient Satisfaction Planner, 2007 ). The Affordable Care Act includes provisions for hospital-level accountability for patients’ experience of health care quality. As a community safety-net hospital in southern California, this type of hospital has incurred greater reimbursement reductions due to unfavorable readmission rates ( Berenson & Shih, 2012 ; Joynt & Jha, 2013 ; Rau, 2012 ). Extrapolation of these fi ndings to other institution types is limited. However, all hospi- tals should strive for improved patient experience that service-based care management maintained. In the age of value-based purchasing, one must question the most appropriate intervention for care management structure and readmission management. Projects RED & BOOST may be less cost-effective to pursue, compared with changing from a unit- to service-based structure. Factors external to the implementation of the ser- vice-based care management model may have contrib- uted to the success, given the organizational focus on improving heart failure, acute myocardial infarction, and pneumonia readmission rates. With the care man- agement team aligned by service, the level of expertise and knowledge of that population’s needs resulted in a more proactive approach to discharge planning. Targeted resource utilization analysis for specifi c
  • 21. diagnostic-related groups (DRG) and cost of care are currently being evaluated to determine secondary improvements. A Resource Utilization Council employs the expertise of the care management experts to help delineate opportunities for effi ciency and effectiveness improvements by DRGs within each service line. There are several limitations to this study. First, this is a retrospective study, with index cases from a 5-month period. Data stem from a single institu- tion, which may limit its application to other popu- lations. Furthermore, readmissions were considered if both the index and second admission occurred at our institution. Failure to capture a readmission at another institution limits the generalization to larger- scale readmission reduction efforts. Finally, reliance on H-CAHPS scores excludes patients who did not complete the survey and may be an insuffi cient sur- rogate for all components of patient satisfaction. C ONCLUSIONS The presence of care management in patient care is essential to reducing readmissions. Our service-based care management model contributed to reducing related readmissions for all physician service lines despite decreased staffi ng and without compromising patient satisfaction. ACKNOWLEDGMENT The authors thank Susan Kelleghan, RN, for assis- tance in H-CAHPS data analysis. R EFERENCES
  • 22. Agency for Healthcare Research and Quality . ( 2012a ). Pre- venting avoidable readmissions: Improving the hospi- tal discharge process . Retrieved June 13, 2012, from http://www.ahrq.gov/qual/impptdis.htm Agency for Healthcare Research and Quality . ( 2012b ). Project RED (Re-Engineered Discharge) training pro- gram . Retrieved June 13, 2012, from http://www.ahrq .gov/qual/projectred/ Berenson , J. , & Shih , A. ( 2012 ). Higher readmissions at safety-net hospitals and potential policy solutions . New York, NY: The Commonwealth Fund . Case Management Society of America . ( 2012 ). What is a case manager? Retrieved June 19, 2012, from http:// www.cmsa.org/Home/CMSA/WhatisaCaseManager/ tabid/224/Default.aspx Center for Case Management . ( 2007 ). Proposed frame- work to plan/evaluate/benchmark staffi ng . Wellesley, MA: Author. Centers for Medicare & Medicaid Services . ( 2011 ). Medi- care program; hospital inpatient prospective payment systems for acute care hospitals and the long-term care hospital prospective payment system and FY 2012 rates; hospitals’ FTE resident caps for graduate medi- cal education payment (No. Volume 76, No. 160) . Washington, DC: Department of Health and Human Services .
  • 23. Chandrasekaran , A. , Senot , C. , & Boyer , K. K. ( 2012 ). Process management impact on clinical and experi- ential quality: Managing tensions between safe and patient-centered healthcare . Manufacturing & Service Operations Management , 14 ( 4 ), 548 . doi:10.1287/ msom.1110.0374 Erickson , S. M. ( 1998 ). The Vanderbilt model of outcomes management . Critical Care Nursing Clinics of North America , 10 ( 1 ), 13 – 20 . Retrieved from http://www. ncbi.nlm.nih.gov/pubmed/9644344 Glickman , S. W. , Boulding , W. , Manary , M. , Staelin , R. , Roe , M. T. , Wolosin , R. J. , … Schulman , K. A. ( 2010 ). Patient satisfaction and its relationship with clinical quality and inpatient mortality in acute myocardial With the care management team aligned by service, the level of expertise and knowledge of that population’s needs resulted in a more proactive approach to discharge planning . PCM-D-14-00011_LR 261PCM-D-14-00011_LR 261 19/09/14 7:20 AM19/09/14 7:20 AM 262 Professional Case Management Vol. 19/No. 6 Copyright © 2014 Lippincott Williams & Wilkins. Unauthorized
  • 24. reproduction of this article is prohibited. infarction . Circulation: Cardiovascular Quality and Outcomes , 3 ( 2 ), 188 – 195 . doi:10.1161/CIRC OUTCOMES.109.900597 Hartmann , D. P. , Gottman , J. M. , Jones , R. R. , Gardner , W. , Kazdin , A. E. , & Vaught , R. S. ( 1980 ). Interrupted time- series analysis and its application to behavioral data . Journal of Applied Behavior Analysis , 13 ( 4 ), 543 – 559 . Hasan , O. , Meltzer , D. O. , Shaykevich , S. A. , Bell , C. M. , Kaboli , P. J. , Auerbach , A. D. , … Schnipper , J. L. ( 2009 ). Hospital readmission in general medicine patients: A prediction model . Journal of General Internal Medi- cine , 25 ( 3 ), 211 – 219 . doi:10.1007/s11606-009-1196-1 Hines , P. A. , Yu , K. , & Randall , M. ( 2010 ). Preventing heart failure readmissions: is your organization pre- pared ? Nursing Economics , 28 ( 2 ), 74 – 85 . Retrieved from http://www.ncbi.nlm.nih.gov/pubmed/20446378 Hughes , L. ( 2012 , May 15). A hybrid approach: Univer- sity Missouri improves 30-day all-cause readmissions by 20%. Paper presented at the UHC Imperatives for Quality Member Spotlight Web Conference . Retrieved from https:// www.uhc.edu/docs/49016776_UHCread missionspresentation (fi nal).pdf Jencks , S. F. , Williams , M. V. , & Coleman ,
  • 25. E. A. ( 2009 ). Rehospitalizations among patients in the Medicare fee-for-service program . The New England Jour- nal of Medicine , 360 ( 14 ), 1418 – 1428 . doi:10.1056/ NEJMsa0803563 Joynt , K. E. , & Jha , A. K. ( 2013 ). Characteristics of hos- pitals receiving penalties under the Hospital Readmis- sions Reduction Program . JAMA , 309 ( 4 ), 342 – 343 . doi:10.1001/jama.2012.94856 Kim , Y.-J. , & Soeken , K. L. ( 2005 ). A meta- analysis of the effect of hospital-based case management on hospital length-of-stay and readmission . Nursing Research , 54 ( 4 ), 255 – 264 . Retrieved from http://www.ncbi.nlm .nih.gov/pubmed/16027568 Maramba , P. J. , Richards , S. , Myers , A. L. , & Larrabee , J. H. ( 2004 ). Discharge planning process: applying a model for evidence-based practice . Journal of Nursing Care Quality , 19 ( 2 ), 123 – 129 . Retrieved from http:// www.ncbi.nlm.nih.gov/pubmed/15077829 McCarthy , D. , Johnson , M. B. , & Audet , A.-M. ( 2013 ). Recasting readmissions by placing the hospital role in community context . JAMA , 309 ( 4 ), 351 – 352 . doi:10.1001/jama.2013 Naylor , M. D. , Aiken , L. H. , Kurtzman , E. T. , Olds , D. M. , & Hirschman , K. B. ( 2011 ). The care span: The importance of transitional care in achieving health
  • 26. reform . Health affairs (Project Hope) , 30 ( 4 ), 746 – 754 . doi:10.1377/hlthaff.2011.0041 Patient satisfaction planner . ( 2007 ). Six Sigma project slashes LOS for SNF discharges. Initiative targets ambulation, early assessment . Hospital Peer Review , 32 ( 12 ), 167 – 169 . Retrieved from http://www.ncbi .nlm.nih.gov/pubmed/18232292 Rau , J. ( 2012 , August 8–12). Hospitals treating the poor hardest hit by readmissions penalties . Kaiser Health News . Retrieved February 6, 2013, from http:// www.kaiserhealthnews.org/Stories/2012/August/13/ hospitals-treating-poor-hardest-hit-readmissions- penalties.aspx Siegel , B. ( 2011 ). Reducing readmissions in safety net hospi- tals & health systems (Research Brief). National Associ- ation of Public Hospitals and Health Systems . pp. 1 – 16 . Retrieved from http://www.naph.org/Main-Menu- Category/Our-Work/Quality-Overview/Reducing- Readmissions/Reducing-Readmissions-in-Safety-Net- Hospitals-and-Health-Systems.aspx?FT = .pdf Simmons , F. M. ( 2005 ). Hospital overcrowding: An oppor- tunity for case managers . The Case Manager , 16 ( 4 ), 52 – 54 ; quiz 55. doi:10.1016/j.casemgr.2005.06.004 Society of Hospital Medicine . ( 2012 ). Learn how BOOST reduces readmission rates . Retrieved June 13, 2012, from http://www.hospitalmedicine.org/AM/Template . c f m ? S e c t i o n = H o m e & Te m p l a t e = / C M / H
  • 27. T M L Display.cfm&ContentID = 27576 U.S. Department of Health & Human Services . ( 2013 ). Healthcare.gov . The Health Care Law & You . Retrieved January 24, 2013, from http://www.health- care.gov/law/index.html Zander , K. , & Warren , C. ( 2005 ). Converting case man- agers from MD/service to unit-based assignments: A before and after comparison . Lippincott’s Case Man- agement: Managing the Process of Patient Care , 10 ( 4 ), 180 – 184 . Retrieved from http://www.ncbi.nlm.nih .gov/pubmed/16056113 Alpesh N. Amin, MD, MBA, MACP, SFHM, is Tom and Mary Cesario Chairman, Department of Medicine, the University of California– Irvine (UC Irvine). He is Professor of Medicine, Business, Public Health and Nursing at UC Irvine. He is also founder and executive director of the Hospitalist Program. Heather Hofmann, MD, is a resident physician in the Depart- ment of Medicine at UC Irvine with a research interest in quality improve- ment in the inpatient setting. Mary M. Owen, RN, MPA, is currently the director of Patient Experience at the University of California, Irvine Health. Previously, she spent 15 years as the senior director of Quality and Care Management at UC Irvine Health, where the service-based care management
  • 28. model was implemented. Hai Tran, MPA, is currently a senior analyst in Quality & Patient Safety Department at UC Irvine Health. Saran Tucker, PhD, MPH, is currently a part-time Professor of Health Sciences at California State University, Fullerton. She is also founder of The Data Result, LLC, a data management consulting fi rm. Previously, she was the manager of Quality & Patient Safety Department at UC Irvine Health. Sherrie H. Kaplan, PhD, MPH, is the assistant vice chancellor of Healthcare Measurement and Evaluation in the UC Irvine School of Medi- cine and executive co-director of the Health Policy Research Institute at the University of California, Irvine. For more than 41 additional continuing education articles related to Case Management topics, go to NursingCenter.com/CE. PCM-D-14-00011_LR 262PCM-D-14-00011_LR 262 19/09/14 7:20 AM19/09/14 7:20 AM Managing to improve quality: The relationship between accreditation
  • 29. standards, safety practices, and patient outcomes Deirdre K. Thornlow Elizabeth Merwin Background: Given the trend toward eliminating reimbursement for ‘‘never events,’’ hospital administrators are challenged to implement practices designed to prevent their occurrence. Little evidence exists, however, that patient safety practices, as evaluated using accreditation criteria, are related to the achievement of patient safety outcomes. Purpose: The aim of this study was to examine the relationship between patient safety practices, as measured by accreditation standards, and patient safety outcomes as measured by hospital rates of infections, decubitus ulcers, postoperative respiratory failure, and failure to rescue. Methodology: Secondary data were used to examine relationships between patient-safety-related accreditation standards and patient outcomes in U.S. acute care hospitals. Accreditation performance areas were reduced into subscores to represent patient safety practices. Outcome rates were calculated using the Agency for Healthcare Research and Quality Patient Safety Indicator
  • 30. software. Multivariate regression was performed to determine the significance of the relationships. Findings: Three of four multivariate models significantly explained variance in hospital patient safety indicator rates. Accreditation standards reflecting patient safety practices were related to some outcomes but not others. Rates of infections and decubitus ulcers occurred more frequently in hospitals with poorer performance in utilizing patient safety practices, but no differences were noted in rates of postoperative respiratory failure or failure to rescue. Practice Implications: Certain adverse events, such as infections and decubiti, may be reduced by preventive protocols that are reflected in accreditation standards, whereas other events, such as failure to rescue and postoperative respiratory failure, may require multifaceted strategies that are less easily translated into protocols. Our approach may have influenced the observed associations yet represents progress toward assessing whether safety practices, as measured by accreditation standards, are related to patient outcomes. July–September � 2009262 Deirdre K. Thornlow, PhD, RN, CPHQ, is Assistant Professor,
  • 31. School of Nursing, Duke University, Durham, North Carolina. E-mail: [email protected] Elizabeth Merwin, PhD, RN, FAAN, is Associate Dean, Research, Madge M. Jones Professor of Nursing, and Director, Rural Health Care Research Center, School of Nursing, University of Virginia, Charlottesville. E-mail: [email protected] This study was approved by the institutional review board (UVA No. 2004-0255-00) and supported by Grant No. F31 NR009320-01 from the National Institute for Nursing Research. The contents of this article are solely the responsibility of the authors and do not necessarily represent the official views of the National Institute for Nursing Research. Key words: adverse events, hospital accreditation, outcomes, patient safety, safety practices Health Care Manage Rev, 2009, 34(3), 262-272 Copyright A 2009 Wolters Kluwer Health | Lippincott Williams & Wilkins 9Copyright @ 200 Lippincott Williams & Wilkins. Unauthorized reproduction of this article is prohibited. H ospitals should be motivated more than ever to commit resources and attention to patient safety, for beginning October 2008, the Centers for Medicare and Medicaid Services (CMS) eliminated or reduced payments for pressure ulcers, hospital-acquired infections, and other ‘‘never events,’’ defined as prevent-
  • 32. able adverse events that should never occur in health care (CMS, 2007). This change in reimbursement follows earlier CMS initiatives that now require hospitals to submit evidence-based quality measures or suffer reduc- tions in their Medicare Annual Payment Updates. The CMS is expanding reimbursement models by reward- ing hospitals with higher Medicare payment for better mortality outcomes; poor performing hospitals will be penalized with reduced payments. Such reimbursement changes may be justified by research evidence demon- strating that most medical errors, or adverse events, are preventable (Lehman, Puopolo, Shaykevich, & Brennan, 2005; Thomas et al., 2000) and hospitalized patients who experience a medical error remain hospitalized longer and accrue greater costs when compared with controls (Nordgren, Johnson, Kirschbaum, & Peterson, 2004; Rojas, Silver, Llewellyn, & Rances, 2005). The research approach in this study may inform hospitals about the influence of organizational character- istics and processes of care on patient safety outcomes. Although studies have shown associations between char- acteristics of hospital systems, such as teaching status, ownership status, nurse staffing, and patient safety out- comes (Ayanian, & Weissman, 2002; Devereaux et al., 2002; Kupersmith, 2005; Stanton, 2004), few studies have examined how these hospital characteristics influence utilization of patient safety practices, and even fewer studies have examined the impact of using patient safety practices on patient outcomes. In designing patient safeguards, it is essential to consider how patient safety practices, defined as types of care processes whose application reduces the probability of an adverse event (Shojania, Duncan, McDonald, & Wachter, 2002), con- tribute to safe care. This is challenging, as little evidence suggests that safety practices, such as those commonly used
  • 33. in non-health-care fields, confer benefit in acute care hospitals, especially on patient outcomes (Shojania et al., 2002). When evidence does exist regarding efficacy of safety processes, organizations have made attempts to translate such evidence into practice, to include incorpo- rating patient safety standards into the hospital accredi- tation process (Kizer & Blum 2005; Leape, Berwick, & Bates, 2002); however, the link between these practices and outcomes has not yet been clarified. In this study, secondary data were used to examine relationships among hospital systems, utilization of patient safety practices, as measured by accreditation standards, and patient outcomes in acute care hospitals to determine whether the use of patient safety practices influences rates of four patient safety indicators: infections due to medical care, decubitus ulcers, postoperative respiratory failure, and failure to rescue. We hypothesized that teaching hospitals, hospitals with higher nurse staffing levels, and hospitals using more patient safety practices would ex- perience lower rates of these patient safety incidents than would nonteaching hospitals, hospitals with lower levels of nurse staffing, and hospitals using fewer patient safety practices. Findings, implications for current practice, and suggestions for future research designed to improve patient safety in acute care hospitals will be presented. Conceptual Framework The Quality Health Outcomes Model (QHOM; Mitchell, Ferketich, & Jennings, 1998) served as the conceptual framework for this study. In 1998, the Expert Panel on Quality Health Care of the American Academy of Nursing published the QHOM as a conceptual framework for quality and outcomes research, most specifically as a
  • 34. means to test relationships among the elements of struc- ture, process, and outcomes. The QHOM built on these three elements from Donabedian’s (1966) seminal work in assessing the quality of medical care and incorporated client, or patient, characteristics as a fourth construct. The QHOM realigned the constructs to capture their dynamic, rather than linear, relationships. The traditional ‘‘struc- ture’’ construct was renamed ‘‘system’’ in the QHOM, whereas the traditional ‘‘process’’ construct was renamed ‘‘intervention.’’ The QHOM posits reciprocal interactions among the four constructs (system, intervention, outcome, and client), thus serving as a useful conceptual guide for health care systems researchers. Several investigators have used the QHOM model in acute and community care to organize their choice of variables among the four con- structs and to build evidence regarding the quality of health care (Mayberry & Gennarro, 2001; Radwin & Fawcett, 2002; Sin, Belza, LoGerfo, & Cunningham, 2005). In this study, system variables included hospital characteristics such as teaching status, ownership status, size, location, and nurse staffing levels; intervention vari- ables were defined as utilization of patient safety practices; outcomes, or patient safety indicators, were defined by the Agency for Healthcare Research and Quality (AHRQ, 2007); and client characteristics were defined as risk- adjusted variables including diagnosis, age, and gender. The client variables were used to flag potentially pre- ventable complications and to create hospital-level risk- adjusted patient safety indicator rates (AHRQ, 2007). Measures for each of the constructs are described below. Methods Secondary data were analyzed from a stratified probability sample of acute care hospitals. Hospital-level data were
  • 35. Safety Practices and Patient Outcomes 263 9Copyright @ 200 Lippincott Williams & Wilkins. Unauthorized reproduction of this article is prohibited. gathered from the 2002 American Hospital Association (AHA) annual survey data and 2002 Joint Commission (JC) accreditation performance reports. Hospital accred- itation performance reports were retrieved online from JC Quality Check (www.jointcommission.org) in 2005. Patient-level data were gathered from the 2002 Nation- wide Inpatient Sample (NIS), the largest all-payer inpatient database in the United States which contains patient-level clinical and resource data on hospital stays from states participating in the Healthcare Cost and Utilization Project and is designed to approximate a 20% stratified probability sample of U.S. community hospitals (AHRQ, 2008). Patient characteristics were risk adjusted by age, gender, diagnoses, and comorbidities using the AHRQ (2007) comorbidity software algorithm, as de- scribed in the ‘‘Measures’’ section. Study Sample General medical–surgical community hospitals, as clas- sified by AHA, served as the population for study. Specialty hospitals, such as children’s, psychiatric, and rehabilitation hospitals, were excluded because the se- lected patient safety indicators address incidents that are more likely to occur in general medical–surgical adult patients. The 2002 NIS inpatient discharge-level file, which contains data for 100% of the discharges (n = 7,853,982) from 995 hospitals in 35 participating states, was used. Of the 35 states in the 2002 NIS sample, 10
  • 36. states prohibit release of AHA hospital identifiers; there- fore, these states’ hospitals were excluded. In addition, one state did not code patient comorbidities, data that are necessary to risk adjust; therefore, this state and its hospitals also were excluded from the sample. And fi- nally, to complete analyses, it was necessary to match the 2002 NIS data to 2002 JC survey data; therefore, only those hospitals surveyed by JC in 2002 were included in this study—four states had no surveyed hospitals in the 2002 NIS sample. The study sample was composed of 1,430,981 inpatient discharge records from 115 hospitals in 20 states. Sample size equaled less than 115 hospitals for two of four outcomes studied due to coding limitations in two states that precluded inclusion (e.g., missing ad- mission type). Measures Data were used to construct variables that measured hospital systems, utilization of patient safety practices, and risk-adjusted patient outcomes. Hospital system variables were constructed from NIS and AHA survey data. These descriptive structural measures included nurse staffing (ratio of RN full-time equivalents to adjusted average daily census [A-ADC]), teaching status, hospital location (urban or rural based on metropolitan statistical area population standards), hospital size (A-ADC), and owner- ship. Certain variables were recoded to conserve degrees of freedom. First, the continuous variable A-ADC was used to measure hospital size rather than NIS-designated categories small, medium, and large. Second, hospital ownership was originally classified by NIS in five cate- gories: government nonfederal; private, not-for-profit; private, investor owned; and two additional categories into which smaller strata of hospitals were collapsed.
  • 37. Federal hospitals are not sampled in NIS. Due to the large numbers of hospitals within the two NIS-collapsed categories, precise ownership information for each of the 115 sample hospitals was obtained from the 2006 AHA directory so that all hospitals could be accurately categorized, without the need for collapsed categories. Ownership was then coded into two levels: for-profit and other. Joint Commission Accreditation Performance Reports were used to construct a measure of each hospital’s utilization of patient safety practices. During accreditation surveys, 45 performance areas encompassing nearly 500 standards are evaluated and scored. It should be noted that accreditation performance areas were scored on a scale of 1 to 5, with 5 being the poorest score; thus, a higher score indicates poorer performance in using that safety practice. Because only half of the JC standards related to patient safety, as noted by the JC (2003), and little variation existed among our study hospitals in their overall ac- creditation scores (M = 92.3, SD = 3.68), we sought a parsimonious method to differentiate patient safety practices among hospitals. Using a 4-point scale (1 = ‘‘not relevant’’ to 4 = ‘‘very relevant’’), an expert panel composed of hospital quality improvement directors and nurse executives, excluding the authors, evaluated the 45 performance areas to determine, in their expert opinion, which performance areas most embodied patient safety. The expert panelists unanimously rated 12 per- formance measures as most relevant to patient safety (rating of 3 or greater). The content validity index was measured by percentage reviewer agreement for each item and for the total 45-item instrument. Across the in- strument, the content validity index equaled 0.74; a score of 0.78 or better indicates good content validity (Polit, Beck, & Owen, 2007). We then conducted principal
  • 38. components analysis, using an orthogonal rotation, to determine the underlying structure for the 12 retained measures; this produced a four-component solution that was evaluated as adequate using four criteria: eigenvalue >1, variance, scree plot, and residuals. In this study, factor loadings ranged from .414 to .798, with an average of .631, generally considered very good (Comrey & Lee, 1992; Fleury, 1998). Aggregate factor scores created parsimony in variables tested; likewise, an additional strength of this technique is that, because factors are orthogonal, the factor scores are nearly uncorrelated and can be used in July–September � 2009264 Health Care Management REVIEW 9Copyright @ 200 Lippincott Williams & Wilkins. Unauthorized reproduction of this article is prohibited. regression analyses without producing multicollinearity among the subsets of variables (Tabachnick & Fidell, 2001). The four regression factor scores were used to represent patient safety practices in this study and were named ‘‘surveillance capacity,’’ ‘‘assessing patient needs,’’ ‘‘care procedures,’’ and ‘‘measuring processes.’’ Detailed information regarding this factor analysis has been published elsewhere (Thornlow, 2008). Hospital rates of occurrence for each of four indicators, infections due to medical care, decubitus ulcers, failure to rescue, and postoperative respiratory failure, were calcu- lated by applying the Patient Safety Indicator (PSI) soft- ware (version 3.0a) to the NIS data set (http://www. qualityindicators.ahrq.gov/psi_download.htm). These indi- cators were selected because prior research has suggested that these outcomes are potentially attributable to organi-
  • 39. zational characteristics (AHRQ, 2007; Romano, Geppert, Davies, Miller, Elixhauser, & McDonald, 2003), includ- ing nurse staffing (Aiken, Clarke, Sloane, Sochalski, & Silber, 2002; Blegen, Goode, & Reed, 1998; Kovner & Gergen, 1998; Lichting, Knauf, & Milholland, 1999; Needleman, Buerhaus, Mattke, Stewart, & Zelevinsky, 2002; Unruh, 2003) and care processes (Danks, 2006; Frantz, 2004; Gastmeier & Geffers, 2006; Kovner & Gergen, 1998; Lyder, 2003). In calculating rates, the PSI software generates an algorithm that uses the ICD-9-CM diagnosis and procedure codes, date of procedure, and pa- tient characteristics, including age, gender, and diagnosis- related group, to flag potentially preventable complications. In running the software, hospital-level risk-adjusted ratios with smoothing were calculated for the four patient safety indicators. The smoothing process applies shrinkage fac- tors to reflect a reliability adjustment unique to each in- dicator. The less reliable the PSI is over time and across hospitals, the more the estimate shrinks the PSI toward the overall mean. The resulting rate appears ‘‘smoother,’’ or more conservative than the raw rate, and random year- to-year fluctuations in performance are likely to be re- duced (AHRQ, 2007). Data Analysis Univariate and multivariate regression analyses were conducted at the hospital level; each PSI outcome was analyzed separately. Moderate to strong statistically significant correlations existed among the raw, risk- adjusted, and smoothed rates for each PSI; therefore, all analyses were conducted on smoothed PSI outcome rates as smoothed rates had been reported in similar studies (Miller et. al., 2005; Thornlow & Stukenborg, 2006). Although we tested its association with patient outcomes, overall accreditation score was not significant
  • 40. in either univariate or multivariate regression analyses and was thus not included in further testing. To com- plete hypothesis testing, final regression models were built using variables that were hypothesized to be significant a priori; variables found to be significantly associated with patient outcomes in preliminary univar- iate regression analyses ( p < .05) or in preliminary multivariate regression analysis ( p < .05) were included in the final multivariate models. Findings Most of the 115 hospitals included in the sample were classified as urban (n = 78), nonteaching (n = 88), and not-for-profit (n = 76); almost half were considered large institutions (n = 56) and approximately 43 hospitals (37%) were located in the South (Table 1). Study sample hospitals differed from the 2002 NIS sample in that the study sample had fewer small hospitals, fewer rural hospitals, fewer government nonfederal hospitals, and fewer hospitals located in the Midwest than the national NIS sample did. No differences in teaching status existed between the 2002 NIS sample and the study sample (Table 1). The A-ADC of study hospitals ranged from 10 to 1,397 patients per day (M = 265.59, SD = 247.68) with an average nurse ratio of 1.18 RN full-time equivalents (SD = 0.44). Overall accreditation scores ranged from 83 to 99 on a scale of 100 (M = 92.3, SD = 3.68). Hospital risk-adjusted (smoothed) rates for the patient safety indicators ranged from 1.8 cases of infection per 1,000 discharges (0.0018) to 9.8 cases of postoperative respiratory failure per 1,000 elective sur- gical discharges (0.0098) to 21.5 incidences of decubitus ulcers per 1,000 discharges (0.0215) to 133.9 cases of failure to rescue, or deaths, per 1,000 discharges among
  • 41. patients who developed potentially preventable compli- cations during their hospital stay (0.1339). These rates are comparable to 2002 national rates for these indi- cators (http://hcupnet.ahrq.gov/; Table 2). Overall, three of the four multivariate models attained significance. Results are shown for the preliminary multivariate regression models rather than for the final multivariate regression models because no appreciable differences were noted in the strength or direction of relationships or amount of variance explained between the preliminary and final multivariate models (Table 3). Hospital system characteristics and patient safety practices accounted for 21.9% of the adjusted variance in hospital rates of infection ( p = .000), 13.0% of the adjusted variance in hospital rates of postoperative respiratory failure ( p = .011), and 8.9% of the adjusted variance in hospital rates of decubitus ulcers ( p = .029). None of the models significantly explained variance in hospital rates of failure to rescue ( p = .436). Hospital system characteristics were not consistently associated with patient outcomes in either univariate or multivariate regression analyses (Table 3). Although not hypothesized to be significant a priori, larger hospitals Safety Practices and Patient Outcomes 265 9Copyright @ 200 Lippincott Williams & Wilkins. Unauthorized reproduction of this article is prohibited. had higher rates of infections due to medical care and postoperative respiratory failure than did smaller hos- pitals, but no differences were noted by hospital size in
  • 42. either failure to rescue or decubitus ulcers. And when compared with not-for-profit and government nonfed- eral hospitals, for-profit hospitals exhibited higher rates of decubitus ulcers and postoperative respiratory fail- ure, but no differences were noted by ownership for rates for failure to rescue or infections due to medical care. No differences in hospital patient safety indicator rates were noted by teaching status or levels of nurse staf- fing (Table 3). Utilization of patient safety practices, as measured by accreditation standards, was significantly associated with two of the four patient safety outcomes in both univariate and multivariate analyses. Hospitals with poorer performance using the patient safety practice ‘‘assessing patient needs’’ (Subscore 2) had higher rates of infection due to medical care than did hospitals with better performance using that practice, and hospitals with poorer performance using ‘‘care procedures’’ (Sub- score 3) had higher rates of decubitus ulcers than did hospitals with better performance using that patient safety practice. Utilization of patient safety practices was not associated with hospital rates of postoperative respiratory failure or failure to rescue in either univariate or multivariate analyses. Discussion In this study, hospital system characteristics did not consistently explain patient outcomes, echoing previous findings in which associations varied depending on the outcome measured (Baker et al., 2002; Romano et al., 2003; Thornlow & Stukenborg, 2006). In this study, larger hospitals demonstrated higher rates of adverse events than smaller hospitals did, but for only two of the four
  • 43. indicators analyzed: infections due to medical care and postoperative respiratory failure. Perhaps, increased con- tact from a larger number of staff increases the probability of cross-contamination and infection; likewise, the need for interdisciplinary communication among the many pro- viders in a large hospital may predispose such institutions to higher rates of postoperative respiratory failure than in a Table 1 Comparison of study sample hospitals to NIS sample hospitals Study hospitals (sample, n = 115) National sample hospitals (NIS, n = 995) Difference between study and national samples Hospital characteristics n % n % �2 Hospital teaching status 2.76 Nonteaching 88 76.5 729 82.8 Teaching 27 23.5 151 17.2 Hospital ownership (five categories) 17.34** Government or private, collapsed 49 42.6 290 33.0 Government, nonfederal (public) 9 7.8 193 21.9 Private, collapsed 27 23.5 168 19.1 Private, not-for-profit 19 16.5 103 11.7 Private, investor owned 11 9.6 126 14.3
  • 44. Hospital location 8.68** Rural 37 32.2 411 46.7 Urban 78 67.8 469 53.3 Hospital bed size 22.13*** Small 20 17.4 343 39.0 Medium 39 33.9 255 29.0 Large 56 48.7 282 32.1 Hospital region 9.75* Northeast 24 20.9 112 12.7 Midwest 22 19.1 262 29.8 South 43 37.4 340 38.6 West 26 22.6 166 18.9 Note. NIS = Nationwide Inpatient Sample. *Significant at p < .05. **Significant at p < .01. ***Significant at p < .001. July–September � 2009266 Health Care Management REVIEW 9Copyright @ 200 Lippincott Williams & Wilkins. Unauthorized reproduction of this article is prohibited. Table 2 Descriptive statistics for study sample hospitals (n = 115) Variable Operational definition Mean SD 2002 National
  • 45. PSI rate Nurse staffing Measured as the ratio of RN full-time equivalents to A-ADC 1.18 0.44 – A-ADC Hospital size was measured as A-ADC. A-ADC reflects the average number of both inpatients and outpatients treated at the hospital on a daily basis. 265.59 247.68 – Overall score This score is derived from an assessment of an organization’s compliance with all applicable Joint Commission standards at the time of the full triennial accreditation survey. Score is based on a scale of 0 to 100, with 100 representing the highest score. 92.30 3.68 – Decubitus ulcer (n = 115 hospitals) Decubitus ulcer development per 1,000 discharges in lengths of stay of five or more days. Excludes patients with paralysis, diseases of the skin, subcutaneous tissue, and breast. Excludes obstetrical admissions and admissions from long-term care.
  • 46. 0.0215 (21.50) 0.01 (23.63) Failure to rescue (n = 99 hospitals) Deaths per 1,000 discharges among patients who develop potentially preventable complications during their hospital stay. Excludes patients transferred in or out, patients admitted from long-term care, neonates, and patients over 74 years. 0.1339 (133.90) 0.02 (129.37) Selected infections due to medical care (n = 115 hospitals) Rate per 1,000 discharges of infections due to medical care, primarily those related to intravenous lines and catheters. Defined by including cases based on secondary diagnosis associated with the same admission. Excludes patients with potentially immunocompromised states (e.g., AIDS and cancer). 0.00181 (1.81) 0.00 (1.53) Postoperative respiratory failure (n = 100 hospitals)
  • 47. Rates of postoperative respiratory failure per 1,000 elective surgical discharges. Limits code to secondary diagnoses to eliminate respiratory failure that was present on admission. Excludes patients who have major respiratory or circulatory disorders. Limits the population at risk to elective surgery patients. 0.0098 (9.80) 0.00 (7.97) Variable Operational definition Median SD Cronbach’s � Patient safety practices/ subscores Subscore 1 (surveillance capacity) Reassessment procedures Implementation of patient safety plans �0.2754 1 .510 Orientation, training staff Assessing staff competency (continues) Safety Practices and Patient Outcomes 267 9Copyright @ 200 Lippincott Williams & Wilkins. Unauthorized reproduction of this article is prohibited. smaller hospital. Additional research is needed to examine why larger hospitals demonstrated higher rates for these patient outcomes.
  • 48. For-profit hospitals had higher rates of adverse events than did not-for-profit and nonfederal government hospitals, but again, for only two of four indicators: decubitus ulcer and postoperative respiratory failure. Reasons for these findings are unclear yet support those of other studies where for-profit hospitals had higher rates of postoperative pneumonia, pulmonary compro- mise (Kovner & Gergen, 1998), postoperative respira- tory failure, and decubitus ulcers (Romano et al., 2003) than other hospital types did. For-profit and not-for- profit hospitals may differ in the types of resources used Table 3 Multivariate regression analysis: relationship of hospital systems and utilization of patient safety practices to patient safety outcomes Standardized � coefficients Decubitus ulcer Failure to rescue Infection due to medical care Postoperative respiratory failure Hospital characteristics Western region .09 .13 .16 .00 Urban location .07 �.01 .04 .11 Hospital size (A-ADC) .17 .17 .30* .36*
  • 49. Teaching hospital .05 �.11 .08 �.02 For-profit owner .24* .04 .02 .32* RN staffing (FTE/A-ADC) �.05 �.08 .12 �.16 Patient safety practices Subscore 1: surveillance capacity .03 .10 �.13 �.09 Subscore 2: assessing patients �.04 .06 .25* .07 Subscore 3: care procedures .27** �.12 �.10 .07 Subscore 4: measuring process .11 .19 �.15 .11 F test 2.12 1.11 4.20 2.48 Model significance .03* .44 .00*** .01* R2 .17 .10 .29 .22 Adjusted R2 .09 .00 .22 .13 Note. A-ADC = adjusted average daily census; FTE = full-time equivalent. *Significant at p < .05. **Significant at p < .01. ***Significant at p < .001. Table 2 Continued Variable Operational definition Median SD Cronbach’s � Subscore 2 (assessing patient needs) Initial assessment �0.1212 1 .533 Availability of patient-specific information Medication use Subscore 3 (care procedures)
  • 50. Infection control 0.0611 1 .096 Planning and providing care Operative procedures Subscore 4 (measuring processes) Patient and family education �0.2055 1 .024 Measurement of processes and outcomes Note. A-ADC = adjusted average daily census; PSI = Patient Safety Indicator. July–September � 2009268 Health Care Management REVIEW 9Copyright @ 200 Lippincott Williams & Wilkins. Unauthorized reproduction of this article is prohibited. to detect early signs of respiratory distress in postoper- ative patients, such as pulse oximetry or capnography, or in the equipment used to prevent pressure sores, such as specialty beds and/or mattresses. Further study may illuminate these differences. Similarly, accreditation standards specific to patient safety processes did not appear related to all four outcomes analyzed in this study. Rates of infections and decubitus ulcers occurred more frequently in hospitals with poorer performance in utilizing patient safety practices, but no differences were noted in rates of postoperative respiratory failure or failure to rescue. One possible explanation suggests that infections and decubitus ulcers may be more amenable to the implementation of policies and proce- dures targeted to prevent their occurrence. Additional research is needed to determine whether patient safety practices geared toward the more complicated problems,
  • 51. failure to rescue and postoperative respiratory failure, are equally as effective in reducing these events. Our measurement approach constitutes only one way of conceptualizing patient safety practices and assumes that such practices can be measured by JC accreditation standards. In reality, these standards may not measure those practices and procedures that are most important for ensuring safe patient care. That we found associations for only two of the four indicators and that previous stud- ies reported no association between JC survey assessments and other measures of quality and patient outcomes (Chen, Rathore, Radford, & Krumholz, 2003; Miller et al., 2005) suggest the limitation in this approach. It may be that variables crafted to measure nursing sur- veillance, critical thinking, leadership, communication, and collaboration would more effectively gauge the ef- fects of patient safety practices, especially for the more complicated outcomes failure to rescue and postoperative respiratory failure. Research examining the relationship of these patient safety attributes to adverse events is war- ranted and, if found to be significant, suggests the possible need to modify accreditation standards. Certain limitations exist in this study, including that most administrative data used for secondary analysis consist of data initially collected for other purposes (Zhan & Miller, 2003) and may thus carry potential bias in detecting certain types of patient safety events due to ICD-9-CM coding limitations. Additional concerns exist when calculating severity of illness (Lawthers et al., 2000; Zhan & Miller, 2003); however, the AHRQ Comorbidity Method, which was used in this study to risk adjust patient characteristics, was formulated to be used in conjunction with the PSI software and is designed to be used with administrative data
  • 52. (Elixhauser, Steiner, Harris, & Coffey, 1998). As noted earlier, the hospitals in this study are smaller, less rural, less likely to be government or nonfederal hospitals, and less likely to be located in the Midwest than are hospitals in the national sample. These differences probably related to the need to match medical–surgical hospitals in the 2002 NIS database with hospitals that were surveyed by the JC in 2002. It has been reported that smaller and more rural hospitals are less likely to participate in JC surveys (Miller et al., 2005). The factor analysis was effective in reducing the number of accreditation items determined to be most relevant to patient safety by the external panelists; however, the low reliability coefficients for Subscores 3 and 4 may indicate low intercorrelation among factored items (Table 2). The significant influence of Subscore 3 on decubitus ulcers was likely due to one item, ‘‘planning and providing patient care,’’ which was the only item that attained significance when the three individual items replaced the aggregate factor score in post hoc regression analysis. When individual items, rather than aggregate scores, were included in post hoc regression models, these items continued to demonstrate nonsig- nificant relationships with outcomes. Practice Implications The relationship between the utilization of patient safety practices and patient outcomes has not been well studied, which makes it difficult for hospitals to identify mod- ifications needed to improve patient outcomes. Our find- ings suggest that certain adverse events, such as infections and decubitus ulcers, may be reduced by preventive protocols that are reflected in accreditation standards, whereas other events, such as failure to rescue and
  • 53. postoperative respiratory failure, may require multifaceted strategies that are less easily translated into protocols. To illustrate, research has shown that decubitus ulcers can be prevented or treated successfully when evidence-based care, such as identifying patients at risk and reducing pressure over bony prominences, is provided (Armstrong & Bortz, 2001; Cullum, McInnes, & Bell-Syer, 2004; Frantz, 2004; Lyder, 2003). Employing procedures such as the Guidelines for the Prevention and Treatment of Pressure Ulcers (Wound, Ostomy, Continence Nursing, 2003) in acute care hospitals is crucial because length of stay is almost twice as long for the patients who develop pressure ulcers as compared with patients who are at risk but do not develop pressures ulcers (Loan, Jennings, Brosch, Depaul, & Hildreth, 2003). Decubitus ulcers are significant in- dependent predictors of hospital costs, with the estimated cost of managing a single full-thickness pressure ulcer as high as $70,000 and the total cost for treatment of pressure ulcers in the United States estimated at $11 billion per year (Reddy, Gill, & Rochon, 2006; Redelings, Lee, & Sorvillo, 2005). Similarly, policies and procedures such as the Guide- lines for the Prevention of Intravascular Catheter-Related In- fections (O’Grady et. al., 2002) have been found effective Safety Practices and Patient Outcomes 269 9Copyright @ 200 Lippincott Williams & Wilkins. Unauthorized reproduction of this article is prohibited. in reducing catheter-related bloodstream infection rates (Behrenholtz, Pronovost, & Lipsett, 2004; Theaker, 2005). However, despite evidence that guidelines are
  • 54. effective, researchers have repeatedly demonstrated prob- lems with health care workers’ compliance to infection control policies and procedures, including compliance to hand hygiene measures (Larson, Albrecht, & O’Keefe, 2005; McKinley et al., 2005; Peterson & Walker, 2006). As many as 250,000 hospital-acquired venous catheter- related bloodstream infections occur annually in the United States, and treatment cost averages as much as $56,000 (O’Grady et al., 2002). Hospital-acquired in- fections not only increase costs but also increase mor- bidity, extend hospital stays, and are associated with significant increases in in-hospital mortality (Coffin & Zaoutis, 2005). In this study, hospitals using fewer patient safety practices demonstrated higher rates of infection and decubitus ulcers, suggesting that requisite policies and procedures were not followed. Applying evidence-based guidelines provides an efficient and cost-effective method for preventing these types of adverse events. Alternatively, failure to rescue and postoperative re- spiratory failure may reflect situations that require mul- tifaceted approaches that are less easily translated into protocols. Recently, however, hospitals have begun to institute practices such as rapid response teams that are designed to assist bedside staff to intervene upon early signs of patient deterioration. This study preceded the large-scale implementation of such protocols yet high- lights the importance of applying patient safety practices to prevent the occurrence of adverse events. The AHRQ quality and patient safety indicators have been identified as possible sources for expanded com- parative public reporting. Our measurement approach represents a potential method for assessing patient safety practices, using accreditation standards, and associating
  • 55. these practices with patient outcomes. Hospitals can employ a similar approach by running the AHRQ PSI software on their own inpatient discharge billing data to screen for potentially preventable adverse events and never events; to identify opportunities for improvement that may justify review of practices, policies, or procedures designed to prevent occurrence; and to benchmark their hospital rates to the national rates posted on the AHRQ Web site (http://hcupnet.ahrq.gov). Rates are also categorized by hospital type so that administrators can ascertain whether their hospital’s characteristics (e.g., ownership status and hospital size) may have influenced their adverse event rates. Such rate comparisons allow for introspection so that preventive measures, such as pressure relieving devices, improved infection control procedures, and interdisciplinary com- munication tools, can be instituted and evaluated for their impact on patient safety. Conclusion This study examined the association between hospital characteristics and the use of patient safety practices on patient outcomes. We found that certain hospital charac- teristics were significantly associated with some patient outcomes, but not others, and accreditation standards specific to patient safety practices did not appear related to all four outcomes studied. Certain adverse events, such as infections and decubitus ulcers, may be reduced through preventive procedures, whereas other events, such as failure to rescue and postoperative respiratory failure, may reflect situations that require multifaceted strategies that are less easily translated into protocols or less easily measured by accreditation standards.
  • 56. This study provides a useful reflection on the challenge of determining relationships between organizational characteristics and patient outcomes and highlights the need for additional inquiry regarding appropriate mea- surement of acute care processes, especially patient safety practices. Our measurement approach may have influ- enced the observed associations between protective safety practices and patient outcomes; however, it represents progress toward examining this relationship. With the continual addition of patient safety-related standards and National Patient Safety Goals into the JC accreditation process, more research is needed to determine whether these practices have impacted patient outcomes. Such research has the potential to be not only cost saving due to changes in reimbursement but also life saving for hospitalized patients. Acknowledgments The authors wish to thank other members of the dis- sertation committee, including Patricia Hollen, PhD, RN, FAAN; Arlene Keeling, PhD, RN; and William Knaus, MD. Special thanks to Ruth Anderson, PhD, RN, FAAN, who reviewed this manuscript. References Agency for Healthcare Research and Quality. (2007). Quality indicators: Guide to patient safety indicators. Rockville, MD: Agency for Healthcare Research and Quality. Retrieved October 10, 2007, from http://www.qualityindicators.ahrq. gov/psioverview Agency for Healthcare Research and Quality. (2008). Overview of the Nationwide Inpatient Sample (NIS). Retrieved September 13, 2008, from http://www.hcup.ahrq.gov/nisoverview
  • 57. Aiken, L., Clarke, S., Sloane, D., Sochalski, J., & Silber, J. (2002). Hospital nurse staffing and patient mortality, nurse burnout, and job dissatisfaction. JAMA, 288, 1987–1993. Armstrong, D., & Bortz, P. (2001). An integrative review of pressure relief in surgical patients. AORN Journal, 73(3), 645–648. Ayanian, J. Z., & Weissman, J. S. (2002). Teaching hospitals July–September � 2009270 Health Care Management REVIEW 9Copyright @ 200 Lippincott Williams & Wilkins. Unauthorized reproduction of this article is prohibited. and quality of care: A review of the literature. Milbank Quarterly, 80(3), 569–593. Baker, C. M., Messmer, P. L., Gyurko, C. C., Domagala, S. E., Conly, F. M., Eads, T. S., et al. (2002). Hospital owner- ship, performance, and outcomes: Assessing the state- of-the-science. Journal of Nursing Administration, 30(5), 227–240. Behrenholtz, S., Pronovost, P., & Lipsett, P. (2004). Eliminating catheter-related blood stream infections in the intensive care unit. Critical Care Medicine, 32(10), 2014–2020. Blegen, M., Goode, C., & Reed, L. (1998). Nurse staffing and patient outcomes. Nursing Research, 47(1), 43–50. Centers for Medicare and Medicaid Services. (2007). HHS
  • 58. reports to Congress on Value-Based Purchasing of Hospital Services by Medicare. Retrieved November 2007, from http://www.hhs.gov.news/press/2007/11/pr20071126a Chen, J., Rathore, S. S., Radford, M. J., & Krumholz, H. M. (2003). JCAHO accreditation and quality of care for acute myocardial infarction. Health Affairs, 22(2), 243–254. Coffin, S., & Zaoutis, T. E. (2005). Infection control, epi- demiology, and patient safety. Infectious Disease Clinics of North America, 19, 647–665. Comrey, A. L., & Lee, H. B. (1992). A first course in factor analysis. (2nd ed.). Hillsdale, NJ: Lawrence Erlbaum Asso- ciates Publishers. Cullum, N., McInnes, E., & Bell-Syer, S. E. M. (2004). Support surfaces for pressure ulcer prevention. Update of Cochrane Database of Systematic Reviews 2004(3):CD001735. Danks, L. A. (2006). Central venous catheters: A review of skin cleansing and dressings. British Journal of Nursing, 15(12), 650–654. Devereaux, P. J., Choi, P., Lachetti, C., Weaver, B., Schunemann, H., Haines, T., et al. (2002). A systematic review and meta-analysis of studies comparing mortality rates of private for-profit and private not-for profit hospitals. Canadian Medical Association Journal, 166, 1399–1406. Donabedian, A. (1966). Evaluating the quality of medical care. Milbank Memorial Fund Quarterly, 44(3, Suppl. 1), 66–206. Elixhauser, A., Steiner, C., Harris, D. R., & Coffey, R. M. (1998). Comorbidity measures for use with administrative
  • 59. data. Medical Care, 36(1), 8–27. Fleury, J. (1998). The index of self-regulation; Development and psychometric analysis. Journal of Nursing Measurement, 6(1), 3–17. Frantz, R. A. (2004). Evidence-based protocol: Prevention of pressure ulcers. Journal of Gerontological Nursing, 30(2), 4–11. Gastmeier, P., & Geffers, C. (2006). Prevention of catheter- related bloodstream infections: Analysis of studies pub- lished between 2002 and 2005. Journal of Hospital Infection, 64(4), 326–335. Joint Commission on Accreditation of Healthcare Organiza- tions. (2003). Facts about patient safety. Retrieved August 18, 2004, from http://www.jcaho.org Kizer, K. W., & Blum, L. N. (2005). Safe practices for better health care. In Advances in patient safety: From research to implementation. Volumes 1–4 (AHRQ Publication No. 050021; 1–4). Rockville, MD: Agency for Healthcare Research and Quality. Kovner, C., & Gergen, P. J. (1998). Nurse staffing levels and adverse events following surgery in U.S. hospitals. Image: Journal of Nursing Scholarship, 30(4), 315–321. Kupersmith, J. (2005). Quality of care in teaching hospitals: A literature review. Academic Medicine, 80(5), 458–466. Larson, E. L., Albrecht, S., & O’Keefe, M. (2005). Hand hygiene behavior in a pediatric emergency department and a pediatric intensive care unit: Comparison of use of 2 dispenser systems. American Journal of Critical Care, 14(4), 304–312.
  • 60. Lawthers, A., McCarthy, E., Davis, R., Peterson, L., Palmer, H., & Iezzoni, L. I. (2000). Identification of in-hospital com- plications from claims data: Is it valid? Medical Care, 38(8), 785–795. Leape, L., Berwick, D., & Bates, D. (2002). What practices will most improve safety? JAMA, 288(4), 501–507. Lehman, L., Puopolo, A., Shaykevich, S., & Brennan, T. (2005). Iatrogenic events resulting in intensive care admission: Frequency, cause, and disclosure to patients and institutions. American Journal of Medicine, 118, 409–413. Lichting, L. K., Knauf, R., & Milholland, D. K. (1999). Some impacts of nursing on acute care hospital outcomes. Journal of Nursing Administration, 29(2), 25–33. Loan, L. A., Jennings, B. M., Brosch, L. R., Depaul, D., & Hildreth, P. (2003). Indicators of nursing care quality: Findings from a pilot study. Outcomes Management, 7(2), 51–58 Lyder, C. H. (2003). Pressure ulcer prevention and manage- ment. JAMA, 289(2), 223–226. Mayberry, L. J., & Gennarro, S. (2001). A quality of health outcomes model for guiding obstetrical practice. Journal of Nursing Scholarship, 33, 141–146. McKinley, R., Gillepsie, W., Kraus, J., Harrison, S., Medeiros, R., Hawkins, et al. (2005). Focus group data as a tool in assessing effectiveness of a hand hygiene campaign. American Journal of Infection Control, 33(6), 368–373. Miller, M. R., Pronovost, P., Donithan, M., Zeger, S., Zhan, C.,
  • 61. Morlock, L., et al. (2005). Relationship between performance measurement and accreditation: Implications for quality of care and patient safety. American Journal of Medical Quality, 20(5), 239–252. Mitchell, P., Ferketich, S., & Jennings, B. (1998). Quality Health Outcomes Model: American Academy of Nursing Expert Panel on Quality Health Care. Journal of Nursing Scholarship, 30, 43–46. Needleman, J., Buerhaus, P., Mattke, S., Stewart, M., & Zelevinsky, K. (2002). Nurse-staffing levels and the quality of care in hospitals. New England Journal of Medicine, 346, 1715–1722. Nordgren, L. D., Johnson, T., Kirschbaum, M., & Peterson, M. L. (2004). Medical errors: Excess hospital costs and lengths of stay. Journal for Healthcare Quality, 26(2), 42–48. O’Grady, N. P., Alexander, M., Dellinger, P., Gerberding, J., Heard, S., Maki, D., et al. (2002). Guidelines for the pre- vention of intravascular catheter-related infections. Infection Control and Hospital Epidemiology, 23(12), 759–769. Peterson, A. M., & Walker, P. H. (2006). Hospital-acquired infections as patient safety indicators. Annual Review of Nursing Research, 24, 75–99. Polit, D. F., Beck, C. T., & Owen, S. V. (2007). Is the CVI an acceptable indicator of content validity? Appraisal and recommendations. Research in Nursing and Health, 30(4), 459–467. Radwin, L., & Fawcett, J. (2002). A conceptual model-based program of nursing research: Retrospective and prospective
  • 62. applications. Journal of Advanced Nursing, 40, 355–360. Safety Practices and Patient Outcomes 271 9Copyright @ 200 Lippincott Williams & Wilkins. Unauthorized reproduction of this article is prohibited. Reddy, M., Gill, S. S., & Rochon, P. A. (2006). Preventing pressure ulcers: A systematic review. JAMA, 296, 974–984. Redelings, M. D., Lee, N. E., & Sorvillo, F. (2005). Pressure ulcers: More lethal than we thought? Advances in Skin & Wound Care, 18(7), 367–372. Rojas, M., Silver, A., Llewellyn, C., & Rances, L. (2005). Study of adverse occurrences and major functional impairment following surgery. In Advances in patient safety: From research to implementation. Volumes 1–4 (AHRQ Publication No. 050021; 1–4). Rockville, MD: Agency for Healthcare Research and Quality. Romano, P. S., Geppert, J. J., Davies, S., Miller, M. R., Elixhauser, A., & McDonald, K. M. (2003). A national profile of patient safety in US hospitals. Health Affairs, 22(2), 154–165. Shojania, K., Duncan, B., McDonald, K., & Wachter, R. (2002). Safe but sound: Patient safety meets evidence- based medicine. JAMA, 288(4), 508–513. Sin, M., Belza, B., LoGerfo, J., & Cunningham, S. (2005). Eval- uation of a community-based exercise program for elderly Korean immigrants. Public Health Nursing, 22(5), 407–413.
  • 63. Stanton, M. (2004). Hospital nurse staffing and quality of care (Research in Action Issue 14. AHRQ Publication No. 04-0029). Rockville, MD: Agency for Healthcare Research and Quality. Tabachnick, B. G., & Fidell, L. S. (2001). Using multivariate statistics (4th ed.). Boston, MA: Allyn & Bacon. Theaker, C. (2005). Infection control issues in central venous catheter care. Intensive & Critical Care Nursing, 21(2), 99–109. Thomas, E., Studdert, D., Burstin, H., Orav, E., Zeena, T., Williams, E., et al. (2000). Incidence and types of adverse events and negligent care in Utah and Colorado. Medical Care, 38(3), 261–271. Thornlow, D. (2008). Relationship of patient safety practices to patient outcomes. Saarbrucken, Germany: VDM Publishing. Thornlow, D. K., & Stukenborg, G. J. (2006). The association between hospital characteristics and rates of preventable com- plications and adverse events. Medical Care, 44(3), 265–269. Unruh, L. (2003). Licensed nurse staffing and adverse events in hospitals. Medical Care, 41(1), 142–152. Wound, Ostomy, Continence Nursing (WOCN). (2003). Guidelines for the prevention and treatment of pressure ulcers. Retrieved April 1, 2005, from www.wocn.org Zhan, C., & Miller, M. (2003). Administrative data based patient safety research: A critical review. Quality and Safety in Health Care, 12(Suppl. 2), ii58–ii63. July–September � 2009272 Health Care Management REVIEW
  • 64. 9Copyright @ 200 Lippincott Williams & Wilkins. Unauthorized reproduction of this article is prohibited.