Outlook for Week of August 31, 2020
•
0 likes•3,577 views

Free weekly newsletter with outlook and brief comments for world stock markets. Weekly reversal levels for stocks, gold and currencies. This method was designed to keep you on the right side of the market most of the time, letting the winners run while avoiding big losses.

Recommended
Recommended
More Related Content
More from LunaticTrader
More from LunaticTrader (17)
Recently uploaded
Recently uploaded (20)
Outlook for Week of August 31, 2020
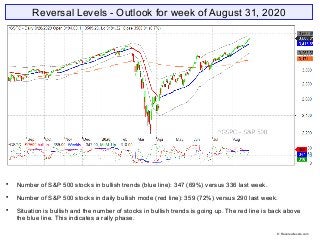
- 1. Reversal Levels - Outlook for week of August 31, 2020 Number of S&P 500 stocks in bullish trends (blue line): 347 (69%) versus 336 last week. Number of S&P 500 stocks in daily bullish mode (red line): 359 (72%) versus 290 last week. Situation is bullish and the number of stocks in bullish trends is going up. The red line is back above the blue line. This indicates a rally phase. © Reversallevels.com
- 2. ELC: up | BMO: up | Blue snake: up | Repellor: up. No change. Don’t fight the trend. If a top is being made then indicators will turn down. © Reversallevels.com S&P 500 Weekly chart
- 3. Partial profits signal for S&P 500. A 9.6 % gain in 12 weeks. Partial profits signal for China SSEC. A 15.7% gain in 12 weeks. Bonds TLT are weak bullish with downward MoM.. Gold is giving a partial profits signal. A 21% gain in 22 weeks. EURUSD stays in bullish trend. But the move is getting stretched with MoM in the +8 euphoric zone. Oil stays weak bullish. © Reversallevels.com Major indices
- 4. Sell signal for Chile IPSA. Bearish divergence for Russia RTS. Gold stocks XAU is our current best performer. It is up 46.3% since its Buy signal 19 weeks ago. World markets © Reversallevels.com
- 5. There are 3 new stocks coming into the Dow Industrials this week: AMGN, CRM and HON are replacing PFE, RTX and XOM. Buy signal for KO. 22 stocks bullish, up from 19 last week. Above 20 = bull market. See: Keeping an eye on the Dow stocks AAPL remains our current best performer. A 79.61% gain since its Buy signal 19 weeks ago and the move is ongoing. . 30 Dow Jones Industrials stocks © Reversallevels.com
- 6. Sell signals for USDINR and USDMXN. Speculative Buy signal for USDCHF. For daytraders or swing traders: if you do your trading in the direction of the weekly trend you are likely to do well in the long run. So, try to buy the pullbacks in currencies pairs that are in bullish trends and sell the rallies during bearish trends. Forex & Crypto © Reversallevels.com
- 7. On Twitter: http://twitter.com/lunatictrader1 On Stocktwits: http://stocktwits.com/LunaticTrader Website: Reversallevels.com For daily comments and questions you can find us here: © Reversallevels.com Disclaimer Investing in stocks, forex or commodities is risky. No guarantee can be given that the opinions or predictions given in this presentation will be correct. Reversallevels.com cannot in any way be responsible for eventual losses you may incur if you trade based on the given information. Simulated trading programs in general are subject to the fact that they are designed with the benefit of hindsight. No representation is being made that any account will or is likely to achieve profits or losses similar to those shown. Trade at your own risk and responsibility. Subscription service Daily reversal levels for over 3000 stocks and ETF are available by monthly subscription. For less than $1 a day you can become a more efficient investor: 1 Month ($22) 6 Months ($110) 1 Year ($199) Comes with full instructions and strategies for using the reversal levels and MoM indicator in your own trading. This is an honest method with limited risk, not a get rick quick formula. Give it a try.