New global indicator for workers' health - BLT.23.289703 (1).pdf
1. Bull World Health Organ 2023;101:418–430Q |doi: http://dx.doi.org/10.2471/BLT.23.289703
Policy & practice
418
Introduction
Countries have made policy commitments through the
sustainable development goals (SDGs) to ensure health and
promote decent work for all.1
SDG targets 3.9 and 8.8 are to
“substantially reduce the number of deaths and illnesses from
hazardous chemicals and air, water and soil pollution and
contamination” and “promote safe and secure working envi-
ronments for all workers.” Countries have committed to work-
ers’ health through the World Health Organization (WHO)
Strategy on health, environment and climate change;2
the Pan
American Health Organization plan of action on workers’ health
2015–2025;3
International Labour standards on occupational
safety and health;4
and the International Labour Organization
(ILO) Framework of fundamental principles and rights at work.5
Achieving these targets requires preventing exposure to
occupational risk factors, and reducing the burden of disease
that is attributable to unhealthy and indecent working condi-
tions. To track progress, the work-related burden of disease
must be monitored in global, regional and national systems
for surveillance of workers’ health and progress on sustain-
able development.
Health indicators are “summary measures that capture
relevant information on different attributes and dimensions
of health status.”3
Indicators of workers’ health have received
little research and policy attention, despite their importance
in the health, labour and economic development sectors.6,7
The only such indicator commonly included in official moni-
toring systems is occupational injuries. The global indicator
framework for the SDGs tracks the burden of injuries with
indicator SDG 8.8.1 (fatal and non-fatal occupational injuries
a
Department of Environment, Climate Change and Health, World Health Organization, Avenue Appia 20, 1211 Geneva 27, Switzerland.
b
Department of Healthier Populations, World Health Organization Regional Office for the Eastern Mediterranean, Amman, Jordan.
c
Department of Data and Analytics, World Health Organization, Geneva, Switzerland.
d
Climate Change, Health and Environment, World Health Organization Regional Office for Africa, Brazzaville, Congo.
e
Division of Healthy Environments and Populations, World Health Organization Regional Office for the Western Pacific, Manila, Philippines.
f
Department of Occupational and Environmental Medicine, Epidemiology and Hygiene, Italian National Institute for Insurance against Accidents at Work, Rome, Italy.
g
Department of Health Promotion and Social Determinants, Pan American Health Organization, Washington DC, United States of America.
h
Department of Healthier Populations and Noncommunicable Diseases, World Health Organization Regional Office for South-East Asia, New Delhi, India.
i
Directorate for Communication and European and International Relations, Ministry of Health, Rome, Italy.
j
Center for Environmental and Occupational Health, Ministry of Health and Medical Education, Tehran, Islamic Republic of Iran.
k
World Health Organization European Centre for Environment and Health, Bonn, Germany.
l
National Institute for Occupational Health, Johannesburg, South Africa.
m
Healthier Population Unit, World Health Organization Country Office, Tehran, Islamic Republic of Iran.
n
National Institute for Occupational Health and Poison Control, Chinese Center for Disease Control and Prevention, Beijing, China.
Correspondence to Frank Pega (email: pegaf@who
.int).
(Submitted: 23 January 2023 – Revised version received: 31 March 2023 – Accepted: 11 April 2023 – Published online: 1 May 2023)
New global indicator for workers’health: mortality rate from diseases
attributable to selected occupational risk factors
Frank Pega,a
Rola Al-Emam,b
Bochen Cao,c
Cynthia W Davis,d
Sally J Edwards,e
Diana Gagliardi,f
Anaclaudia Gastal Fassa,g
Mohd N Hassan,h
Ahmad Reza Hosseinpoor,c
Sergio Iavicoli,i
Jaffar Jandaghi,j
Dorota I Jarosinska,k
Spo M Kgalamono,l
Mona Khaleghy Rad,m
Mostafa Khodabakshi,j
Xinxin Li,n
Alessandro Marinaccio,f
Guy Mbayo,d
Zohreh Rowshani,j
Natasha M Sanabria,l
Kerry Sidwell-Wilson,k
Orielle H Solar,g
Kai N Streicher,a
Xin Sun,n
Rahim Taghizadeh Asl,m
Mehrdad Yadegari,m
Siyu Zhang,n
Muzimkhulu Zungul
& Natalie C Momena
Abstract Through sustainable development goals 3 and 8 and other policies, countries have committed to protect and promote workers’
healthbyreducingthework-relatedburdenofdisease.Tomonitorprogressonthesecommitments,indicatorsthatcapturethework-related
burden of disease should be available for monitoring workers’health and sustainable development.TheWorld Health Organization and the
International Labour Organization estimate that only 363283 (19%) of 1879890 work-related deaths globally in 2016 were due to injuries,
whereas 1516607 (81%) deaths were due to diseases. Most monitoring systems focusing on workers’health or sustainable development,
such as the global indicator framework for the sustainable development goals, include an indicator on the burden of occupational injuries.
Fewsuchsystems,however,haveanindicatorontheburdenofwork-relateddiseases.Toaddressthisgap,wepresentanewglobalindicator:
mortality rate from diseases attributable to selected occupational risk factors, by disease, risk factor, sex and age group. We outline the
policy rationale of the indicator, describe its data sources and methods of calculation, and report and analyse the official indicator for 183
countries.We also provide examples of the use of the indicator in national workers’health monitoring systems and highlight the indicator’s
strengths and limitations. We conclude that integrating the new indicator into monitoring systems will provide more comprehensive and
accurate surveillance of workers’health, and allow harmonization across global, regional and national monitoring systems. Inequalities in
workers’health can be analysed and the evidence base can be improved towards more effective policy and systems on workers’health.
2. 419
Bull World Health Organ 2023;101:418–430Q|doi: http://dx.doi.org/10.2471/BLT.23.289703
Policy & practice
New global indicator for workers’health
Frank Pega et al.
per 100000 workers, by sex and migrant
status).8,9
Data on fatal occupational
injuries for the indicator were reported
by 35 countries for 2016.
In 2021, WHO and the ILO pub-
lished the first WHO/ILO joint estimates
of the work-related burden of disease
and injury.10–13
According to these es-
timates for 2016, only 363 283 (19%)
out of 1 879 890 global work-related
deaths were due to injuries, while the
majority, 1516607 (81%), were due to
work-related diseases.10
To assess prog-
ress towards agreed targets for workers’
health, the burden of mortality from
work-related diseases also needs to be
tracked. WHO’s Thirteenth General
Programme of Work, approved by the
Seventy-First World Health Assembly
of the 194 WHO Member States,14
man-
dates WHO to promote and improve the
monitoring of work-related diseases.15
To address this gap, we describe
a new global indicator: mortality rate
from diseases attributable to selected
occupational risk factors, by disease, risk
factor, sex and age group. The need for
such an indicator has been recognized
for several years (Fig. 1). In 2019, WHO
and the ILO proposed that an indicator
be added to the global indicator frame-
work for the SDGs9
to capture deaths
from work-related diseases (WHO and
the ILO, Proposal: indicator 8.8.3: mor-
tality rate from diseases attributed to
occupational risk factors, by disease, risk
factor, sex, and age group: submission to
the Interagency and Expert Group on
SDG Indicators, personal communica-
tion, 2019). We outline the methods and
data sources for calculating this indica-
tor from the WHO/ILO joint estimates.
We also report the indicator calculated
for 183 countries, and apply it to analyse
the global and regional epidemiology
and socioeconomic inequalities of fatal
work-related diseases. Additionally, we
present country case studies on the in-
tegration of the indicator into national
workers’ health monitoring systems, and
highlight the strengths and limitations
of the tool.
Calculating the indicator
Data sources
To calculate the indicator (the mortal-
ity rate), we required two data sets: the
number of deaths from diseases attribut-
able to selected occupational risk factors
(the numerator); and the working-age
population, defined here as age 15 years
and older (the denominator).10,11
We ob-
tained these data for population cohorts
defined by country (183 countries),
region (six WHO Regions), sex (female,
male, total) and age (≥15, 15–19, 20–24,
…, 90–94, ≥95 years) in the years 2000,
2010 and 2016.
We sourced the number of deaths
from diseases attributable to selected
occupational risk factors from the
United Nations’ official estimates of
the work-related burden of disease: the
WHO/ILO joint estimates.10–13,16,17
These
data comprise estimates of the burden
attributable to 21 pairs of occupational
risk factor and disease (Table 1).
These exposure–disease pairings are
those for which evidence has been
systematically reviewed and judged by
WHO and the ILO to be sufficient to
produce official estimates that fulfil the
strict statistical requirements of both
organizations.10–13,18
All diseases covered
are noncommunicable diseases within
three groups: malignant neoplasms (17
Fig. 1. Timeline of policy commitments to the new global indicator for work-related burden of disease
Policy
commitments to
the use of the
indicator
Use of the indicator in
monitoring systems
2016 2017 2018 2019 2020 2021 2022 2023
September 2016
WHO and the ILO
establish the
WHO/ILO joint
estimates to
improve workers’
health indicators
May 2018
The Seventy-first
World Health
Assembly
approves
WHO’s Global
Programme of
Work 13,
mandatingWHO
to promote and
improve
monitoring and
surveillance for
work-related
diseases
February 2019
Bangladesh calls
for the addition of
an indicator on
occupational
diseases to the
global indicator
framework for the
SDGs at the
Fiftieth Statistical
Commission
September 2021
In their global monitoring report,
WHO and the ILO introduce the
potential for theWHO/ILO joint
estimates to be used to produce the
indicator
April 2022
WHO uses the indicator in theWHO
health and environment scorecards
for 67 countries covering all regions
May 2023
The indicator is made available open
access through theWHO
Occupational Burden of Disease
Application for 183 countries
covering all regions
March 2019
WHO and the
ILO sign an
agreement to
collaborate on
theWHO/ILO
joint estimates
April 2021
Eurostat produces
the European
occupational
diseases statistics,
experimental
statistics on
occupational
disease cases,
for 25 countries
in the European
Region
August 2019
WHO and the ILO
propose to the
Interagency and
Expert Group on
SDG Indicators
that the indicator
be added to the
global indicator
framework for
the SDGs
June 2021
The European
Commission
pledges in the
EU strategic
framework on
health and safety
at work
2021-2027 to
collaborate with
WHO, the ILO and
Member States
towards the new
indicator and its
inclusion in the
global indicator
framework for the
SDGs
ILO: International Labour Organization; SDGs: sustainable development goals; WHO: World Health Organization.
3. 420 Bull World Health Organ 2023;101:418–430Q|doi: http://dx.doi.org/10.2471/BLT.23.289703
Policy & practice
New global indicator for workers’health Frank Pega et al.
exposure–disease pairs); respiratory
diseases (two pairs); and cardiovascular
diseases (two pairs).10
We downloaded
the data from the WHO Occupational
Burden of Disease Application.19
The data sources and methods
for the WHO/ILO joint estimates
are described elsewhere,11
but these
estimates are produced within an
established methodological framework:
the comparative risk assessment.20
This
framework results in estimates of work-
related burden of disease that can be
compared across diseases, risk factors,
geographical locations and population
cohorts.Countrieshaveapprovedseveral
SDG indicators produced under WHO
guardianship from the comparative risk
assessment framework.9
All estimates
adjust for occupational turnover using
WHO-approved methods: for example,
estimatesforrecentlyaddedpairs12
model
workers moving between employment
and unemployment or retirement using
longitudinal occupation data.21
Briefly,
for the 19 established exposure–disease
pairs (pairs number 1–19 in Table 1)
WHO and the ILO derived population-
attributable fractions from the 2017
Global Burden of Disease Study.16
These fractions quantify the proportion
of deaths from a particular disease
attributable to a specific risk factor. For
two additional exposure–disease pairs
(pairs number 20 and 21 in Table 1),
WHO and the ILO calculated the
population-attributable fractions based
on estimates of prevalence of exposure
to long working hours produced from
2324 national official surveys conducted
in 154 countries,12
and pooled risk
ratios from WHO/ILO systematic
reviews and meta-analyses.22–24
For
all 21 exposure–disease pairings, the
population-attributable fractions were
then applied to the WHO global health
estimates of the total number of deaths
from each disease25
to produce the
number of work-related deaths.
We sourced the denominator, total
population of working age (≥15 years),
from the United Nations’ official popu-
lation estimates: the 2019 Revision of
World Population Prospects.26
Calculation method
We calculated the total number of deaths
from diseases attributable to selected
occupational risk factors by summing
the estimates for the 21 individual
exposure–disease pairs (Table 1). We
then divided this number of deaths by
the total working-age population. We
calculated the indicator for national,
regional and global population cohorts
by sex and age group, using the follow-
ing formula:
MR
D
WP
= ×100 000 (1)
where MR is the mortality rate per
100 000 working-age population [dis-
ease, occupational risk factor, country,
sex, age], D is the number of deaths
[disease, occupational risk factor, coun-
try, sex, age] and WP is the number of
working-age population [country, sex,
age]. This calculation gave the final
indicator: mortality rate per 100 000
working-age population from diseases
attributable to selected occupational
risk factors, by disease, risk factor, sex
and age group. For each estimate, we
calculated 95% uncertainty ranges (UR)
using bootstrapping.27
Applying the indicator
By region and country
In Table 2 (available at https://www.who
.int/publications/journals/bulletin/) we
present the official indicator produced
by WHO for 183 countries for the years
2000, 2010 and 2016. The table illustrates
how applying the indicator provides
a comprehensive picture of the global
and regional patterns of mortality from
diseases attributable to selected occupa-
tional risk factors. The global mortality
rate was 27.7 deaths per 100000 work-
ing-age population for 2016 (95% UR:
26.8 to 28.5). Regional mortality rates
were highest in the South-East Asia Re-
gion (36.5 deaths per 100000 working-
age population; 95% UR: 34.3 to 38.8)
and the Western Pacific Region (32.2
Table 1. Pairings of occupational risk factors and diseases included in the new global
indicator for work-related burden of disease
Pair
no.
Risk factor Disease groupc
1 Occupational exposure to asbestosa
Trachea, bronchus and lung cancersd
2 Occupational exposure to asbestosa
Ovary cancerd
3 Occupational exposure to asbestosa
Larynx cancerd
4 Occupational exposure to asbestosa
Mesotheliomad
5 Occupational exposure to arsenica
Trachea, bronchus and lung cancersd
6 Occupational exposure to benzenea
Leukaemia
7 Occupational exposure to berylliuma
Trachea, bronchus and lung cancersd
8 Occupational exposure to cadmiuma
Trachea, bronchus and lung cancersd
9 Occupational exposure to chromiuma
Trachea, bronchus and lung cancersd
10 Occupational exposure to diesel engine
exhausta
Trachea, bronchus and lung cancersd
11 Occupational exposure to formaldehydea
Nasopharynx cancerd
12 Occupational exposure to formaldehydea
Leukaemiad
13 Occupational exposure to nickela
Trachea, bronchus and lung cancersd
14 Occupational exposure to polycyclic
aromatic hydrocarbonsa
Trachea, bronchus and lung cancersd
15 Occupational exposure to silicaa
Trachea, bronchus and lung cancersd
16 Occupational exposure to sulphuric acida
Larynx cancerd
17 Occupational exposure to
trichloroethylenea
Kidney cancerd
18 Occupational asthmagensa
Asthmae
19 Occupational particulate matter, gases and
fumesa
Chronic obstructive pulmonary diseasee
20 Exposure to long working hoursb
Strokef
21 Exposure to long working hoursb
Ischaemic heart diseasef
a
Defined as per the classification of the 2017 Global Burden of Disease Study.16
b
Defined as perWorld Health Organization (WHO) and International Labour Organization (ILO) joint
estimates of the work-related burden of disease and injury definition of ≥55 hours per week.12
c
Defined as perWHO burden of disease classification.17
d
Malignant neoplasm.17
e
Respiratory disease.17
f
Cardiovascular disease.17
4. 421
Bull World Health Organ 2023;101:418–430Q|doi: http://dx.doi.org/10.2471/BLT.23.289703
Policy & practice
New global indicator for workers’health
Frank Pega et al.
deaths per 100 000; 95% UR: 30.3 to
34.2), followed by the European Region
(27.3 deaths per 100000; 95% UR: 26.9
to 27.8; Table 2). Regional mortality
rates were lowest in the African Region
(11.4 deaths per 100000; 95% UR: 11.1
to 11.7), followed by the Region of the
Americas (18.1 deaths per 100 000;
95% UR: 17.7 to 18.5) and the Eastern
Mediterranean Region (21.8 deaths per
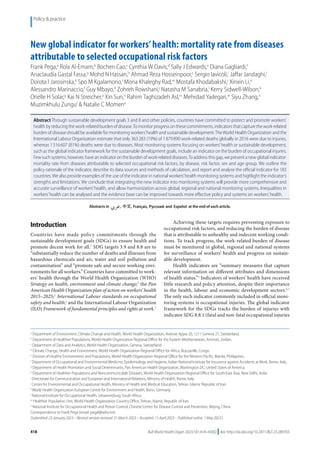
100 000; 95% UR: 20.7 to 23.0). Fig. 2
maps the mortality rate in the 183 coun-
tries for the year 2016.
By disease group
Of the three disease groups, cardio-
vascular diseases accounted for the
highest global work-related mortality
rate in 2016: 13.6 deaths per 100 000
working-age population (95% UR: 12.9
to 14.3).28
The corresponding mortality
rates were 5.3 deaths per 100000 (95%
UR: 5.2 to 5.4) for malignant neoplasms,
and 8.8 deaths per 100000 (95% UR: 8.4
to 9.1) for respiratory diseases. For the
African, Eastern Mediterranean, South-
East Asia and Western Pacific Regions,
the cardiovascular diseases group also
contributed most to the mortality rate
(Fig. 3). In contrast, work-related ma-
lignant neoplasms contributed most to
the mortality rates in the Region of the
Americas and European Region.
By occupational risk factor
The pattern of mortality rates by occupa-
tional risk factor corresponded to that by
disease group, since these are linked in
exposure–disease pairs (Table 1).28
Ex-
posure to long working hours contribut-
ed the largest proportion of deaths from
work-related diseases (corresponding to
cardiovascular diseases). Among the re-
gions, long working hours accounted for
the largest proportion of deaths in the
African, Eastern Mediterranean, South-
East Asia and Western Pacific Regions.
However, in the Region of the Americas
and European Region, occupational ex-
posure to carcinogens (corresponding to
malignant neoplasms) contributed the
largest proportion of deaths.
By sex
Males had a higher global mortality
rate attributed to work-related diseases
(40.1 deaths per 100 000 working-age
population; 95% UR: 38.6 to 41.5) than
did females (15.3 deaths per 100 000;
95% UR: 14.6 to 16.0).28
Mortality rates
for work-related diseases were higher for
males than females in all regions.
By age group
Global mortality rates from work-relat-
ed diseases were higher in older people
than in younger people, reflecting
general patterns of noncommunicable
disease.29
People aged 85–89 years had
the highest global mortality rate from
work-related diseases (246.9 deaths per
100000 population; 95% UR: 228.0 to
265.9), whereas the youngest age group
of 15–19 years had the lowest rate (0.1
deaths per 100 000; 95% UR: 0.1 to
0.1).28
When plotting the mortality rate
by 5-year age groups (combining those
≥65 years due to small numbers), the
highest rates were in the African Region
for the two youngest age groups and the
South-East Asia Region for all other
age groups. The lowest mortality rates
occurred in the European and Western
Pacific Regions, up to age 24–29 years,
above which the Region of the Americas
had the lowest age-specific rates.28
Trends
Between 2000 and 2016, the global mor-
tality rate from selected work-related
diseases decreased from 30.7 to 27.7 per
100000 population, a percentage change
of −9.8 (95% UR: −13.3 to −6.1; Table 2).
This change was driven by the mortal-
ity rate dropping between 2000 and
2010 (−9.1%; 95% UR: −12.4 to −5.6),
whereas between 2010 and 2016 there
was only a small decrease (−0.8%; 95%
UR: −4.7 to 3.2). Overall, between 2000
and 2016, the mortality rate decreased
in all regions, except South-East Asia
(1.6%; 95% UR: −6.6 to 10.3). The largest
decrease was observed for the Region of
the Americas and the Eastern Mediter-
ranean Region (−16.9%; 95% UR: −19.4
to −14.2, and −15.2%; 95% UR: −21.2 to
−9.0, respectively). Each region’s contri-
bution to the global mortality rate varied
over time with its population share of
the total mortality rate.
Policy implications
National monitoring
In 2008–2009, national information
systems for workers’ health existed in
51 (42%) out of 121 of countries.30
In
Table 3 we present case studies from
four countries across different regions,
describing their current monitoring
system for workers’ health and show-
ing how the new indicator could be
integrated into national information
systems.31–41
We also suggest potential
facilitators and barriers to the integra-
tion of the new indicator into national
monitoring systems, and its predicted
impact. The case studies suggest that the
new indicator would fill a gap in current
monitoring systems, and could serve as
an addition rather than a replacement
for existing indicators. Feedback from
country respondents demonstrated
that none of their monitoring systems
include the new indicator (Table 3).
Some countries already had similar
indicators, calculated using national
data sources and using various methods
that limit international comparability of
their indicators. For other countries, the
indicator could not be calculated from
currently available data.
Country respondents suggested
potential benefits of the indicator that
could facilitate its introduction into
monitoring systems (Table 3). Benefits
include providing additional informa-
tion to evaluate the occupational disease
burden, and generate greater awareness
of emerging occupational diseases.
The relevance and ready availability of
the indicator in the WHO/ILO joint
estimates is also a facilitator to its use.
Barriers to use of the indicator are the
need for countries to generate the indi-
cator themselves by collecting, linking
and analysing the necessary input data.
Several potential positive impacts
of the new indicator were mentioned
(Table 3). Country respondents sug-
gested that the indicator could improve
the monitoring of workers’ health
and strengthen the attribution of oc-
cupational and work-related diseases,
thereby potentially improving coverage
of workers’ compensation and therefore
the basic level of the social protection
floor. The indicator could also promote
awareness of occupational risk factors
and work-related diseases among health
policy-makers, and foster action within
the health and other sectors.
Next steps for countries could
include adoption of the indicator into
their national monitoring systems and
promotion of the indicator among their
networks, including national, regional
and global authorities responsible
for workers’ health and sustainable
development monitoring. Until
countries are able to collect their own
data for the number of work-related
deaths, they can use the WHO/ILO joint
estimates, as presented in this article.
Current estimates were published in
September 2021,10
but the indicator can
5. 422 Bull World Health Organ 2023;101:418–430Q|doi: http://dx.doi.org/10.2471/BLT.23.289703
Policy & practice
New global indicator for workers’health Frank Pega et al.
be produced annually, using updates to
the WHO estimates of the total number
of deaths per disease25
and population-
attributable fractions for occupational
risk factors.10–13
The indicator is also
available disaggregated by sex and age
group for monitoring health inequalities
among workers,42
ensuring that no one is
left behind in sustainable development.1
Global and regional monitoring
In Fig. 1 we show how the indicator
is already being integrated into global
and regional monitoring systems. At
the global level, WHO is using the
indicator in its environmental health
monitoring system,43
and making it
available open access via the WHO
Occupational Burden of Disease
Application.19
At the regional level, the
European Commission has pledged to
collaborate to establish the new indicator
and include it in the global indicator
framework for the SDGs:
“Cooperation with the ILO and WHO
on data and knowledge […] will include
support, together with Member States,
for the creation of a new indicator on
mortality from diseases attributed to
occupational risk factors as part of the
United Nations sustainable development
goals.” (p. 20).44
Eurostat, the European Union’s statistical
office, has produced and published
experimental statistics on the number of
incident cases of selected occupational
diseases for Member States.45
Strengths and weaknesses
The new indicator has several strengths.
First, using the United Nations
established methods9
and open-access
data sources,10,26
the indicator captures
the great majority of the total estimated
work-related deaths.10–13
Second, as
the number of work-related deaths
(the numerator) is estimated based on
modelling of exposure data and relative
risks, these estimates are less at risk of
misreporting bias than estimates based
onreportedorcompensatedcasesoffatal
occupational or work-related disease.
Third, the indicator can also be used to
monitor other health topics, such as the
social and commercial determinants
of health (as a proxy for exposure to
unhealthy working conditions), and
noncommunicable diseases (as the
fraction of these diseases that can
Fig.
2.
Mortality
rate
per
100
000
working-age
population
(≥
15
years)
from
diseases
attributable
to
selected
occupational
risk
factors
in
183
countries,
2016
1.4–6.3
6.4–9.7
9.8–12.3
12.4–14.9
15.0–18.6
18.7–22.9
23.0–27.8
27.9–34.4
34.5–43.6
43.7–70.2
Insufficient
data
Not
applicable
Deaths
per
100
000
working-age
population
0
1000
2000
4000
km
N
Note:
Map
produced
by
World
Health
Organization
(WHO)
GIS
Centre
for
Health
and
the
Department
of
Data
and
Analytics
in
the
Division
of
Data,
Analytics
and
Delivery
for
Impact.
Map
created
on26
April
2023.
Data
sources:
WHO
and
International
Labour
Organization
joint
estimates
of
the
work-related
burden
of
disease
and
injury,.
10–13.
and
United
Nations
population
estimates.
26
6. 423
Bull World Health Organ 2023;101:418–430Q|doi: http://dx.doi.org/10.2471/BLT.23.289703
Policy & practice
New global indicator for workers’health
Frank Pega et al.
Fig. 3. Mortality rate per 100000 working-age population (≥15 years) from diseases attributable to selected occupational risk factors,
byWorld Health Organization region and disease group in 183 countries, 2016
0 10 20 30 40 50
0 10 20 30 40 50
Albania
Armenia
Austria
Azerbaijan
Belarus
Belgium
Bosnia and Herzegovina
Bulgaria
Croatia
Cyprus
Czechia
Denmark
Estonia
Finland
France
Georgia
Germany
Greece
Hungary
Iceland
Ireland
Israel
Italy
Kazakhstan
Kyrgyzstan
Latvia
Lithuania
Luxembourg
Malta
Montenegro
Netherlands (Kingdom of the)
North Macedonia
Norway
Poland
Portugal
Republic of Moldova
Romania
Russian Federation
Serbia
Slovakia
Slovenia
Spain
Sweden
Switzerland
Tajikistan
Türkiye
Turkmenistan
Ukraine
United Kingdom
Uzbekistan
Australia
Brunei Darussalam
Cambodia
China
Fiji
Japan
Kiribati
Lao People`s Democratic
Republic
Malaysia
Micronesia (Federated States of)
Mongolia
New Zealand
Papua New Guinea
Philippines
Republic of Korea
Samoa
Singapore
Solomon Islands
Tonga
Vanuatu
Viet Nam
0 10 20 30
0 10 20 30
Afghanistan
Bahrain
Djibouti
Egypt
Iran (Islamic Republic of)
Iraq
Jordan
Kuwait
Lebanon
Libya
Morocco
Oman
Pakistan
Qatar
Saudi Arabia
Somalia
Sudan
Syrian Arab Republic
Tunisia
United Arab Emirates
Yemen
Bangladesh
Bhutan
Democratic People’s
Republic of Korea
India
Indonesia
Maldives
Myanmar
Nepal
Sri Lanka
Thailand
Timor-Leste
Mortality rate per 100000
working-age population
Mortality rate per 100000
working-age population
African Region
Eastern Mediterranean Region
European Region
South-East Asia Region Western Pacific Region
Algeria
Angola
Benin
Botswana
Burkina Faso
Burundi
CaboVerde
Cameroon
Central African Republic
Chad
Comoros
Congo
Côte d’Ivoire
Democratic Republic of the Congo
Equatorial Guinea
Eritrea
Eswatini
Ethiopia
Gabon
Gambia
Ghana
Guinea
Guinea-Bissau
Kenya
Lesotho
Liberia
Madagascar
Malawi
Mali
Mauritania
Mauritius
Mozambique
Namibia
Niger
Nigeria
Rwanda
SaoTome and Principe
Senegal
Seychelles
Sierra Leone
South Africa
South Sudan
Togo
Uganda
United Republic ofTanzania
Zambia
Zimbabwe
Antigua and Barbuda
Argentina
Bahamas
Barbados
Belize
Bolivia (Plurinational State of)
Brazil
Canada
Chile
Colombia
Costa Rica
Cuba
Dominican Republic
Ecuador
El Salvador
Granada
Guatemala
Guyana
Haiti
Honduras
Jamaica
Mexico
Nicaragua
Panama
Paraguay
Peru
Saint Lucia
SaintVincent and the Grenadines
Suriname
Trinidad andTobago
United States
Uruguay
Venezuela (Bolivarian Republic of)
Region of the Americas
0 10 20 30 40 50 60 70
0 10 20 30 40 50 60 70
Mortality rate per 100000
working-age population
Mortality rate per 100000
working-age population
Mortality rate per 100000
working-age population
Mortality rate per 100000
working-age population
Malignant neoplasms Cardiovascular diseases Respiratory diseases
7. 424 Bull World Health Organ 2023;101:418–430Q|doi: http://dx.doi.org/10.2471/BLT.23.289703
Policy & practice
New global indicator for workers’health Frank Pega et al.
Table
3.
Country
case
studies
of
how
the
new
global
indicator
for
work-related
burden
of
disease
can
be
integrated
into
official
national
monitoring
systems
for
workers’
health
Country
(Region)
National
monitoring
systems
for
workers’
health
Similar
indicators
in
the
national
monitoring
systems
How
the
new
indicator
could
be
integrated
into
national
monitoring
systems
Potential
facilitators
and
barriers
for
use
of
the
new
indicator
Predicted
impact
of
the
new
indicator
China
(Western
Pacific
Region)
The
national
workers’
health
monitoring
system
of
China
comprises
the
national
surveillance
system
of
occupational
disease
31
and
the
national
surveillance
system
for
occupational
hazards
in
the
workplace.
32,33
The
agency
responsible
for
the
former
monitoring
system
is
the
Chinese
Center
for
Disease
Control
and
Prevention
of
the
National
Health
Commission.
The
occupational
disease
surveillance
system
is
the
most
relevant
to
the
new
indicator.
It
is
a
network-based
reporting
system
that
includes
all
relevant
agencies
in
China.
The
system
reports
new
cases
of
occupational
disease
covering
a
total
of
121
diseases
in
nine
categories,
and
relevant
variables
such
as
age,
job
title,
duration
of
work
and
industrial
sector.
The
relevant
indicators
in
the
national
monitoring
system
are:
(i)
number
of
workers
exposed
to
occupational
risk
factors
(data
collected
in
national
statistical
surveys);
(ii)
number
of
diagnosed
cases
of
occupational
disease
(data
collected
by
the
Agency
of
Occupational
Disease
Diagnosis
based
on
clinical
diagnosis
and
the
occupational
exposure
experience);
and
(iii)
number
of
deaths
due
to
occupational
disease
(data
collected
from
the
national
mortality
surveillance
system).
The
monitoring
system
does
not
include
the
new
indicator.
The
new
indicator
could
be
included
in
the
national
monitoring
system
without
replacing
any
current
indicators.
The
new
indicator
could
be
calculated
using
number
of
deaths
due
to
occupational
disease
as
the
numerator,
obtained
from
national
data
sources.
However,
the
national
workers’
health
monitoring
system
can
only
collect
the
approximate
number
of
deaths
due
to
occupational
disease,
so
only
an
approximate
of
the
new
indicator
can
be
calculated.
Facilitators
The
new
indicator
can
be
used
to
better
evaluate
the
burden
of
disease
caused
by
occupational
risk
factors
in
China.
Barriers
The
variables
needed
to
calculate
the
indicator
from
national
data
sources
are
still
not
accurate
enough.
The
country
therefore
needs
to
develop
a
better
evaluation
method.
The
cause
of
death
data
for
occupational
diseases
are
currently
not
classified
according
to
the
ICD-10.
China
is
working
on
linking
the
country’s
classification
of
occupational
disease
to
ICD-10.
The
new
indicator
can
better
describe
the
situation
of
occupational
health
status
in
China.
The
indicator
would
provide
solid
evidence
for
policy-makers
to
allocate
occupational
disease
prevention
resources.
The
new
indicator
can
accelerate
integration
of
the
surveillance
system
of
occupational
disease
with
the
national
mortality
surveillance
system.
The
new
indicator
can
help
to
deepen
collaboration
among
different
departments
within
the
health
system.
The
indicator
can
help
to
integrate
data
across
different
systems
in
China:
the
surveillance
system
of
occupational
disease
and
health
hazards,
the
national
surveillance
system
for
occupational
hazards
in
the
workplace,
the
national
mortality
surveillance
system
and
the
population-based
cancer
registration
system.
Islamic
Republic
of
Iran
(Eastern
Mediterranean
Region)
Workers’
health
in
Islamic
Republic
of
Iran
is
monitored
through
occupational
health
examinations
in
accordance
with
the
laws
of
the
country.
The
statistics
of
these
examinations
are
uploaded
to
the
portal
of
the
Deputy
Minister
of
Health.
Access
to
this
portal
is
only
available
to
the
health
ministry,
which
supervises
occupational
health
examinations.
The
relevant
indicators
in
the
national
monitoring
system
are:
(i)
coverage
of
occupational
health
examinations
(percentage
of
employees
for
whom
occupational
health
examinations
were
performed);
(ii)
percentage
of
employees
with
work-related
diseases
(this
indicator
is
available
for
a
limited
number
of
occupational
diseases);
and
(iii)
percentage
of
the
workforce
who
are
exposed
to
risk
factors
in
workplaces.
These
indicators
are
calculated
from
the
data
of
the
registration
system
of
occupational
health
examinations
and
occupational
health
inspection.
The
monitoring
system
does
not
include
the
new
indicator.
The
new
indicator
could
be
included
in
the
national
monitoring
system
of
workers’
health
promotional
indicators
without
replacing
any
current
indicators.
Some
necessary
components
for
calculating
the
new
indicator
from
national
data
sources
are
unavailable
to
the
health
ministry.
There
is
no
occupational
health
examination
registration
system
for
recording
occupational
health
examinations
for
each
person,
and
as
a
result,
electronic
occupational
health
records
do
not
exist
for
each
employee.
Facilitators
The
new
indicator
is
relevant
to
the
Islamic
Republic
of
Iran.
The
country
has
limited
indicators
in
the
field
of
occupational
diseases.
Indicators
related
to
burden
of
disease
are
not
calculated.
Barriers
The
country
lacks
a
system
or
platform
for
gathering
data
to
calculate
the
new
indicator.
The
required
data
are
not
available
to
the
health
ministry.
The
Islamic
Republic
of
Iran
can
use
the
new
indicator
to
supplement
the
existing
information
on
workers’
health,
and
to
inform
future
policies
and
plans
to
control
occupational
diseases.
The
new
indicator
can
help
to
improve
the
system
of
providing
occupational
health
services
to
employees.
The
indicator
could
strengthen
the
health
system
by
including
the
data
of
diseases
attributable
to
selected
occupational
risk
factors,
by
disease,
risk
factor,
sex
and
age
group
in
the
current
surveillance
and
disease
control
systems.
The
new
indicator
would
be
effective
for
decision-making
by
other
organizations.
It
could
help
departments
to
carry
out
interventions
and
workforce
planning,
and
increase
the
productivity
of
employees.
Gathering
mortality
rate
data
would
require
communication
and
synergy
among
different
departments
of
the
health
ministry
and
other
organizations.
(continues.
.
.)
8. 425
Bull World Health Organ 2023;101:418–430Q|doi: http://dx.doi.org/10.2471/BLT.23.289703
Policy & practice
New global indicator for workers’health
Frank Pega et al.
Country
(Region)
National
monitoring
systems
for
workers’
health
Similar
indicators
in
the
national
monitoring
systems
How
the
new
indicator
could
be
integrated
into
national
monitoring
systems
Potential
facilitators
and
barriers
for
use
of
the
new
indicator
Predicted
impact
of
the
new
indicator
Italy
(European
Region)
The
Italian
national
monitoring
system
for
occupational
diseases
comprises
three
main
systems
that
capture
different
occupational
diseases’
characteristics
and
incidence:
(i)
ReNaM,
the
Italian
national
mesothelioma
registry;
34a
(ii)
MalProf,
an
epidemiological
surveillance
system
for
occupational
diseases;
35b
and
(iii)
the
INAIL
database,
36
the
database
of
compensation
claims
and
reported
cases
collected
through
the
public
insurance
for
workers
against
occupational
injuries
and
diseases.
c
The
agency
responsible
for
these
monitoring
systems
is
the
Italian
National
Institute
for
Insurance
against
Accidents
at
Work.
The
INAIL
database
is
the
most
relevant
to
the
new
indicator
and
comprises
three
indicators:
(i)
total
number
of
claims
for
occupational
diseases;
(ii)
total
number
of
compensated
cases
of
occupational
diseases;
and
(iii)
total
number
of
cases
of
fatal
occupational
diseases.
The
relevant
indicator
in
the
national
monitoring
system
is:
total
number
of
compensated
cases
of
fatal
occupational
diseases
(INAIL
database).
The
monitoring
system
does
not
include
the
new
indicator.
The
new
indicator
could
be
added
to
the
monitoring
system
without
replacing
any
current
indicators.
The
new
indicator
could
be
calculated
using
the
number
of
compensated
cases
of
fatal
occupational
diseases
from
national
data
sources
as
the
numerator.
Italy’s
national
monitoring
system
includes
data
and
indicators
on
19
of
the
21
exposure–disease
pairs
captured
by
the
new
indicator.
It
may
be
possible
to
compare
the
value
of
the
indicator
when
generated
using
different
data
sources
(that
is,
estimated
deaths
from
WHO/ILO
joint
estimates
d
versus
reported
cases
from
national
data
collections).
Facilitators
The
new
indicator
could
promote
awareness
about
emerging
occupational
diseases,
improving
the
efficiency
of
the
health
insurance
system
in
Italy.
The
new
indicator
could
promote
systematic
comparisons
between
insurance
data
and
data
from
epidemiological
surveillance
systems.
Barriers
Regions
collect
the
data
on
reported
fatal
cases
of
occupational
disease
(required
for
the
new
indicator)
at
regional
level.
They
are
required
to
collect
and
provide
these
data,
but
their
operating
capacity
to
do
this
differs.
The
centralized
agency
that
oversees
the
three
national
monitoring
systems
could
potentially
harmonize
these
regional
data
sets
to
produce
the
numerator
for
the
indicator.
The
new
indicator
may
allow
a
comparison
of
estimates
of
the
numbers
of
deaths
due
to
work-related
diseases
with
the
numbers
of
deaths
reported
through
the
current
monitoring
systems
in
Italy.
The
new
indicator
could
contribute
to
expanding
the
list
of
occupational
diseases
by
adding
newly
recognized
causal
links
with
specific
occupations.
The
new
indicator
could
improve
knowledge
and
awareness
about
the
etiology
of
occupational
diseases
to
inform
the
occupational
safety
and
public
health
of
communities.
The
new
indicator
could
increase
Italy’s
capacity
to
estimate
the
occupational
fraction
of
its
burden
of
disease.
(continues.
.
.)
(.
.
.continued)
9. 426 Bull World Health Organ 2023;101:418–430Q|doi: http://dx.doi.org/10.2471/BLT.23.289703
Policy & practice
New global indicator for workers’health Frank Pega et al.
Country
(Region)
National
monitoring
systems
for
workers’
health
Similar
indicators
in
the
national
monitoring
systems
How
the
new
indicator
could
be
integrated
into
national
monitoring
systems
Potential
facilitators
and
barriers
for
use
of
the
new
indicator
Predicted
impact
of
the
new
indicator
South
Africa
(African
Region)
Occupational
diseases
are
monitored
in
the
national
occupational
mortality
surveillance
South
Africa.
37
The
agency
responsible
for
this
system
is
the
National
Institute
for
Occupational
Health.
The
data
do
not
permit
perfect
attribution
of
fatal
cases
of
disease
to
occupational
risk
factors.
The
system
comprises
14
indicators,
but
is
still
in
development.
The
relevant
indicators
in
the
national
occupational
mortality
surveillance
are:
(i)
occupational
exposure
to
asbestos
(mining),
mesothelioma
(ii)
occupational
exposure
to
silica,
silicosis;
and
(iii)
occupational
asthmagens
(all
occupations),
asthma.
These
indicators
are
calculated
as
proportional
mortality
ratios.
These
ratios
estimate
risk
of
death
from
the
disease
in
a
specific
occupation,
compared
to
in
the
general
population.
Their
calculation
requires
mortality
data
by
occupation.
South
Africa’s
official
statistics
agency
provides
such
data
up
to
the
year
2016,
but
does
not
code
mortality
data
for
more
recent
years
by
occupation.
Additionally,
indicators
on
selected
occupational
risk
factors
are
available
from
national
surveys
conducted
by
the
national
statistics
agency:
for
example
on
exposure
to
long
working
hours
from
the
national
income
dynamics
study.
38
The
monitoring
system
does
not
include
the
new
indicator.
The
new
indicator
could
be
added
to
the
monitoring
system
without
replacing
any
current
indicators.
The
new
indicator
cannot
be
calculated
from
current
national
data
sources.
National
data
on
fatal
cases
of
occupational
diseases
(the
numerator)
are
limited
in
availability
and
quality.
National
data
on
the
total
population
(the
denominator)
are
available
annually
from
estimates
of
the
national
statistics
agency.
39
Facilitators
Adding
the
new
indicator
to
the
national
occupational
mortality
surveillance
system
will
provide
important
occupational
health
surveillance
and
assist
with
recognition
of
diseases
as
work-related
in
South
Africa.
There
is
open-access
availability
to
the
new
indicator
via
the
WHO/ILO
joint
estimates.
d
Barriers
Data
access
and
linkages
across
departments
would
be
a
barrier
to
generating
the
new
indicator
from
national
data
sources.
The
responsible
agency
would
need
to
adjust
any
data
received.
Caution
should
be
taken
when
interpreting
the
new
indicator
due
to
the
quality
of
the
data
and
variability
in
people’s
access
to
health
care.
Adding
the
new
indicator
to
the
national
monitoring
system
can
support
the
evolving
surveillance
of
disease
mortality
and
attribution
where
it
is
currently
limited.
The
indicator
can
broaden
the
scope
of
workers’
health
monitoring
in
South
Africa.
The
new
indicator
can
support
policy
development
and
implementation
on
occupational
health.
The
new
indicator
can
increase
awareness
in
the
health
sector
about
the
importance
of
occupational
risk
factors,
and
build
capacity
and
stimulate
research
on
this
topic.
The
indicator
has
the
potential
to
inform
integration
of
basic
occupational
health
services
into
the
primary
health-care
system.
The
new
indicator
could
foster
linkages
across
the
departments
of
health,
labour
and
home
affairs
40,41
to
enable
them
to
handle
occupational
health
monitoring
jointly.
ICD-10:
International
Statistical
Classification
of
Diseases
and
Related
Health
Problems,
10th
revision;
ILO:
International
Labour
Organization;
WHO:
World
Health
Organization.
a
ReNaM
is
the
Italian
national
mesothelioma
registry,
an
epidemiological
surveillance
system
focused
on
active
search
of
mesothelioma
incident
cases.
The
registry
provides
a
wide
range
of
information
on
mesothelioma
cases,
including
the
retrospective
analysis
of
data
on
exposure
to
asbestos
collected
via
questionnaire
on
occupational
and
medical
history.
b
MalProf
is
an
epidemiological
surveillance
system
for
occupational
diseases
based
on
the
observations
of
Local
Health
Units
through
their
Prevention
Services,
by
collating
information
from
judicial
claims
and
from
an
active
search
of
cases.
The
system
allows
identification
of
causal
link
between
the
disease
and
the
employment
condition.
c
The
INAIL
database
is
the
database
of
the
Italian
National
Institute
for
Insurance
against
Accidents
at
Work
and
occupational
diseases.
The
database
collates
results
from
the
activities
of
the
public
insurance
system
for
workers
against
injuries
at
work
and
occupational
diseases,
and
includes
both
compensation
claims
and
defined
cases.
d
WHO/ILO
joint
estimates
of
the
work-related
burden
of
disease
and
injury.
10–13
(.
.
.continued)
10. 427
Bull World Health Organ 2023;101:418–430Q|doi: http://dx.doi.org/10.2471/BLT.23.289703
Policy & practice
New global indicator for workers’health
Frank Pega et al.
be addressed by health protection
and promotion in workplaces).
Finally, WHO has already produced
this indicator (shown here for 183
countries), disaggregated by sex and age
group, allowing epidemiological analysis
and health inequality monitoring,42,46
without any additional reporting burden
for countries.
The indicator also has limitations.
First, it captures deaths only from
exposure–disease pairs for which there
is sufficient evidence, and not for all
such pairings. The recent addition of
two new exposure–disease pairings
(deaths from ischaemic heart disease or
from stroke attributable to long working
hours)12
added almost 40% of the total
estimated number of deaths attributable
to occupational risk factors (744924 out
of 1 879 890 deaths in 2016).13
Other
exposure–disease pairs (if any) must be
addedtothecomparativeriskassessment
when sufficient evidence is available
to support this. Additional pairings
could include occupational exposure to
ultraviolet radiation and non-melanoma
skin cancer,47
and occupational exposure
to welding fumes and trachea, bronchus
and lung cancer.48
Second, the scope
of the work-related burden of disease
does not include mortality among child
labourers; mortality due to secondary
exposures or take-home of exposures to
families or other community members;
or intergenerational mortality due to
occupational risk factors. Third, the
indicator could be further disaggregated
by migrant status of workers to align
with the full definition of SDG target
8.8.1 and by whether the worker works
in the informal or formal economy, but
this would require disaggregated input
data, which are currently sparse.49,50
Finally, the quality of the indicator
depends on the input data. Governments
are encouraged to continue their work
to provide large-scale, high-quality,
official data on individuals’ exposure to
occupational risk factors and on causes
of death and disease.
Alternative specification
There are possible alternative
specifications for the indicator. The
data source for the numerator could
be reported fatal or incident cases
of occupational disease, or national
occupational burden of diseases
estimates, as already monitored in
some countries (Table 3). Nevertheless,
the advantage of using the WHO/ILO
joint estimates is that they produce
comparable estimates for 183 countries
and the six WHO regions and their
population cohorts. Alternatively, using
disability-adjusted life-years attributable
to occupational risk factors would
capture both mortality and morbidity.
The use of total population as
the denominator would facilitate
comparisons with other mortality rate
indicators that use the total population,
such as those in the global indicator
framework for the SDGs.9
However, as
the data for the numerator are collected
for people aged 15 years and older, we
believe that the working-age population
is the most appropriate denominator for
the indicator.
Conclusions
The workplace is an important setting
for preventing disease.51
A key first step
when improving working conditions is
understanding and quantifying the risk
factors and their attributable burdens.
With the current focus of monitoring
on occupational injuries, the majority of
work-related mortality is not captured.
To assess progress towards health targets
for workers, international organizations,
regions and countries must expand their
indicators to consider mortality from
work-related diseases. Integration of
this new indicator in global, regional
and national monitoring systems
will improve the comprehensiveness,
accuracy and harmonization of workers’
health and sustainable development
surveillance. The indicator will provide
opportunities for analysing health
inequalities among workers, both within
and between countries. The indicator
can provide an improved evidence
base for developing effective health
policy and systems for workers, and
can play a key role in assessing progress
in countries’ policy commitments to
workers’ health.1–5
■
Acknowledgements
We thank Yonah Amster (WHO) and
Diana Estevez Fernandez (WHO).
Competing interests: None declared.
ملخص
حمددة مهنية خطر عوامل عن النامجة باألمراض املرتبطة الوفيات معدل :العامل لصحة جديد عاملي مؤرش
،األخرى والسياسات ،8و 3 املستدامة التنمية هديف خالل من
من احلد طريق عن العامل صحة وتعزيز بحامية الدول التزمت
هذه يف حتقيقه تم الذي التقدم ملراقبة .بالعمل املرتبط املرض عبء
املرض عبء ترصد التي ،املؤرشات تكون أن جيب ،االلتزامات
.املستدامة والتنمية العامل صحة لرصد متاحة ،بالعمل املرتبط
أن ،الدولية العمل ومنظمة ،العاملية الصحة منظمة من كل تقدر
حاالت من 18879890 إمجايل من فقط )%19( 363283
كانت ،2016 عام يف العامل مستوى عىل بالعمل مرتبطة ،الوفاة
حاالت من )%81( 1516607 أن حني يف ،اإلصابات بسبب
عىل تركز التي املراقبة أنظمة معظم .األمراض بسبب كانت الوفاة
العاملي املؤرش عمل إطار مثل ،املستدامة التنمية أو العامل صحة
اإلصابات عبء عىل ا ًمؤرش تتضمن ،املستدامة التنمية ألهداف
عىل مؤرش لدهيا األنظمة هذه من القليل فإن ،ذلك ومع .املهنية
نحن ،الفجوة هذه مع للتعامل .بالعمل املرتبطة األمراض عبء
النامجة األمراض املرتبطة الوفيات معدل :اًجديد اًيعامل ا ًمؤرشنقدم
،اخلطر وعامل ،املرض حسب ،حمددة مهنية خطر عوامل عن
لسياسة املنطقي األساس نحدد نحن .العمرية والفئة ،واجلنس
ونحلل ،عن ونعلن ،حسابه وطرق بياناته مصادر ونصف ،املؤرش
الستخدام أمثلة ا ً
أيض نقدم نحن .دولة 183 لـ الرسمي املؤرش
نقاط عىل ونركز ،الوطنية العامل صحة مراقبة أنظمة يف املؤرش
اجلديد املؤرش دمج أن نستنتج نحن .باملؤرش اخلاصة والقيود القوة
،العامل لصحة ودقة ًالشمو أكثر مراقبة سيوفر املراقبة أنظمة يف
.والوطنية واإلقليمية العاملية املراقبة أنظمة عرب بالتنسيق ويسمح
حتسني ويمكن ،العامل صحة يف التفاوت حاالت حتليل يمكن
لصحة بالنسبة فعالية أكثر وأنظمة سياسة حتقيق نحو األدلة قاعدة
.العامل
11. 428 Bull World Health Organ 2023;101:418–430Q|doi: http://dx.doi.org/10.2471/BLT.23.289703
Policy & practice
New global indicator for workers’health Frank Pega et al.
摘要
工人健康的全球性新指标 :
可归因于选定职业风险因素的疾病死亡率
通过可持续发展目标 3 和 8 以及其他政策,各国承诺
通过减少与工作相关的疾病负担来保护和促进工人健
康。为了监测这些承诺的进展情况,应当提供反映与
工作相关的疾病负担的指标,以用于监测工人的健康
和可持续发展。据世界卫生组织和国际劳工组织估计,
2016 年全球 1,879,890 例与工作相关的死亡中,只有
363,283 例 (19%) 是因工伤死亡,而 1,516,607 例 (81%)
是死于疾病。大多数关注工人健康或可持续发展的监
测系统,如可持续发展目标的全球指标框架,都包括
一项关于职业伤害负担的指标。然而,这些系统中很
少有关于与工作有关的疾病负担的指标。为了弥补这
一差距,我们提出了一个全球性的新指标 :
按疾病、
风险因素、性别和年龄组划分的可归因于选定职业风
险因素的疾病死亡率。我们概述了该指标的政策依据,
描述了其数据来源和计算方法,并报告和分析了 183
个国家 / 地区的官方指标。我们还提供了在国家工人
健康监测系统中使用该指标的例子,并强调了该指标
的优势和局限性。我们的结论是,将新指标纳入监测
系统将提供更全面和准确的工人健康监测,并促进了
全球、区域和国家监测系统之间的协调性。可以分析
工人健康方面的不平等现象,并完善证据基础,以制
定更有效的工人健康政策和制度。
Résumé
Nouvel indicateur mondial pour la santé des travailleurs: taux de mortalité dû aux maladies attribuables à certains facteurs de
risque professionnels
Par le biais des objectifs de développement durable 3 et 8 ainsi
que d'autres mesures, plusieurs pays se sont engagés à protéger et
promouvoir la santé des travailleurs en réduisant l'impact des maladies
liéesautravail.Maispourévaluerleursprogrèsenlamatière,ilconvient
de mettre en place des indicateurs estimant l'impact des maladies
liées au travail afin de placer le développement durable et la santé des
travailleurssoussurveillance.D'aprèsl'OrganisationmondialedelaSanté
etl'OrganisationinternationaleduTravail,seulement363283(19%)des
1 879 890 décès liés au travail dans le monde en 2016 découlaient de
blessures,tandisque1516607(81%)d'entreeuxétaientcauséspardes
maladies. La plupart des systèmes de surveillance qui s'intéressent à la
santé des travailleurs ou au développement durable, comme le cadre
mondial d'indicateurs pour les objectifs de développement durable,
comportent un indicateur relatif à l'impact des accidents de travail.
Cependant, rares sont ceux qui possèdent un indicateur concernant
l'impactdesmaladiesprofessionnelles.Pourcomblercettelacune,nous
dévoilons un nouvel indicateur mondial: le taux de mortalité dû aux
maladiesattribuablesàcertainsfacteursderisqueprofessionnelsclassé
par maladie, facteur de risque, sexe et catégorie d'âge. Nous exposons
le motif politique de l'indicateur, décrivons l'origine des données et
les méthodes de calcul, et communiquons et analysons l'indicateur
officiel pour 183 pays. Nous fournissons également des exemples de
la façon dont l'indicateur peut être utilisé dans des systèmes nationaux
de surveillance de la santé des travailleurs et soulignons ses forces et
faiblesses. Nous concluons en affirmant que l'intégration de ce nouvel
indicateurdanslessystèmesdesurveillanceoffriraunsuivipluscomplet
etprécisdelasantédestravailleursetouvriralavoieàuneharmonisation
dessystèmesmondiaux,nationauxetrégionaux.Ilestpossibled'analyser
les inégalités en matière de santé des travailleurs et d'en améliorer les
bases factuelles afin d'établir des politiques et systèmes plus efficaces
dans ce domaine.
Резюме
Новый глобальный показатель здоровья работников: уровень смертности от заболеваний, связанных с
отдельными профессиональными факторами риска
В рамках целей в области устойчивого развития 3 и 8 и
других стратегий страны обязались защищать и укреплять
здоровье работников путем снижения бремени заболеваний,
связанныхсработой.Длямониторингапрогрессаввыполнении
этих обязательств необходимо предоставить показатели,
отражающие бремя заболеваний, связанных с работой, для
мониторинга здоровья работников и устойчивого развития.
По оценкам Всемирной организации здравоохранения и
Международной организации труда, из 1 879 890 смертей на
производстве в мире в 2016 году только 363 283 (19%) были
вызваны травмами, тогда как 1 516 607 (81%) смертей были
вызваны заболеваниями. Большинство систем мониторинга,
ориентированных на здоровье работников или устойчивое
развитие, таких как глобальная система показателей для целей
в области устойчивого развития, включают показатель нагрузки
производственного травматизма. Однако лишь немногие такие
системы имеют показатель бремени заболеваний, связанных
с работой. Для устранения этого пробела представлен новый
глобальный показатель: уровень смертности от заболеваний,
связанныхсотдельнымипрофессиональнымифакторамириска,с
разбивкойпозаболеваниям,факторамриска,полуивозрастным
группам. Мы излагаем обоснование показателя в соответствии
с политикой организации, описываем источники данных и
методы его расчета, а также представляем отчет и анализируем
официальный показатель по 183 странам. Также приведены
примеры использования показателя в национальных системах
мониторингаздоровьяработников,иотмеченысильныеислабые
стороныпоказателя.Мыпришликвыводу,чтовключениенового
показателявсистемымониторингаобеспечитболеекомплексное
и точное наблюдение за здоровьем работников и позволит
гармонизировать глобальные, региональные и национальные
системы мониторинга. Неравенство в здоровье работников
можетбытьпроанализировано,адоказательнаябазаможетбыть
улучшенавнаправленииболееэффективнойполитикиисистем
в области здоровья работников.
12. 429
Bull World Health Organ 2023;101:418–430Q|doi: http://dx.doi.org/10.2471/BLT.23.289703
Policy & practice
New global indicator for workers’health
Frank Pega et al.
Resumen
Nuevo indicador global de la salud de los trabajadores: tasa de mortalidad por enfermedades atribuibles a factores de riesgo
laborales seleccionados
Atravésdelosobjetivosdedesarrollosostenible3y8ydeotraspolíticas,
los países se han comprometido a proteger y promover la salud de
los trabajadores reduciendo la carga de morbilidad relacionada con
el trabajo. Para supervisar los avances en el cumplimiento de estos
compromisos, debería disponerse de indicadores que reflejen la carga
de morbilidad relacionada con el trabajo, a fin de controlar la salud de
los trabajadores y el desarrollo sostenible. La Organización Mundial de
la Salud y la Organización Internacional del Trabajo estiman que solo
363 283 (19%) de las 1 879 890 muertes relacionadas con el trabajo a
nivel mundial en 2016 se debieron a lesiones, mientras que 1 516 607
(81%)muertessedebieronaenfermedades.Lamayoríadelossistemas
de vigilancia centrados en la salud de los trabajadores o el desarrollo
sostenible, como el marco de indicadores mundiales para los objetivos
de desarrollo sostenible, incluyen un indicador sobre la carga de las
lesioneslaborales.Noobstante,pocosdeestossistemascuentanconun
indicadorsobrelacargadelasenfermedadesrelacionadasconeltrabajo.
Parasubsanarestacarencia,presentamosunnuevoindicadormundial:la
tasa de mortalidad por enfermedades atribuibles a factores de riesgo
laboralesseleccionados,porenfermedad,factorderiesgo,sexoygrupo
deedad.Describimoslajustificaciónpolíticadelindicador,describimos
sus fuentes de datos y métodos de cálculo, e informamos y analizamos
elindicadoroficialpara183 países.Tambiénproporcionamosejemplos
del uso del indicador en los sistemas nacionales de vigilancia de la
salud de los trabajadores y destacamos las ventajas y las limitaciones
del indicador. Concluimos que la integración del nuevo indicador en
los sistemas de vigilancia proporcionará una vigilancia más exhaustiva
y precisa de la salud de los trabajadores, y permitirá la armonización
entre los sistemas de vigilancia mundiales, regionales y nacionales. Se
podrán analizar las desigualdades en la salud de los trabajadores y se
podrámejorarlabasedeevidenciasparalograrpolíticasysistemasmás
eficaces en materia de salud de los trabajadores.
References
1. Resolution A/RES/70/1. Transforming our world: the 2030 agenda for
sustainable development. In: Seventieth United Nations General Assembly,
NewYork, 25 September 2015. NewYork: United Nations; 2015. Available
from: http://www.un.org/ga/search/view_doc.asp?symbol=A/RES/70/1&
Lang=E [cited 2023 Apr 19].
2. WHO global strategy on health, environment and climate change: the
transformation needed to improve lives and well-being sustainably through
healthy environments. Geneva: World Health Organization; 2020. Available
from: https://www.who.int/publications/i/item/9789240000377 [cited
2023 Apr 19].
3. Plan of action on workers’health 2015–2025. Washington, DC: Pan
American Health Organization; 2017. Available from: https://iris.paho.org/
handle/10665.2/33986 [cited 2023 Apr 19].
4. International labour standards on occupational safety and health. Geneva:
International Labour Organization; 2022. Available from: https://www.ilo
.org/global/standards/subjects-covered-by-international-labour-standards/
occupational-safety-and-health/lang — en/index.htm [cited 2022 Aug 11].
5. Resolution on the inclusion of a safe and healthy working environment in
the ILO’s framework of fundamental principles and rights at work [ILC.110/
Resolution I]. In: 110th International Labour Conference, Geneva, 27 May to
11 June 2022. Geneva: International Labour Organization; 2022. Available
from: https://www.ilo.org/ilc/ILCSessions/110/reports/texts-adopted/
WCMS_848632/lang--en/index.htm [cited 2023 Apr 19].
6. Closing the gap in a generation: health equity through action on the
social determinants of health. Final Report of the Commission on Social
Determinants of Health. Geneva: World Health Organization; 2008. Available
from: https://apps.who.int/iris/handle/10665/43943 [cited 2023 Apr 19].
7. Kickbusch I. Health in all policies. BMJ. 2013 Jul 3;347 jul03 1:f4283. doi:
http://dx.doi.org/10.1136/bmj.f4283 PMID: 23824002
8. SDG indicator metadata: Indicator 8.8.1: fatal and non-fatal occupational
injuries per 100 000 workers, by sex and migrant status. NewYork: United
Nations; 2022. Available from: https://unstats.un.org/sdgs/metadata/files/
Metadata-08-08-01.pdf [cited 2023 Apr 19].
9. Global indicator framework for the sustainable development goals and
targets of the 2030 agenda for sustainable development. NewYork: United
Nations; 2022. Available from: https://unstats.un.org/sdgs/indicators/
indicators-list/[cited 2023 Apr 19].
10. WHO/ILO Joint Estimates of the Work-related Burden of Disease and Injury.
2000-2016: global monitoring report. Geneva: World Health Organization;
2021. Available from: https://www.who.int/publications/i/item/
9789240034945 [cited 2023 Apr 19].
11. WHO/ILO Joint Estimates of the Work-related Burden of Disease and Injury.
2000-2016: technical report with data sources and methods. Geneva:
World Health Organization; 2021. Available from: https://www.who.int/
publications/i/item/9789240034921 [cited 2023 Apr 19].
12. Pega F, Náfrádi B, Momen NC, UjitaY, Streicher KN, Prüss-Üstün AM, et
al. Technical Advisory Group. Global, regional, and national burdens of
ischemic heart disease and stroke attributable to exposure to long working
hours for 194 countries, 2000-2016: a systematic analysis from the WHO/ILO
joint estimates of the work-related burden of disease and injury. Environ Int.
2021 Sep;154:106595. doi: http://dx.doi.org/10.1016/j.envint.2021.106595
PMID: 34011457
13. Pega F, Hamzaoui H, Náfrádi B, Momen NC. Global, regional and national
burden of disease attributable to 19 selected occupational risk factors for
183 countries, 2000-2016: a systematic analysis from the WHO/ILO joint
estimates of the work-related burden of disease and injury. Scand J Work
Environ Health. 2022 Mar 1;48(2):158–68. doi: http://dx.doi.org/10.5271/
sjweh.4001 PMID: 34806754
14. WHA71.2. Thirteenth general programme of work, 2019–2023. In:
Seventy-first World Health Assembly, Geneva, 21–26 May 2018. Geneva:
World Health Organization; 2018. Available from: https://apps.who.int/gb/
e/e_wha71.html [cited 2023 Apr 19].
15. The thirteenth general programme of work 2019–2023: promote
health, keep the world safe, serve the vulnerable. Geneva: World Health
Organization; 2019. Available from: https://www.who.int/about/what-we
-do/thirteenth-general-programme-of-work-2019 — 2023 [cited 2023 Apr
19].
16. Stanaway JD, Afshin A, Gakidou E, Lim SS, Abate D, Abate KH, et al. GBD
2017 Risk Factor Collaborators. Global, regional, and national comparative
risk assessment of 84 behavioural, environmental and occupational, and
metabolic risks or clusters of risks for 195 countries and territories, 1990-
2017: a systematic analysis for the Global Burden of Disease Study 2017.
Lancet. 2018 Nov 10;392(10159):1923–94. doi: http://dx.doi.org/10.1016/
S0140-6736(18)32225-6 PMID: 30496105
17. WHO methods and data sources for global burden of disease estimates
2000–2019. Global health estimates technical paper WHO/DDI/DNA/
GHE/2020.3. Geneva: World Health Organization; 2020. Available from:
https://www.who.int/docs/default-source/gho-documents/global-health
-estimates/ghe2019_cod_methods.pdf [cited 2023 Apr 19].
18. Stevens GA, Alkema L, Black RE, Boerma JT, Collins GS, Ezzati M, et al.
The GATHER Working Group. Guidelines for accurate and transparent
health estimates reporting: the GATHER statement. Lancet. 2016 Dec
10;388(10062):e19–23. doi: http://dx.doi.org/10.1016/S0140-6736(16)30388
-9 PMID: 27371184
19. Occupational burden of disease application: app for exploring and
visualizing occupational burden of disease estimates, by country, sex and
age group. Version 1.0 [internet]. Geneva: World Health Organization; 2021.
Available from: https://who-ilo-joint-estimates.shinyapps.io/Occupati
onalBurdenOfDisease/[cited 2023 Apr 19].
13. 430 Bull World Health Organ 2023;101:418–430Q|doi: http://dx.doi.org/10.2471/BLT.23.289703
Policy & practice
New global indicator for workers’health Frank Pega et al.
20. Ezzati M, Lopez AD, Rodgers A, Murray CJL, editors. Comparative
quantification of health risks: global and regional burden of disease
attributable to selected major risk factors. Geneva: World Health
Organization; 2004.
21. Náfrádi B, Kiiver H, Neupane S, Momen NC, Streicher KN, Pega F.
Estimating the population exposed to a risk factor over a time window: a
microsimulation modelling approach from the WHO/ILO joint estimates
of the work-related burden of disease and injury. PLoS One. 2022 Dec
30;17(12):e0278507. doi: http://dx.doi.org/10.1371/journal.pone.0278507
PMID: 36584100
22. Descatha A, Sembajwe G, Pega F, UjitaY, Baer M, Boccuni F, et al. The effect
of exposure to long working hours on stroke: a systematic review and meta-
analysis from the WHO/ILO joint estimates of the work-related burden of
disease and injury. Environ Int. 2020 Sep;142:105746. doi: http://dx.doi.org/
10.1016/j.envint.2020.105746 PMID: 32505015
23. Li J, Pega F, UjitaY, Brisson C, Clays E, Descatha A, et al. The effect of
exposure to long working hours on ischaemic heart disease: a systematic
review and meta-analysis from the WHO/ILO joint estimates of the work-
related burden of disease and injury. Environ Int. 2020 Sep;142:105739. doi:
http://dx.doi.org/10.1016/j.envint.2020.105739 PMID: 32505014
24. Pega F, Momen NC, UjitaY, Driscoll T, Whaley P. Systematic reviews and
meta-analyses for the WHO/ILO joint estimates of the work-related burden
of disease and injury. Environ Int. 2021 Oct;155:106605. doi: http://dx.doi
.org/10.1016/j.envint.2021.106605 PMID: 34051644
25. Global health estimates 2016 [internet]. Geneva: World Health Organization;
2018. Available from: https://www.who.int/gho/mortality_burden_disease/
en/[cited 2018 May 11].
26. World population prospects 2019 [online]. NewYork: United Nations; 2019.
Available from: https://population.un.org/wpp/[cited 2023 Apr 19].
27. Efron B. Bootstrap methods: another look at the jackknife. Ann Stat.
1979;7(1):1–26. doi: http://dx.doi.org/10.1214/aos/1176344552
28. Pega F, Al-Emam R, Cao B, Davis CW, Edwards SJ, Gagliardi D, et al. New
global indicator for workers’health: mortality rate from diseases attributable
to selected occupational risk factors: supplementary files [online
repository]. London: figshare; 2023. https://www.doi.org/10.6084/m9
.figshare.22661311
29. Bennett JE, Stevens GA, Mathers CD, Bonita R, Rehm J, Kruk ME, et al. NCD
Countdown 2030 collaborators. NCD Countdown 2030: worldwide trends
in noncommunicable disease mortality and progress towards sustainable
development goal target 3.4. Lancet. 2018 Sep 22;392(10152):1072–88. doi:
http://dx.doi.org/10.1016/S0140-6736(18)31992-5 PMID: 30264707
30. WHO global plan of action on workers’health (2008–2017): baseline for
implementation. Global country survey 2008/2009. Executive summary and
survey findings. Geneva: World Health Organization; 2013. Available from:
https://www.who.int/publications/i/item/WHO-FWC-PHE-2013-01 [cited
2023 Apr 19].
31. Zheng J, Zhang S, Wang H,YuY, Hu W. Surveillance of noise exposure level
in the manufacturing industry – China, 2020. China CDC Wkly. 2021 Oct
22;3(43):906–10. PMID: 34745689
32. Wang D, Liu A, Zhang S,YuY, Hu W, Sun X. History of the development of
the reporting system of occupational diseases and occupational disease list
in China. China CDC Wkly. 2020 May 1;2(18):314–8. doi: http://dx.doi.org/10
.46234/ccdcw2020.080 PMID: 34594646
33. Zhu X, Wang D, Wang H. Discussion on the status of statistical reporting
and monitoring of occupational diseases and the construction of its
information-based systems. Chin J Ind Med. 2018;31(1):73–5.
34. [Inail. National mesothelioma registry (Renam)] [internet]. Rome: National
Institute for Insurance against Accidents at Work; 2022. Italian. Available
from: https://www.inail.it/cs/internet/attivita/ricerca-e-tecnologia/area
-salute-sul-lavoro/sorveglianza-epidemiologica-negli-ambienti-di-lavoro-e
-di-vita/renam.html?id1=6443101379561#anchor [cited 2022 Aug 15].
35. [Inail. Malprof] [internet]. Rome: National Institute for Insurance against
Accidents at Work; 2022. Italian. Available from: https://www.inail.it/cs/
internet/attivita/ricerca-e-tecnologia/area-salute-sul-lavoro/sistemi-di
-sorveglianza-e-supporto-al-servizio-sanitario-naziona/malprof.html?id1=
6443099691915#anchor [cited 2022 Aug 15].
36. [Inail. Injuries and occupational diseases claims and compensated cases]
[internet]. Rome: National Institute for Insurance against Accidents at Work;
2022. Italian. Available from: https://www.inail.it/cs/internet/attivita/dati-e
-statistiche/open-data.html [cited 2022 Aug 15].
37. National occupational mortality surveillance South Africa (NOMS-SA)
[internet]. Johannesburg: National Institute for Occupational Health; 2021.
Available from: https://www.nioh.ac.za/national-occupational-mortality
-surveillance-south-africa-noms-sa/[cited 2022 Aug 24].
38. NIDS [internet]. Cape Town: National Income Dynamics Study; 2020.
Available from: http://www.nids.uct.ac.za/[cited 2022 Aug 24].
39. Mid-year population estimates 2021. Report No.: P0302. Pretoria: Statistics
South Africa; 2021. Available from: https://www.statssa.gov.za/?page_id=
1854&PPN=P0302&SCH=72983 [cited 2023 Apr 19].
40. Statistics by theme, People: causes of death 2013 [internet]. Pretoria:
Statistics South Africa; 2022. Available from: https://www.statssa.gov.za/
?page_id=737&id=3 [cited 2023 Apr 19].
41. The Births and Deaths Registration Act, 1992 (Act No. 51 of 1992) read with
the Identification Act, 1997 (Act No. 68 of 1997). Available from: https://
www.gov.za/documents/births-and-deaths-registration-act [cite 2023 Apr
24].
42. Handbook on health inequality monitoring with a special focus on low- and
middle-income countries. Geneva: World Health Organization; 2013.
Available from: https://www.who.int/publications/i/item/9789241548632
[cited 2023 Apr 19].
43. Health and environment country scorecards [internet]. Geneva: World
Health Organization; 2022. Available from: https://www.who.int/teams/
environment-climate-change-and-health/monitoring [cited 2022 Aug 11].
44. EU strategic framework on health and safety at work 2012–2027.
Occupational safety and health in a changing world of work. Brussels:
European Commission; 2021. Available from: https://eur-lex.europa.eu/
legal-content/EN/TXT/?uri=CELEX%3A52021DC0323&qid=1626089672913
#PP1Contents [cited 2023 Apr 19].
45. European occupational diseases statistics (EODS) [internet]. Luxembourg
City: Eurostat; 2022. Available from: https://ec.europa.eu/eurostat/web/
experimental-statistics/european-occupational-diseases-statistics [cited
2022 Aug 11].
46. Hosseinpoor AR, Bergen N. Health inequality monitoring: A practical
application of population health monitoring. In: Verschuuren M, van Oers H,
editors. Population health monitoring: climbing the information pyramid.
New York: Springer International Publishing; 2019. pp. 151–73. doi: http://
dx.doi.org/10.1007/978-3-319-76562-4_8
47. The effect of occupational exposure to solar ultraviolet radiation on
malignant skin melanoma and nonmelanoma skin cancer: a systematic
review and meta-analysis from the WHO/ILO joint estimates of the work-
related burden of disease and injury. Geneva: World Health Organization;
2021. Available from: https://apps.who.int/iris/handle/10665/350569 [cited
2023 Apr 19].
48. Loomis D, Dzhambov AM, Momen NC, Chartres N, Descatha A, Guha N,
et al. The effect of occupational exposure to welding fumes on trachea,
bronchus and lung cancer: a systematic review and meta-analysis from the
WHO/ILO joint estimates of the work-related burden of disease and injury.
Environ Int. 2022 Dec;170:107565. doi: http://dx.doi.org/10.1016/j.envint
.2022.107565 PMID: 36402034
49. Pega F, Govindaraj S, Tran NT. Health service use and health outcomes
among international migrant workers compared with non-migrant
workers: A systematic review and meta-analysis. PLoS One. 2021 Jun
9;16(6):e0252651. doi: http://dx.doi.org/10.1371/journal.pone.0252651
PMID: 34106987
50. Naicker N, Pega F, Rees D, Kgalamono S, Singh T. Health services use and
health outcomes among informal economy workers compared with formal
economy workers: a systematic review and meta-analysis. Int J Environ
Res Public Health. 2021 Mar 19;18(6):3189. doi: http://dx.doi.org/10.3390/
ijerph18063189 PMID: 33808750
51. WHO Director-General’s keynote speech at the opening ceremony of the
World Health Summit – 16 October 2022 [internet]. Geneva: World Health
Organization; 2022. Available from: https://www.who.int/director-general/
speeches/detail/who-director-general-s-keynote-speech-at-the-opening
-ceremony-of-the-world-health-summit---16-october-2022 [cited 2023 Apr
19].
14. Bull World Health Organ 2023;101:418–430Q|doi: http://dx.doi.org/10.2471/BLT.23.289703 430A
Policy & practice
New global indicator for workers’health
Frank Pega et al.
Table
2.
Global,
regional
and
national
mortality
rate
per
100
000
working-age
population
(≥
15
years)
from
diseases
attributable
to
selected
occupational
risk
factors
in
183
countries
for
years
2000,
2010
and
2016
Region,
country
or
area
name
Values
for
the
indicator
by
year
%
change
(95%
UR)
of
the
indicator
between
years
2000
2010
2016
2000–2010
2010–2016
2000–2016
No.
of
deaths
from
work-related
diseases
(95%
UR)
a
Working-age
population,
thousands
b
Deaths
per
100
000
population
(95%
UR)
No.
of
deaths
from
work-related
diseases
(95%
UR)
a
Working-age
population,
thousands
b
Deaths
per
100
000
population
(95%
UR)
No.
of
deaths
from
work-related
diseases
(95%
UR)
a
Working-
age
population,
thousands
b
Deaths
per
100
000
population
(95%
UR)
Global
1
306
102
(1
271
165
to
1
341
039)
4
261
494
30.7
(29.8
to
31.5)
1
405
761
(1
368
657
to
1
442
865)
5
045
358
27.9
(27.1
to
28.6)
1
516
607
(1
472
141
to
1
561
073)
5
484
278
27.7
(26.8
to
28.5)
−9.1
(−12.4
to
−5.6)
−0.8
(−4.7
to
3.2)
−9.8
(−13.3
to
−6.1)
WHO
Region
African
Region
51
514
(50
258
to
52
770)
370
807
13.9
(13.6
to
14.2)
58
348
(56
931
to
59
765)
489
005
11.9
(11.6
to
12.2)
66
343
(64
567
to
68
119)
580
925
11.4
(11.1
to
11.7)
−14.1
(−17.0
to
−11.1)
−4.3
(−7.8
to
−0.9)
−17.8
(−20.8
to
−14.8)
Region
of
the
Americas
129
582
(126
659
to
132
505)
595
277
21.8
(21.3
to
22.3)
131
592
(128
927
to
134
257)
698
613
18.8
(18.5
to
19.2)
137
305
(134
429
to
140
181)
758
942
18.1
(17.7
to
18.5)
−13.5
(−16.0
to
−10.8)
−4.0
(−6.7
to
−1.1)
−16.9
(−19.4
to
−14.2)
Eastern
Mediterranean
Region
73
809
(70
185
to
77
433)
286
589
25.8
(24.5
to
27.0)
87
877
(83
495
to
92
259)
386
987
22.7
(21.6
to
23.8)
97
727
(92
663
to
102
791)
447
609
21.8
(20.7
to
23.0)
−11.8
(−17.8
to
−5.4)
−3.9
(−10.6
to
3.4)
−15.2
(−21.2
to
−9.0)
European
Region
216
022
(211
236
to
220
808)
693
894
31.1
(30.4
to
31.8)
212
083
(208
115
to
216
051)
738
503
28.7
(28.2
to
29.3)
206
219
(202
701
to
209
737)
754
316
27.3
(26.9
to
27.8)
−7.8
(−10.4
to
−5.0)
−4.8
(−7.2
to
−2.3)
−12.2
(−14.6
to
−9.7)
South-East
Asia
Region
374
562
(353
500
to
395
624)
1
042
010
36.0
(33.9
to
38.0)
449
732
(423
652
to
475
812)
1
268
881
35.4
(33.4
to
37.5)
514
564
(482
571
to
546
557)
1
408
816
36.5
(34.3
to
38.8)
−1.4
(−9.1
to
6.8)
3.1
(−5.3
to
12.5)
1.6
(−6.6
to
10.3)
Western
Pacific
Region
460
613
(433
579
to
487
647)
1
272
917
36.2
(34.1
to
38.3)
466
129
(440
585
to
491
673)
1
463
370
31.9
(30.1
to
33.6)
494
449
(464
379
to
524
519)
1
533
668
32.2
(30.3
to
34.2)
−12
(−18.7
to
−4.5)
1.2
(−6.8
to
9.7)
−10.9
(−18.1
to
−3.0)
Countries
Afghanistan
3
047
(2
691
to
3
403)
10
620
28.7
(25.3
to
32.0)
3
887
(3
428
to
4
346)
15
124
25.7
(22.7
to
28.7)
4
382
(3
841
to
4
923)
19
718
22.2
(19.5
to
25.0)
−10.4
(−24.2
to
5.9)
−13.5
(−27.2
to
2.4)
−22.5
(−34.9
to
−7.9)
Albania
381
(332
to
430)
2
180
17.5
(15.2
to
19.8)
451
(393
to
509)
2
286
19.7
(17.2
to
22.3)
487
(426
to
548)
2
356
20.7
(18.1
to
23.3)
12.9
(−5.6
to
35.9)
4.8
(−12.2
to
25.3)
18.3
(−1.2
to
42.2)
(continues.
.
.)
15. Bull World Health Organ 2023;101:418–430Q|doi: http://dx.doi.org/10.2471/BLT.23.289703
430B
Policy & practice
New global indicator for workers’health Frank Pega et al.
Region,
country
or
area
name
Values
for
the
indicator
by
year
%
change
(95%
UR)
of
the
indicator
between
years
2000
2010
2016
2000–2010
2010–2016
2000–2016
No.
of
deaths
from
work-related
diseases
(95%
UR)
a
Working-age
population,
thousands
b
Deaths
per
100
000
population
(95%
UR)
No.
of
deaths
from
work-related
diseases
(95%
UR)
a
Working-age
population,
thousands
b
Deaths
per
100
000
population
(95%
UR)
No.
of
deaths
from
work-related
diseases
(95%
UR)
a
Working-
age
population,
thousands
b
Deaths
per
100
000
population
(95%
UR)
Algeria
3
217
(2
842
to
3
592)
20
375
15.8
(14.0
to
17.6)
3
020
(2
684
to
3
356)
26
162
11.5
(10.3
to
12.8)
3
331
(2
953
to
3
709)
28
737
11.6
(10.3
to
12.9)
−26.9
(−37.7
to
−14.0)
0.4
(−14.9
to
17.9)
−26.6
(−37.7
to
−13.4)
Angola
1
214
(1
068
to
1
360)
8
657
14.0
(12.3
to
15.7)
1
310
(1
152
to
1
468)
12
369
10.6
(9.3
to
11.9)
1
584
(1
378
to
1
790)
15
271
10.4
(9.0
to
11.7)
−24.5
(−36.6
to
−10.4)
−2.1
(−18.3
to
16.7)
−26.0
(−38.3
to
−11.8)
Antigua
and
Barbuda
2
(0
to
5)
54
3.7
(0.0
to
8.4)
2
(0
to
5)
67
3.0
(0.0
to
7.0)
1
(0
to
4)
73
1.4
(0.0
to
2.7)
−18.6
(−117.7
to
435.1)
−54.6
(−156.5
to
183.2)
−63.1
(−178.1
to
191.3)
Argentina
7
439
(6
907
to
7
971)
26
377
28.2
(26.2
to
30.2)
7
558
(7
114
to
8
002)
30
248
25.0
(23.5
to
26.5)
6
991
(6
587
to
7
395)
32
597
21.5
(20.2
to
22.7)
−11.4
(−19.1
to
−2.7)
−14.2
(−20.9
to
−6.7)
−24.0
(−30.6
to
−16.6)
Armenia
596
(542
to
650)
2
277
26.2
(23.8
to
28.5)
627
(579
to
675)
2
317
27.1
(25.0
to
29.1)
590
(545
to
635)
2
341
25.2
(23.3
to
27.1)
3.4
(−8.1
to
16.6)
−6.9
(−16.3
to
3.7)
−3.7
(−14.5
to
8.6)
Australia
5
195
(4
932
to
5
458)
15
026
34.6
(32.8
to
36.3)
5
434
(5
207
to
5
661)
17
938
30.3
(29.0
to
31.6)
5
604
(5
361
to
5
847)
19
664
28.5
(27.3
to
29.7)
−12.4
(−18.0
to
−6.2)
−5.9
(−11.5
to
−0.1)
−17.6
(−22.8
to
−11.9)
Austria
1
639
(1
532
to
1
746)
6
711
24.4
(22.8
to
26.0)
1
698
(1
611
to
1
785)
7
172
23.7
(22.5
to
24.9)
1
719
(1
627
to
1
811)
7
508
22.9
(21.7
to
24.1)
−3.1
(−10.7
to
5.5)
−3.3
(−10.1
to
4.3)
−6.2
(−13.7
to
1.9)
Azerbaijan
998
(875
to
1
121)
5
593
17.8
(15.6
to
20.1)
985
(873
to
1
097)
6
970
14.1
(12.5
to
15.7)
1
013
(896
to
1
130)
7
483
13.5
(12.0
to
15.1)
−20.8
(−33.1
to
−6.1)
−4.2
(−19.0
to
12.6)
−24.1
(−36.2
to
−10.0)
Bahamas
14
(10
to
18)
211
6.6
(4.9
to
8.4)
19
(15
to
23)
260
7.3
(5.7
to
9.0)
20
(15
to
25)
290
6.9
(5.4
to
8.5)
10.2
(−18.5
to
47.7)
−5.7
(−32.0
to
31.8)
3.9
(−24.7
to
42.3)
Bahrain
42
(34
to
50)
464
9.1
(7.4
to
10.7)
52
(44
to
60)
989
5.3
(4.5
to
6.1)
55
(46
to
64)
1135
4.9
(4.1
to
5.6)
−41.9
(−54.0
to
−25.4)
−7.8
(−26.2
to
15.2)
−46.4
(−57.7
to
−31.8)
Bangladesh
21
657
(19
726
to
23
588)
80
479
26.9
(24.5
to
29.3)
31
059
(28
135
to
33
983)
100
371
30.9
(28.0
to
33.9)
36
260
(32
902
to
39
618)
112
554
32.2
(29.2
to
35.2)
15.0
(0.6
to
31.0)
4.1
(−8.8
to
18.7)
19.7
(5.0
to
36.0)
Barbados
33
(26
to
40)
212
15.5
(12.3
to
18.8)
30
(24
to
36)
226
13.3
(10.5
to
16.0)
31
(25
to
37)
234
13.2
(10.6
to
15.9)
−14.8
(−35.5
to
12.7)
−0.2
(−24.8
to
32.3)
−15.0
(−36.3
to
11.6)
(.
.
.continued)
(continues.
.
.)
16. Bull World Health Organ 2023;101:418–430Q|doi: http://dx.doi.org/10.2471/BLT.23.289703 430C
Policy & practice
New global indicator for workers’health
Frank Pega et al.
Region,
country
or
area
name
Values
for
the
indicator
by
year
%
change
(95%
UR)
of
the
indicator
between
years
2000
2010
2016
2000–2010
2010–2016
2000–2016
No.
of
deaths
from
work-related
diseases
(95%
UR)
a
Working-age
population,
thousands
b
Deaths
per
100
000
population
(95%
UR)
No.
of
deaths
from
work-related
diseases
(95%
UR)
a
Working-age
population,
thousands
b
Deaths
per
100
000
population
(95%
UR)
No.
of
deaths
from
work-related
diseases
(95%
UR)
a
Working-
age
population,
thousands
b
Deaths
per
100
000
population
(95%
UR)
Belarus
3
219
(2
891
to
3
547)
8
043
40.0
(36.0
to
44.1)
2
605
(2
305
to
2
905)
8017
32.5
(28.8
to
36.2)
1
899
(1
666
to
2
132)
7
886
24.1
(21.1
to
27.0)
−18.8
(−30.6
to
−5.3)
−25.9
(−37.5
to
−12.1)
−39.8
(−48.9
to
−29.6)
Belgium
3
626
(3
448
to
3
804)
8
476
42.8
(40.7
to
44.9)
3
757
(3
582
to
3
932)
9
092
41.3
(39.4
to
43.2)
3
454
(3
278
to
3
630)
9
422
36.7
(34.8
to
38.5)
−3.4
(−9.8
to
3.3)
−11.3
(−17.2
to
−5.1)
−14.3
(−20.1
to
−8.2)
Belize
21
(17
to
25)
147
14.3
(11.3
to
17.3)
22
(17
to
27)
208
10.6
(8.3
to
12.9)
26
(20
to
32)
252
10.3
(8.3
to
12.4)
−26.1
(−45.3
to
−1.5)
−2.7
(−27.9
to
33.3)
−28.1
(−46.1
to
−4.7)
Benin
548
(493
to
603)
3
767
14.6
(13.1
to
16.0)
737
(665
to
809)
5
166
14.3
(12.9
to
15.7)
922
(823
to
1
021)
6
212
14.8
(13.3
to
16.4)
−1.9
(−15.0
to
13.2)
4.0
(−9.7
to
20.3)
2.0
(−12.1
to
18.4)
Bhutan
139
(124
to
154)
356
39.1
(34.8
to
43.4)
150
(134
to
166)
472
31.8
(28.4
to
35.2)
163
(144
to
182)
540
30.2
(26.8
to
33.6)
−18.6
(−30.1
to
−4.8)
−5.0
(−18.7
to
11.0)
−22.7
(−34.1
to
−9.7)
Bolivia
(Plurinational
State
of
)
1
448
(1
310
to
1
586)
5
241
27.6
(25.0
to
30.3)
1
390
(1
259
to
1
521)
6
583
21.1
(19.1
to
23.1)
1
472
(1
328
to
1
616)
7
503
19.6
(17.7
to
21.5)
−23.6
(−33.4
to
−12.3)
−7.1
(−18.8
to
6.5)
−29.0
(−38.0
to
−18.4)
Bosnia
and
Herzegovina
718
(639
to
797)
2
974
24.1
(21.5
to
26.8)
695
(628
to
762)
3
122
22.3
(20.1
to
24.4)
603
(547
to
659)
2
881
20.9
(19.0
to
22.9)
−7.8
(−20.2
to
6.9)
−6.0
(−17.7
to
7.6)
−13.3
(−24.7
to
0.5)
Botswana
138
(119
to
157)
1
008
13.7
(11.8
to
15.6)
178
(155
to
201)
1
292
13.8
(12.0
to
15.6)
196
(168
to
224)
1
410
13.9
(11.9
to
15.9)
0.6
(−16.0
to
21.5)
0.9
(−16.7
to
22.7)
1.5
(−16.9
to
23.5)
Brazil
20
990
(19
496
to
22
484)
122
461
17.1
(15.9
to
18.4)
20
736
(19
394
to
22
078)
147
131
14.1
(13.2
to
15.0)
20
844
(19
560
to
22
128)
160
705
13.0
(12.2
to
13.8)
−17.8
(−25.4
to
−9.5)
−8.0
(−15.7
to
0.7)
−24.3
(−31.1
to
−16.7)
Brunei
Darussalam
15
(11
to
19)
231
6.5
(5.0
to
8.0)
21
(17
to
25)
288
7.3
(5.8
to
8.8)
32
(26
to
38)
320
10.0
(8.3
to
11.8)
12.4
(−14.7
to
52.9)
37.2
(7.0
to
76.9)
54.3
(16.2
to
108.6)
Bulgaria
1
009
(916
to
1
102)
6
745
15.0
(13.6
to
16.3)
954
(887
to
1
021)
6423
14.9
(13.8
to
15.9)
856
(799
to
913)
6
128
14.0
(13.0
to
14.9)
−0.7
(−11.6
to
11.9)
−6.0
(−15.0
to
3.6)
−6.6
(−16.6
to
4.8)
Burkina
Faso
740
(649
to
831)
6
179
12.0
(10.5
to
13.4)
914
(803
to
1
025)
8
392
10.9
(9.6
to
12.2)
1
073
(941
to
1
205)
10
183
10.5
(9.2
to
11.8)
−9.1
(−23.8
to
8.9)
−3.3
(−18.5
to
15.4)
−12.0
(−26.1
to
5.0)
(.
.
.continued)
(continues.
.
.)
17. Bull World Health Organ 2023;101:418–430Q|doi: http://dx.doi.org/10.2471/BLT.23.289703
430D
Policy & practice
New global indicator for workers’health Frank Pega et al.
Region,
country
or
area
name
Values
for
the
indicator
by
year
%
change
(95%
UR)
of
the
indicator
between
years
2000
2010
2016
2000–2010
2010–2016
2000–2016
No.
of
deaths
from
work-related
diseases
(95%
UR)
a
Working-age
population,
thousands
b
Deaths
per
100
000
population
(95%
UR)
No.
of
deaths
from
work-related
diseases
(95%
UR)
a
Working-age
population,
thousands
b
Deaths
per
100
000
population
(95%
UR)
No.
of
deaths
from
work-related
diseases
(95%
UR)
a
Working-
age
population,
thousands
b
Deaths
per
100
000
population
(95%
UR)
Burundi
446
(390
to
502)
3185
14.0
(12.2
to
15.8)
598
(532
to
664)
4
759
12.6
(11.2
to
13.9)
702
(621
to
783)
5
709
12.3
(10.9
to
13.7)
−10.3
(−24.1
to
6.7)
−2.1
(−16.4
to
14.8)
−12.2
(−26
to
4.0)
Cabo
Verde
43
(35
to
51)
244
17.6
(14.5
to
20.7)
47
(38
to
56)
333
14.1
(11.5
to
16.7)
40
(33
to
47)
374
10.7
(8.9
to
12.5)
−20.0
(−38.6
to
4.2)
−24.1
(−40.5
to
−2.0)
−39.3
(−53.1
to
−21.7)
Cambodia
2
012
(1
817
to
2
207)
7
100
28.3
(25.6
to
31.1)
2322
(2
101
to
2
543)
9
542
24.3
(22.0
to
26.7)
2
586
(2
332
to
2
840)
10
817
23.9
(21.6
to
26.3)
−14.1
(−25.0
to
−1.4)
−1.8
(−14.6
to
13.0)
−15.6
(−26.6
to
−3.1)
Cameroon
1
109
(1
002
to
1
216)
8519
13.0
(11.8
to
14.3)
1
387
(1
254
to
1
520)
11
454
12.1
(11.0
to
13.3)
1
777
(1
592
to
1962)
13
623
13.0
(11.7
to
14.4)
−7.0
(−19.1
to
7.0)
7.7
(−6.6
to
24.0)
0.2
(−13.2
to
15.4)
Canada
7
661
(7
266
to
8
056)
24
727
31.0
(29.4
to
32.6)
8
182
(7
808
to
8
556)
28
517
28.7
(27.4
to
30.0)
8
507
(8
098
to
8
916)
30
599
27.8
(26.5
to
29.1)
−7.4
(−13.5
to
−0.6)
−3.1
(−9.4
to
3.5)
−10.3
(−16.3
to
−3.6)
Central
African
Republic
427
(374
to
480)
2
065
20.7
(18.1
to
23.3)
449
(395
to
503)
2
454
18.3
(16.1
to
20.5)
391
(339
to
443)
2498
15.7
(13.6
to
17.7)
−11.5
(−25.6
to
5.6)
−14.4
(−28.5
to
2.0)
−24.3
(−37.1
to
−9.3)
Chad
769
(685
to
853)
4
272
18.0
(16.0
to
20.0)
979
(877
to
1
081)
6123
16.0
(14.3
to
17.7)
1
115
(989
to
1
241)
7
625
14.6
(13.0
to
16.3)
−11.2
(−23.7
to
3.6)
−8.5
(−21.7
to
6.5)
−18.8
(−30.5
to
−4.6)
Chile
1
259
(1
156
to
1
362)
11
149
11.3
(10.4
to
12.2)
1
602
(1
492
to
1
712)
13
295
12.1
(11.2
to
12.9)
1
654
(1
541
to
1
767)
14
513
11.4
(10.6
to
12.2)
6.7
(−4.1
to
18.9)
−5.4
(−14.2
to
4.4)
0.9
(−9.2
to
12.1)
China
387
582
(360
658
to
414
506)
970
640
39.9
(37.2
to
42.7)
373
095
(347
713
to
398
477)
1
113
391
33.5
(31.2
to
35.8)
392
291
(362
400
to
422
182)
1
159
596
33.8
(31.3
to
36.4)
−16.1
(−23.8
to
−7.6)
1.0
(−9.0
to
12.0)
−15.3
(−23.6
to
−6.1)
Colombia
4
522
(4
113
to
4
931)
26
721
16.9
(15.4
to
18.5)
5
199
(4
721
to
5
677)
32
891
15.8
(14.4
to
17.3)
5
784
(5
230
to
6
338)
36
591
15.8
(14.3
to
17.3)
−6.6
(−17.9
to
6.5)
0.0
(−12.8
to
14.3)
−6.6
(−18
to
7.0)
Comoros
24
(19
to
29)
304
7.9
(6.3
to
9.5)
25
(19
to
31)
407
6.2
(4.8
to
7.5)
30
(23
to
37)
478
6.3
(5.0
to
7.6)
−22.2
(−42.7
to
5.1)
2.2
(−24.8
to
39.8)
−20.5
(−41.1
to
7.2)
Congo
211
(183
to
239)
1
809
11.7
(10.1
to
13.2)
205
(179
to
231)
2
494
8.2
(7.2
to
9.2)
213
(185
to
241)
2
885
7.4
(6.4
to
8.4)
−29.6
(−41.2
to
−15.1)
−10.2
(−25.2
to
7.5)
−36.7
(−47.6
to
−23.1)
(.
.
.continued)
(continues.
.
.)
18. Bull World Health Organ 2023;101:418–430Q|doi: http://dx.doi.org/10.2471/BLT.23.289703 430E
Policy & practice
New global indicator for workers’health
Frank Pega et al.
Region,
country
or
area
name
Values
for
the
indicator
by
year
%
change
(95%
UR)
of
the
indicator
between
years
2000
2010
2016
2000–2010
2010–2016
2000–2016
No.
of
deaths
from
work-related
diseases
(95%
UR)
a
Working-age
population,
thousands
b
Deaths
per
100
000
population
(95%
UR)
No.
of
deaths
from
work-related
diseases
(95%
UR)
a
Working-age
population,
thousands
b
Deaths
per
100
000
population
(95%
UR)
No.
of
deaths
from
work-related
diseases
(95%
UR)
a
Working-
age
population,
thousands
b
Deaths
per
100
000
population
(95%
UR)
Costa
Rica
338
(304
to
372)
2
728
12.4
(11.1
to
13.6)
384
(345
to
423)
3
465
11.1
(10.0
to
12.2)
415
(371
to
459)
3
829
10.8
(9.7
to
12.0)
−10.6
(−22.5
to
2.8)
−2.2
(−15.7
to
13.4)
−12.5
(−24.2
to
1.1)
Côte
d’Ivoire
2
072
(1
843
to
2
301)
9
275
22.3
(19.9
to
24.8)
2914
(2
602
to
3
226)
11
576
25.2
(22.5
to
27.9)
3
406
(3
017
to
3
795)
13
726
24.8
(22.0
to
27.7)
12.7
(−3.6
to
32.0)
−1.4
(−15.7
to
15.6)
11.1
(−5.2
to
30.9)
Croatia
952
(891
to
1
013)
3
661
26.0
(24.3
to
27.7)
1
235
(1
167
to
1
303)
3
660
33.8
(31.9
to
35.6)
1
187
(1
115
to
1
259)
3
601
33.0
(31.0
to
35.0)
29.8
(19.3
to
40.9)
−2.3
(−10.0
to
5.8)
26.8
(16.0
to
38.6)
Cuba
2
077
(1
898
to
2
256)
8
725
23.8
(21.8
to
25.9)
2
311
(2
128
to
2
494)
9
234
25.0
(23.0
to
27.0)
2
379
(2
196
to
2
562)
9
456
25.2
(23.2
to
27.1)
5.1
(−6.4
to
18.1)
0.5
(−10.0
to
12.1)
5.7
(−5.7
to
18.8)
Cyprus
147
(128
to
166)
732
20.1
(17.5
to
22.7)
156
(138
to
174)
914
17.1
(15.1
to
19.1)
169
(146
to
192)
973
17.4
(15.1
to
19.7)
−15.0
(−28.6
to
1.5)
1.8
(−15.1
to
21.6)
−13.5
(−28.6
to
4.2)
Czechia
1
705
(1
586
to
1
824)
8
600
19.8
(18.4
to
21.2)
1
519
(1
428
to
1
610)
9
036
16.8
(15.8
to
17.8)
1
492
(1
408
to
1
576)
9
004
16.6
(15.6
to
17.5)
−15.2
(−22.7
to
−7.0)
−1.4
(−9.2
to
7.1)
−16.4
(−23.5
to
−8.4)
Democratic
People's
Republic
of
Korea
7
567
(6
873
to
8
261)
16
982
44.6
(40.5
to
48.7)
12
914
(11
648
to
14
180)
18
991
68.0
(61.3
to
74.7)
14
084
(12
690
to
15
478)
20
069
70.2
(63.2
to
77.1)
52.6
(33.2
to
74.7)
3.2
(−9.9
to
18.5)
57.5
(38.1
to
80.2)
Democratic
Republic
of
the
Congo
2
483
(2
201
to
2
765)
25
654
9.7
(8.6
to
10.8)
2
954
(2
634
to
3
274)
34
774
8.5
(7.6
to
9.4)
3
452
(3
062
to
3
842)
42
273
8.2
(7.2
to
9.1)
−12.2
(−24.9
to
2.6)
−3.9
(−18.0
to
12.7)
−15.6
(−28.1
to
−1.1)
Denmark
1
779
(1
694
to
1
864)
4
355
40.9
(38.9
to
42.8)
1
756
(1
672
to
1
840)
4558
38.5
(36.7
to
40.4)
1
820
(1
725
to
1915)
4
763
38.2
(36.2
to
40.2)
−5.7
(−11.9
to
0.8)
−0.8
(−7.5
to
6.5)
−6.5
(−13.1
to
0.4)
Djibouti
52
(42
to
62)
424
12.3
(9.9
to
14.7)
64
(53
to
75)
567
11.3
(9.3
to
13.3)
82
(67
to
97)
647
12.7
(10.5
to
14.9)
−8.0
(−29.3
to
21.1)
12.2
(−13.5
to
45.4)
3.2
(−20.6
to
34.7)
Dominican
Republic
842
(730
to
954)
5
514
15.3
(13.2
to
17.3)
1
021
(887
to
1
155)
6
727
15.2
(13.2
to
17.2)
1
182
(1
022
to
1
342)
7
431
15.9
(13.8
to
18.1)
−0.6
(−17.5
to
20.2)
4.8
(−13.2
to
26.4)
4.2
(−14.3
to
26.0)
Ecuador
1
071
(985
to
1
157)
8
247
13
(11.9
to
14.0)
1
065
(983
to
1
147)
10
352
10.3
(9.5
to
11.1)
1
319
(1
211
to
1
427)
11
757
11.2
(10.3
to
12.1)
−20.8
(−29.2
to
−11.3)
9.1
(−2.6
to
22.1)
−13.6
(−23.0
to
−2.9)
(.
.
.continued)
(continues.
.
.)
19. Bull World Health Organ 2023;101:418–430Q|doi: http://dx.doi.org/10.2471/BLT.23.289703
430F
Policy & practice
New global indicator for workers’health Frank Pega et al.
Region,
country
or
area
name
Values
for
the
indicator
by
year
%
change
(95%
UR)
of
the
indicator
between
years
2000
2010
2016
2000–2010
2010–2016
2000–2016
No.
of
deaths
from
work-related
diseases
(95%
UR)
a
Working-age
population,
thousands
b
Deaths
per
100
000
population
(95%
UR)
No.
of
deaths
from
work-related
diseases
(95%
UR)
a
Working-age
population,
thousands
b
Deaths
per
100
000
population
(95%
UR)
No.
of
deaths
from
work-related
diseases
(95%
UR)
a
Working-
age
population,
thousands
b
Deaths
per
100
000
population
(95%
UR)
Egypt
11
710
(10
355
to
13
065)
43
462
26.9
(23.8
to
30.1)
15
940
(14
084
to
17
796)
55
817
28.6
(25.2
to
31.9)
18
280
(15
999
to
20
561)
62
670
29.2
(25.5
to
32.8)
6.0
(−10.4
to
25.2)
2.1
(−13.8
to
21.1)
8.3
(−8.8
to
28.6)
El
Salvador
465
(411
to
519)
3
731
12.5
(11.0
to
13.9)
427
(378
to
476)
4
227
10.1
(9.0
to
11.3)
461
(409
to
513)
4
586
10.1
(8.9
to
11.2)
−19.0
(−30.9
to
−4.5)
−0.5
(−15.1
to
17.1)
−19.4
(−31.3
to
−4.8)
Equatorial
Guinea
62
(51
to
73)
360
17.2
(14.2
to
20.2)
58
(47
to
69)
580
10.0
(8.1
to
11.9)
67
(55
to
79)
760
8.8
(7.3
to
10.3)
−42.0
(−54.9
to
−26.2)
−11.8
(−31.4
to
13.6)
−48.9
(−60.0
to
−34.7)
Eritrea
362
(315
to
409)
1
245
29.1
(25.3
to
32.9)
403
(353
to
453)
1
919
21.0
(18.4
to
23.6)
415
(359
to
471)
1
956
21.2
(18.4
to
24.1)
−27.8
(−39.5
to
−13.3)
1.0
(−16.0
to
21.1)
−27.1
(−39.6
to
−11.6)
Estonia
225
(201
to
249)
1
153
19.5
(17.4
to
21.6)
171
(154
to
188)
1
131
15.1
(13.7
to
16.6)
150
(135
to
165)
1
104
13.6
(12.2
to
14.9)
−22.5
(−33.1
to
−9.8)
−10.2
(−21.9
to
2.9)
−30.4
(−40.0
to
−19.3)
Eswatini
88
(74
to
102)
573
15.4
(13.0
to
17.8)
97
(83
to
111)
637
15.2
(13.1
to
17.4)
97
(81
to
113)
683
14.2
(11.8
to
16.6)
−0.8
(−19.4
to
23.0)
−6.8
(−25.5
to
15.4)
−7.6
(−26.9
to
15.5)
Ethiopia
3
481
(3
147
to
3
815)
35
455
9.8
(8.9
to
10.8)
4
139
(3
753
to
4
525)
48
262
8.6
(7.8
to
9.4)
5020
(4
521
to
5
519)
60
379
8.3
(7.5
to
9.1)
−12.7
(−23.7
to
−0.1)
−3.1
(−15.7
to
10.8)
−15.3
(−26.3
to
−2.6)
Fiji
140
(121
to
159)
527
26.6
(22.9
to
30.3)
124
(104
to
144)
610
20.3
(17.1
to
23.6)
123
(104
to
142)
613
20.1
(16.9
to
23.3)
−23.6
(−38.9
to
−5.5)
−1.2
(−21.6
to
24.5)
−24.5
(−38.9
to
−6.9)
Finland
1
037
(974
to
1
100)
4
247
24.4
(22.9
to
25.9)
1
091
(1
030
to
1
152)
4
479
24.4
(23.0
to
25.7)
1
063
(1
000
to
1
126)
4
600
23.1
(21.7
to
24.5)
−0.3
(−8.4
to
8.7)
−5.1
(−12.7
to
3.1)
−5.4
(−13.3
to
3.0)
France
12
448
(11
977
to
12
919)
47
857
26.0
(25.0
to
27.0)
14
400
(13
876
to
14
924)
51
261
28.1
(27.1
to
29.1)
15
780
(15
127
to
16
433)
52
869
29.9
(28.6
to
31.1)
8.0
(2.4
to
13.8)
6.3
(0.5
to
12.3)
14.8
(8.4
to
21.5)
Gabon
106
(90
to
122)
725
14.6
(12.4
to
16.9)
98
(83
to
113)
1
016
9.6
(8.1
to
11.2)
102
(86
to
118)
1
273
8.0
(6.7
to
9.3)
−34.1
(−47.3
to
−17.2)
−16.9
(−34.5
to
4.5)
−45.2
(−56.3
to
−31.3)
(.
.
.continued)
(continues.
.
.)