SlideShare a Scribd company logo
1 of 2
Download to read offline
Throughout 2017, the S&P 500 Index recorded 62 new
closing highs in 251 days of trading. In the first three
weeks of January 2018 alone, the index crossed 10
new record closing highs in 13 days of trading. With
stock indices continuing to set new highs, does this
mean negative returns for stocks are on the horizon?
When addressing this question, it is helpful to keep
the following in mind:
nn Every day, stocks have a positive expected return
regardless of whether markets are at an all-time
high or not.
nn While expected returns are always positive, positive
realized returns are never guaranteed and may deviate
from expectations.
The reason we can expect positive returns, regardless
of the current market level, is attributable to the
mechanism by which markets set prices. Stock prices are
the result of the interaction of many willing buyers and
sellers. Current prices reflect the discounted value of
future cash flows expected by those buyers and sellers.
But, there is uncertainty around these future cash flows
for stocks, and investors bear the risk of potential losses.
If the buyer of a stock views the future cash flows as
more uncertain, they will likely want to pay a lower price
for the stock. They will only transact when the price
reaches a level where they expect to earn a positive
return. For these reasons, we expect stock market prices
to be set to a level at which the required rate of return
for investing in stocks is positive, whether the market
is at a new high, a new low, or something in between.
Otherwise, why would buyers in the marketplace
willingly transact at a given price?
History can help illustrate this point and show us
that a market index reaching an all-time high has not
necessarily provided actionable information for investors.
Exhibit 1 measures monthly closing levels of the
S&P 500 Index from the beginning of 1926 to the
end of 2017. Of the 1,103 months observed, almost
one‑third represented new closing highs for the index.
This may not be surprising for some. Since markets
generally tend to go up over time, new highs should
be a relatively common occurrence. Considering this, it is
worth posing the question: If prices increasing over time
was a troubling development, what would be the point
of investing at all?
This data also shows that looking ahead on a one-,
three-, and five-year basis, the percent of cases when
New Year, New Market Highs
February 2018
Every day stocks have
a positive expected return
regardless of whether
markets are at an all‑time
high or not.
DIMENSIONAL FUND ADVISORS 2
Dimensional Fund Advisors LP is an investment advisor registered with the Securities and Exchange Commission.
Indices are not available for direct investment.Their performance does not reflect the expenses associated with the management of an actual
portfolio. Past performance is not a guarantee of future results. Diversification does not eliminate the risk of market loss.
RM63136 02/18 1381973
the index was higher or lower after a new market high is
about the same when compared to any other previous
price level. In other words, positive and negative returns
tended to make up a similar proportion of returns after
the fact, regardless of whether a new high was reached
or not. For example, for a three-year look-ahead period,
the index was higher around 84% of the time both after
hitting a new closing high as well as after any other
previous level. Additionally, this data shows us that the
average return experienced after those highs vs. any
other level is also quite similar. For example, for the
three-year look-ahead period, the average cumulative
return after a new high was 51.1% vs. 51.8% for any other
level. These results indicate that new index highs have
historically not been useful predictors of future returns.
Another reason investors should be cautious about
reevaluating their approach at an all-time high is the
potential opportunity cost of switching in and out
of the market. Last year, the S&P 500 Index returned
more than 20%, and yet 2017 started with three new
market highs during the first 20 trading sessions.1
The opportunity cost paid by investors reacting to
the new highs by selling stocks could have been
substantial. There is no reliable way to predict when
stock returns will be positive or negative, and while
the long-term average return of the US stock market2
has been around 10% since 1926, year‑to-year results
often deviate markedly from the historical average.3
Investors looking to capture what the equity markets
offer over the long term are likely well served by sticking
with their approach rather than making changes based
on short-term noise.
CONCLUSION
The question of whether new market highs portend a
fall in stocks can often be translated to another, more
general question: “Is now a good time for me to be
invested?” The evidence suggests that the current state
of the market is not helpful in answering this question.
Rather, an appropriate answer is highly dependent
upon an investor’s unique situation and their risk and
return objectives. For investors concluding stock market
exposure is appropriate, a disciplined approach with
a long-term view is likely a more prudent course of
action than reacting to new market highs.
Exhibit 1: S&P 500 Total Return Index Highs
Percent of cases where index is higher after monthly closing high vs. any monthly closing level, January 1926–December 2017
Look-Ahead Period (N)
Percent of Cases
Where Index is Higher
(after new high)
Average Gain
(after new high)
Percent of Cases Where Index
is Higher
(after any previous level)
Average Gain
(after any previous level)
1 year 80.9% 19.6% 75.0% 21.1%
3 years 84.2% 51.1% 83.5% 51.8%
5 years 84.2% 89.2% 87.5% 85.0%
For illustrative purposes only. Average gain is a simple average of all positive returns for the 1-, 3-, or 5-year periods analyzed. © 2018 S&P Dow Jones Indices LLC,
a division of S&P Global. All rights reserved.
1.	 S&P 500 Index data © 2018 S&P Dow Jones Indices LLC, a division of S&P Global. All rights reserved.
2.	 As measured by the S&P 500 Index.
3.	 For more on this topic, please see “The Uncommon Average” from October 2017.

More Related Content

More from Better Financial Education

More from Better Financial Education (20)

Key questions for the long term investor
Key questions for the long term investorKey questions for the long term investor
Key questions for the long term investor
 
The uncommon average
The uncommon averageThe uncommon average
The uncommon average
 
Retirement phases plan
Retirement phases planRetirement phases plan
Retirement phases plan
 
Portfolio perspectives-january-2017
Portfolio perspectives-january-2017Portfolio perspectives-january-2017
Portfolio perspectives-january-2017
 
Robo advisor-whitepaper
Robo advisor-whitepaperRobo advisor-whitepaper
Robo advisor-whitepaper
 
Portfolio perspectives-december-2016
Portfolio perspectives-december-2016Portfolio perspectives-december-2016
Portfolio perspectives-december-2016
 
Afs 2016-certainty of lifestyle shared
Afs 2016-certainty of lifestyle sharedAfs 2016-certainty of lifestyle shared
Afs 2016-certainty of lifestyle shared
 
4 steps-effective-portfolio-trifold-1
4 steps-effective-portfolio-trifold-14 steps-effective-portfolio-trifold-1
4 steps-effective-portfolio-trifold-1
 
The mathematics of investing
The mathematics of investingThe mathematics of investing
The mathematics of investing
 
Fundamentals of asset class investing
Fundamentals of asset class investingFundamentals of asset class investing
Fundamentals of asset class investing
 
Index reconstitution the price of tracking
Index reconstitution  the price of trackingIndex reconstitution  the price of tracking
Index reconstitution the price of tracking
 
Social security as longevity insurance
Social security as longevity insuranceSocial security as longevity insurance
Social security as longevity insurance
 
Investor discipline
Investor disciplineInvestor discipline
Investor discipline
 
How working longer affect social security
How working longer affect social securityHow working longer affect social security
How working longer affect social security
 
Survivor income replacement
Survivor income replacementSurvivor income replacement
Survivor income replacement
 
Paying off student loans
Paying off student loansPaying off student loans
Paying off student loans
 
2015 claiming under new rules
2015 claiming under new rules2015 claiming under new rules
2015 claiming under new rules
 
The cost of_tracking_an_index_us
The cost of_tracking_an_index_usThe cost of_tracking_an_index_us
The cost of_tracking_an_index_us
 
Second hand news
Second hand newsSecond hand news
Second hand news
 
Focus on time in the market
Focus on time in the marketFocus on time in the market
Focus on time in the market
 

Recently uploaded

Call Girls Near Me WhatsApp:+91-9833363713
Call Girls Near Me WhatsApp:+91-9833363713Call Girls Near Me WhatsApp:+91-9833363713
Call Girls Near Me WhatsApp:+91-9833363713Sonam Pathan
 
NO1 Certified Ilam kala Jadu Specialist Expert In Bahawalpur, Sargodha, Sialk...
NO1 Certified Ilam kala Jadu Specialist Expert In Bahawalpur, Sargodha, Sialk...NO1 Certified Ilam kala Jadu Specialist Expert In Bahawalpur, Sargodha, Sialk...
NO1 Certified Ilam kala Jadu Specialist Expert In Bahawalpur, Sargodha, Sialk...Amil Baba Dawood bangali
 
AfRESFullPaper22018EmpiricalPerformanceofRealEstateInvestmentTrustsandShareho...
AfRESFullPaper22018EmpiricalPerformanceofRealEstateInvestmentTrustsandShareho...AfRESFullPaper22018EmpiricalPerformanceofRealEstateInvestmentTrustsandShareho...
AfRESFullPaper22018EmpiricalPerformanceofRealEstateInvestmentTrustsandShareho...yordanosyohannes2
 
Ch 4 investment Intermediate financial Accounting
Ch 4 investment Intermediate financial AccountingCh 4 investment Intermediate financial Accounting
Ch 4 investment Intermediate financial AccountingAbdi118682
 
Tenets of Physiocracy History of Economic
Tenets of Physiocracy History of EconomicTenets of Physiocracy History of Economic
Tenets of Physiocracy History of Economiccinemoviesu
 
Economic Risk Factor Update: April 2024 [SlideShare]
Economic Risk Factor Update: April 2024 [SlideShare]Economic Risk Factor Update: April 2024 [SlideShare]
Economic Risk Factor Update: April 2024 [SlideShare]Commonwealth
 
原版1:1复刻堪萨斯大学毕业证KU毕业证留信学历认证
原版1:1复刻堪萨斯大学毕业证KU毕业证留信学历认证原版1:1复刻堪萨斯大学毕业证KU毕业证留信学历认证
原版1:1复刻堪萨斯大学毕业证KU毕业证留信学历认证jdkhjh
 
Bladex Earnings Call Presentation 1Q2024
Bladex Earnings Call Presentation 1Q2024Bladex Earnings Call Presentation 1Q2024
Bladex Earnings Call Presentation 1Q2024Bladex
 
Financial Leverage Definition, Advantages, and Disadvantages
Financial Leverage Definition, Advantages, and DisadvantagesFinancial Leverage Definition, Advantages, and Disadvantages
Financial Leverage Definition, Advantages, and Disadvantagesjayjaymabutot13
 
(中央兰开夏大学毕业证学位证成绩单-案例)
(中央兰开夏大学毕业证学位证成绩单-案例)(中央兰开夏大学毕业证学位证成绩单-案例)
(中央兰开夏大学毕业证学位证成绩单-案例)twfkn8xj
 
原版1:1复刻温哥华岛大学毕业证Vancouver毕业证留信学历认证
原版1:1复刻温哥华岛大学毕业证Vancouver毕业证留信学历认证原版1:1复刻温哥华岛大学毕业证Vancouver毕业证留信学历认证
原版1:1复刻温哥华岛大学毕业证Vancouver毕业证留信学历认证rjrjkk
 
212MTAMount Durham University Bachelor's Diploma in Technology
212MTAMount Durham University Bachelor's Diploma in Technology212MTAMount Durham University Bachelor's Diploma in Technology
212MTAMount Durham University Bachelor's Diploma in Technologyz xss
 
《加拿大本地办假证-寻找办理Dalhousie毕业证和达尔豪斯大学毕业证书的中介代理》
《加拿大本地办假证-寻找办理Dalhousie毕业证和达尔豪斯大学毕业证书的中介代理》《加拿大本地办假证-寻找办理Dalhousie毕业证和达尔豪斯大学毕业证书的中介代理》
《加拿大本地办假证-寻找办理Dalhousie毕业证和达尔豪斯大学毕业证书的中介代理》rnrncn29
 
Governor Olli Rehn: Dialling back monetary restraint
Governor Olli Rehn: Dialling back monetary restraintGovernor Olli Rehn: Dialling back monetary restraint
Governor Olli Rehn: Dialling back monetary restraintSuomen Pankki
 
(办理原版一样)QUT毕业证昆士兰科技大学毕业证学位证留信学历认证成绩单补办
(办理原版一样)QUT毕业证昆士兰科技大学毕业证学位证留信学历认证成绩单补办(办理原版一样)QUT毕业证昆士兰科技大学毕业证学位证留信学历认证成绩单补办
(办理原版一样)QUT毕业证昆士兰科技大学毕业证学位证留信学历认证成绩单补办fqiuho152
 
Vp Girls near me Delhi Call Now or WhatsApp
Vp Girls near me Delhi Call Now or WhatsAppVp Girls near me Delhi Call Now or WhatsApp
Vp Girls near me Delhi Call Now or WhatsAppmiss dipika
 
NO1 WorldWide Love marriage specialist baba ji Amil Baba Kala ilam powerful v...
NO1 WorldWide Love marriage specialist baba ji Amil Baba Kala ilam powerful v...NO1 WorldWide Love marriage specialist baba ji Amil Baba Kala ilam powerful v...
NO1 WorldWide Love marriage specialist baba ji Amil Baba Kala ilam powerful v...Amil baba
 
Bladex 1Q24 Earning Results Presentation
Bladex 1Q24 Earning Results PresentationBladex 1Q24 Earning Results Presentation
Bladex 1Q24 Earning Results PresentationBladex
 
Classical Theory of Macroeconomics by Adam Smith
Classical Theory of Macroeconomics by Adam SmithClassical Theory of Macroeconomics by Adam Smith
Classical Theory of Macroeconomics by Adam SmithAdamYassin2
 
Monthly Market Risk Update: April 2024 [SlideShare]
Monthly Market Risk Update: April 2024 [SlideShare]Monthly Market Risk Update: April 2024 [SlideShare]
Monthly Market Risk Update: April 2024 [SlideShare]Commonwealth
 

Recently uploaded (20)

Call Girls Near Me WhatsApp:+91-9833363713
Call Girls Near Me WhatsApp:+91-9833363713Call Girls Near Me WhatsApp:+91-9833363713
Call Girls Near Me WhatsApp:+91-9833363713
 
NO1 Certified Ilam kala Jadu Specialist Expert In Bahawalpur, Sargodha, Sialk...
NO1 Certified Ilam kala Jadu Specialist Expert In Bahawalpur, Sargodha, Sialk...NO1 Certified Ilam kala Jadu Specialist Expert In Bahawalpur, Sargodha, Sialk...
NO1 Certified Ilam kala Jadu Specialist Expert In Bahawalpur, Sargodha, Sialk...
 
AfRESFullPaper22018EmpiricalPerformanceofRealEstateInvestmentTrustsandShareho...
AfRESFullPaper22018EmpiricalPerformanceofRealEstateInvestmentTrustsandShareho...AfRESFullPaper22018EmpiricalPerformanceofRealEstateInvestmentTrustsandShareho...
AfRESFullPaper22018EmpiricalPerformanceofRealEstateInvestmentTrustsandShareho...
 
Ch 4 investment Intermediate financial Accounting
Ch 4 investment Intermediate financial AccountingCh 4 investment Intermediate financial Accounting
Ch 4 investment Intermediate financial Accounting
 
Tenets of Physiocracy History of Economic
Tenets of Physiocracy History of EconomicTenets of Physiocracy History of Economic
Tenets of Physiocracy History of Economic
 
Economic Risk Factor Update: April 2024 [SlideShare]
Economic Risk Factor Update: April 2024 [SlideShare]Economic Risk Factor Update: April 2024 [SlideShare]
Economic Risk Factor Update: April 2024 [SlideShare]
 
原版1:1复刻堪萨斯大学毕业证KU毕业证留信学历认证
原版1:1复刻堪萨斯大学毕业证KU毕业证留信学历认证原版1:1复刻堪萨斯大学毕业证KU毕业证留信学历认证
原版1:1复刻堪萨斯大学毕业证KU毕业证留信学历认证
 
Bladex Earnings Call Presentation 1Q2024
Bladex Earnings Call Presentation 1Q2024Bladex Earnings Call Presentation 1Q2024
Bladex Earnings Call Presentation 1Q2024
 
Financial Leverage Definition, Advantages, and Disadvantages
Financial Leverage Definition, Advantages, and DisadvantagesFinancial Leverage Definition, Advantages, and Disadvantages
Financial Leverage Definition, Advantages, and Disadvantages
 
(中央兰开夏大学毕业证学位证成绩单-案例)
(中央兰开夏大学毕业证学位证成绩单-案例)(中央兰开夏大学毕业证学位证成绩单-案例)
(中央兰开夏大学毕业证学位证成绩单-案例)
 
原版1:1复刻温哥华岛大学毕业证Vancouver毕业证留信学历认证
原版1:1复刻温哥华岛大学毕业证Vancouver毕业证留信学历认证原版1:1复刻温哥华岛大学毕业证Vancouver毕业证留信学历认证
原版1:1复刻温哥华岛大学毕业证Vancouver毕业证留信学历认证
 
212MTAMount Durham University Bachelor's Diploma in Technology
212MTAMount Durham University Bachelor's Diploma in Technology212MTAMount Durham University Bachelor's Diploma in Technology
212MTAMount Durham University Bachelor's Diploma in Technology
 
《加拿大本地办假证-寻找办理Dalhousie毕业证和达尔豪斯大学毕业证书的中介代理》
《加拿大本地办假证-寻找办理Dalhousie毕业证和达尔豪斯大学毕业证书的中介代理》《加拿大本地办假证-寻找办理Dalhousie毕业证和达尔豪斯大学毕业证书的中介代理》
《加拿大本地办假证-寻找办理Dalhousie毕业证和达尔豪斯大学毕业证书的中介代理》
 
Governor Olli Rehn: Dialling back monetary restraint
Governor Olli Rehn: Dialling back monetary restraintGovernor Olli Rehn: Dialling back monetary restraint
Governor Olli Rehn: Dialling back monetary restraint
 
(办理原版一样)QUT毕业证昆士兰科技大学毕业证学位证留信学历认证成绩单补办
(办理原版一样)QUT毕业证昆士兰科技大学毕业证学位证留信学历认证成绩单补办(办理原版一样)QUT毕业证昆士兰科技大学毕业证学位证留信学历认证成绩单补办
(办理原版一样)QUT毕业证昆士兰科技大学毕业证学位证留信学历认证成绩单补办
 
Vp Girls near me Delhi Call Now or WhatsApp
Vp Girls near me Delhi Call Now or WhatsAppVp Girls near me Delhi Call Now or WhatsApp
Vp Girls near me Delhi Call Now or WhatsApp
 
NO1 WorldWide Love marriage specialist baba ji Amil Baba Kala ilam powerful v...
NO1 WorldWide Love marriage specialist baba ji Amil Baba Kala ilam powerful v...NO1 WorldWide Love marriage specialist baba ji Amil Baba Kala ilam powerful v...
NO1 WorldWide Love marriage specialist baba ji Amil Baba Kala ilam powerful v...
 
Bladex 1Q24 Earning Results Presentation
Bladex 1Q24 Earning Results PresentationBladex 1Q24 Earning Results Presentation
Bladex 1Q24 Earning Results Presentation
 
Classical Theory of Macroeconomics by Adam Smith
Classical Theory of Macroeconomics by Adam SmithClassical Theory of Macroeconomics by Adam Smith
Classical Theory of Macroeconomics by Adam Smith
 
Monthly Market Risk Update: April 2024 [SlideShare]
Monthly Market Risk Update: April 2024 [SlideShare]Monthly Market Risk Update: April 2024 [SlideShare]
Monthly Market Risk Update: April 2024 [SlideShare]
 

New year new market highs

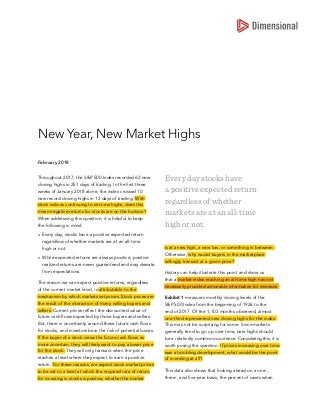
  • 1. Throughout 2017, the S&P 500 Index recorded 62 new closing highs in 251 days of trading. In the first three weeks of January 2018 alone, the index crossed 10 new record closing highs in 13 days of trading. With stock indices continuing to set new highs, does this mean negative returns for stocks are on the horizon? When addressing this question, it is helpful to keep the following in mind: nn Every day, stocks have a positive expected return regardless of whether markets are at an all-time high or not. nn While expected returns are always positive, positive realized returns are never guaranteed and may deviate from expectations. The reason we can expect positive returns, regardless of the current market level, is attributable to the mechanism by which markets set prices. Stock prices are the result of the interaction of many willing buyers and sellers. Current prices reflect the discounted value of future cash flows expected by those buyers and sellers. But, there is uncertainty around these future cash flows for stocks, and investors bear the risk of potential losses. If the buyer of a stock views the future cash flows as more uncertain, they will likely want to pay a lower price for the stock. They will only transact when the price reaches a level where they expect to earn a positive return. For these reasons, we expect stock market prices to be set to a level at which the required rate of return for investing in stocks is positive, whether the market is at a new high, a new low, or something in between. Otherwise, why would buyers in the marketplace willingly transact at a given price? History can help illustrate this point and show us that a market index reaching an all-time high has not necessarily provided actionable information for investors. Exhibit 1 measures monthly closing levels of the S&P 500 Index from the beginning of 1926 to the end of 2017. Of the 1,103 months observed, almost one‑third represented new closing highs for the index. This may not be surprising for some. Since markets generally tend to go up over time, new highs should be a relatively common occurrence. Considering this, it is worth posing the question: If prices increasing over time was a troubling development, what would be the point of investing at all? This data also shows that looking ahead on a one-, three-, and five-year basis, the percent of cases when New Year, New Market Highs February 2018 Every day stocks have a positive expected return regardless of whether markets are at an all‑time high or not.
  • 2. DIMENSIONAL FUND ADVISORS 2 Dimensional Fund Advisors LP is an investment advisor registered with the Securities and Exchange Commission. Indices are not available for direct investment.Their performance does not reflect the expenses associated with the management of an actual portfolio. Past performance is not a guarantee of future results. Diversification does not eliminate the risk of market loss. RM63136 02/18 1381973 the index was higher or lower after a new market high is about the same when compared to any other previous price level. In other words, positive and negative returns tended to make up a similar proportion of returns after the fact, regardless of whether a new high was reached or not. For example, for a three-year look-ahead period, the index was higher around 84% of the time both after hitting a new closing high as well as after any other previous level. Additionally, this data shows us that the average return experienced after those highs vs. any other level is also quite similar. For example, for the three-year look-ahead period, the average cumulative return after a new high was 51.1% vs. 51.8% for any other level. These results indicate that new index highs have historically not been useful predictors of future returns. Another reason investors should be cautious about reevaluating their approach at an all-time high is the potential opportunity cost of switching in and out of the market. Last year, the S&P 500 Index returned more than 20%, and yet 2017 started with three new market highs during the first 20 trading sessions.1 The opportunity cost paid by investors reacting to the new highs by selling stocks could have been substantial. There is no reliable way to predict when stock returns will be positive or negative, and while the long-term average return of the US stock market2 has been around 10% since 1926, year‑to-year results often deviate markedly from the historical average.3 Investors looking to capture what the equity markets offer over the long term are likely well served by sticking with their approach rather than making changes based on short-term noise. CONCLUSION The question of whether new market highs portend a fall in stocks can often be translated to another, more general question: “Is now a good time for me to be invested?” The evidence suggests that the current state of the market is not helpful in answering this question. Rather, an appropriate answer is highly dependent upon an investor’s unique situation and their risk and return objectives. For investors concluding stock market exposure is appropriate, a disciplined approach with a long-term view is likely a more prudent course of action than reacting to new market highs. Exhibit 1: S&P 500 Total Return Index Highs Percent of cases where index is higher after monthly closing high vs. any monthly closing level, January 1926–December 2017 Look-Ahead Period (N) Percent of Cases Where Index is Higher (after new high) Average Gain (after new high) Percent of Cases Where Index is Higher (after any previous level) Average Gain (after any previous level) 1 year 80.9% 19.6% 75.0% 21.1% 3 years 84.2% 51.1% 83.5% 51.8% 5 years 84.2% 89.2% 87.5% 85.0% For illustrative purposes only. Average gain is a simple average of all positive returns for the 1-, 3-, or 5-year periods analyzed. © 2018 S&P Dow Jones Indices LLC, a division of S&P Global. All rights reserved. 1. S&P 500 Index data © 2018 S&P Dow Jones Indices LLC, a division of S&P Global. All rights reserved. 2. As measured by the S&P 500 Index. 3. For more on this topic, please see “The Uncommon Average” from October 2017.