Prototype software example of aging model incorporating both portfolio and longevity percentile statistics along with consumer spending trend line

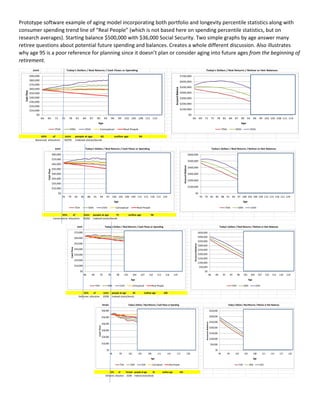
This first appeared in blog post that describes the graphs in more details https://blog.betterfinancialeducation.com/sustainable-retirement/what-are-the-three-paradigms-of-retirement-planning/ Prototype software example of aging model incorporating both portfolio and longevity percentile statistics along with consumer spending trend line of “Real People” (which is not based here on spending percentile statistics, but on research averages). Starting balance $500,000 with $36,000 Social Security. Two simple graphs by age answer many retiree questions about potential future spending and balances. Creates a whole different discussion. Also illustrates why age 95 is a poor reference for planning since it doesn’t plan or consider aging into future ages from the beginning of retirement.
Recommended

Recommended
More Related Content
Similar to Prototype software example of aging model incorporating both portfolio and longevity percentile statistics along with consumer spending trend line
Similar to Prototype software example of aging model incorporating both portfolio and longevity percentile statistics along with consumer spending trend line (20)
More from Better Financial Education
More from Better Financial Education (20)
Recently uploaded
Recently uploaded (20)
Prototype software example of aging model incorporating both portfolio and longevity percentile statistics along with consumer spending trend line
- 1. Prototype software example of aging model incorporating both portfolio and longevity percentile statistics along with consumer spending trend line of “Real People” (which is not based here on spending percentile statistics, but on research averages). Starting balance $500,000 with $36,000 Social Security. Two simple graphs by age answer many retiree questions about potential future spending and balances. Creates a whole different discussion. Also illustrates why age 95 is a poor reference for planning since it doesn’t plan or consider aging into future ages from the beginning of retirement. Joint Today's Dollars / Real Returns / Cash Flows or Spending Today's Dollars / Real Returns / Retiree or Heir Balances 45% of Joint people at age 65 outlive age 94 Balanced allocation 50/50 Indexed stocks/bonds $0 $10,000 $20,000 $30,000 $40,000 $50,000 $60,000 $70,000 $80,000 $90,000 66 69 72 75 78 81 84 87 90 93 96 99 102 105 108 111 114 Cash Flow Age 75th 50th 25th Conceptual Real People $0 $100,000 $200,000 $300,000 $400,000 $500,000 $600,000 $700,000 66 69 72 75 78 81 84 87 90 93 96 99 102 105 108 111 114 Account Balance Age 75th 50th 25th Joint Today's Dollars / Real Returns / Cash Flows or Spending Today's Dollars / Real Returns / Retiree or Heir Balances 35% of Joint people at age 75 outlive age 96 Conservative allocation 40/60 Indexed stocks/bonds $0 $10,000 $20,000 $30,000 $40,000 $50,000 $60,000 $70,000 $80,000 76 79 82 85 88 91 94 97 100 103 106 109 112 115 118 121 124 Cash Flow Age 75th 50th 25th Conceptual Real People $0 $100,000 $200,000 $300,000 $400,000 $500,000 $600,000 76 79 82 85 88 91 94 97 100 103 106 109 112 115 118 121 124 Account Balance Age 75th 50th 25th Joint Today's Dollars / Real Returns / Cash Flows or Spending Today's Dollars / Real Returns / Retiree or Heir Balances 25% of Joint people at age 85 outlive age 100 Defensive allocation 20/80 Indexed stocks/bonds $0 $10,000 $20,000 $30,000 $40,000 $50,000 $60,000 $70,000 86 89 92 95 98 101 104 107 110 113 116 119 Cash Flow Age 75th 50th 25th Conceptual Real People $0 $50,000 $100,000 $150,000 $200,000 $250,000 $300,000 $350,000 $400,000 $450,000 86 89 92 95 98 101 104 107 110 113 116 119 Account Balance Age 75th 50th 25th Female Today's Dollars / Real Returns / Cash Flows or Spending Today's Dollars / Real Returns / Retiree or Heir Balances 15% of Female people at age 95 outlive age 104 Defensive allocation 20/80 Indexed stocks/bonds $0 $10,000 $20,000 $30,000 $40,000 $50,000 $60,000 96 99 102 105 108 111 114 117 120 Cash Flow Age 75th 50th 25th Conceptual Real People $0 $50,000 $100,000 $150,000 $200,000 $250,000 $300,000 $350,000 96 99 102 105 108 111 114 117 120 Account Balance Age 75th 50th 25th