More Related Content
More from LeninJara3 (15)
Growth Chart.pptx
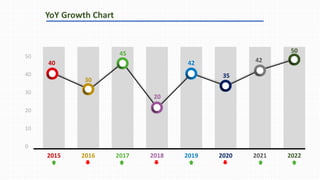
- 1. 2015 2016 2017 2018 2019 2020 2021 2022
50
40
30
20
10
0
40
30
45
20
42
35
42
50
YoY Growth Chart
- 3. LIKE | SHARE | SUBSCRIBE
Follow this link to join my TELEGRAM group: https://t.me/power_university
K I N D LY D O N AT E T H R O U G H
- 4. 2015 2016 2017 2018 2019 2020 2021 2022
42
28
45
40
25
50
35
52
YoY Growth Chart
- 5. 2015 2016 2017 2018 2019 2020 2021 2022
50
40
30
20
10
0
40
30
45
20
42
35
42
50
YoY Growth Chart
- 6. 2015 2016 2017 2018 2019 2020 2021 2022
50
40
30
20
10
0
42
28
45
40
25
50
35
52