SlideShare a Scribd company logo
1 of 109
Download to read offline
Language Error in Aviation Maintenance
Final Report
C. G. Drury, J. Ma and C. V. Marin
August 2005
Prepared for:
Federal Aviation Administration
William J. Hughes Technical Center
Atlantic City International Airport, NJ 08405
Contract #2002-G-025
Dr. William Krebs
TABLE OF CONTENTS
EXECUTIVE SUMMARY .................................................................................................1

Chapter 1. INTRODUCTION: PROBLEM, MODELS3

AND ARCHIVAL DATA....................................................................................................3

1.1	 Models of Communication......................................................................................4

1.1.1 Current Data Sources 1: ASRS AND AIDS...................................................................... 6 

1.1.2 Current Data Sources 2: OEM Survey of Airlines............................................................. 8 

1.3 	 Focus Groups on Language Errors.....................................................................18

1.4 Discussion....................................................................................................................20

Chapter 2. METHODOLOGY ........................................................................................22

2.1 	 Measures.......................................................................................................................22

2.2 	 Task Cards ...................................................................................................................24

2.3 	 Experimental Design for Comprehension Test for Non-English Speaking 

Countries.......................................................................................................................24

2.4 	 Choice of Participants and Sites..........................................................................26

2.4.1 Asia ........................................................................................................................... 26 

2.4.2 Latin America ........................................................................................................... 27 

2.4.3 Europe....................................................................................................................... 27 

2.4.4 USA........................................................................................................................... 27 

2.5 	 Preparation of the Data Collection Packets....................................................28

2.6 Data Collection Process..........................................................................................29

Chapter 3. PILOT TESTS OF METHODOLOGY.................................................30

3.1 	 Design............................................................................................................................30

3.2	 Choice of Participants and Sites..........................................................................31

3.3	 The Preparation of the Data Collection Packet in Chinese......................32

3.3	 The Results of Pilot Test 1: Native English-speaking ...............................32

Maintenance Personnel...........................................................................................32

3.5	 Results of Pilot Test 2: Native Chinese Engineering Students...............33

3.6	 Observations................................................................................................................34

3.7	 Conclusions .................................................................................................................35

4.1 	 Demographics.............................................................................................................36

4.2 	 Incidence Questionnaire.........................................................................................37

4.2.1 Error Factors ............................................................................................................. 38 

4.2.2 Prevention Factors .................................................................................................... 39

4.2.3 Discovery Factors ..................................................................................................... 40

4.3 	 Intervention Effectiveness.....................................................................................40

4.3.1 Rating scales ............................................................................................................. 44 

4.4 	 Focus Groups..............................................................................................................44

4.4.1 Current Practice ........................................................................................................ 46 

4.4.2 Intervention Methods................................................................................................ 47 

ii
Chapter 5. LATIN AMERICA RESULTS..................................................................50

5.1 Demographics.............................................................................................................50

5.2 Incidence Questionnaire........................................................................................51

5.2.1 Error Factors ............................................................................................................. 52 

5.2.3 Discovery Factors ..................................................................................................... 53

5.3 Intervention Effectiveness.....................................................................................54

5.4.2 Rating scales ............................................................................................................. 58 

5.4.1 Background information........................................................................................... 60 

5.4.2 Written communications to AMTs ........................................................................... 60 

5.4.3 Writing communications from AMTs ...................................................................... 61 

5.4.4 Verbal Communication:............................................................................................ 61 

5.4.5 Common Errors......................................................................................................... 61 

5.4.5 Intervention Methods................................................................................................ 61 

Chapter 6. EUROPE RESULTS......................................................................................64

6.1 Demographics.............................................................................................................64

6.2 Incidence Questionnaire.........................................................................................64

6.2.1 Error Factors ............................................................................................................. 65 

6.2.2 Prevention Factors .................................................................................................... 66

6.2.3 Discovery Factors ..................................................................................................... 67

6.3 Intervention Effectiveness.....................................................................................68

6.4.2 Rating scales ............................................................................................................. 71 

6.4 Focus Groups..............................................................................................................73

6.4.1 Current Practice ......................................................................................................... 73 

Chapter 7. USA RESULTS................................................................................................75

7.1 Demographics.............................................................................................................75

7.2 Incidence Questionnaire.........................................................................................75

7.2.1 Error Factors .............................................................................................................. 76 

7.2.2 Prevention Factors ..................................................................................................... 77 

7.2.3 Discovery Factors ...................................................................................................... 78 

7.3 Intervention Effectiveness ..........................................................................................78

7.3.1 Rating scales .............................................................................................................. 81 

7.4 Focus Groups..............................................................................................................82

Chapter 8. INTEGRATION AND DISCUSSION OF RESULTS ....................83

8.1 Comparisons across Regions................................................................................84

8.1.1 Reading Levels.......................................................................................................... 84 

8.1.2 Scenario Frequency and Factors Affecting............................................................... 85 

8.1.3 Intervention Effectiveness ........................................................................................ 87 

8.2 Effectiveness of Interventions..............................................................................90

8.2.1 Software.................................................................................................................... 90 

8.2.2 Hardware................................................................................................................... 92 

8.2.3 Environment.............................................................................................................. 92 

Chapter 9. FINDINGS AND RECOMMENDATIONS ........................................94

iii
List of Figures
Figure 1-1. Mean percentage contract maintenance for network and low cost airlines from 2002
to 2004, from raw data in OIG (2005)
Figure 1-2. The Communication Model synthesized from literature review (Wideman, 2002;
McAuley, 1979; Johnson, 1972, etc.)
Figure 1-3. Pattern of contributing factors across error loci
Figure 1-4. Pattern of Recovery Attempts across error loci
Figure 1-5. Significant differences between Regions of checklist usage
Figure 1-6. English speaking ability reported by Region
Figure 1-7. English reading ability reported by region
Figure 1-8. Regional difference of English usage
Figure 1-9. The airlines with low level of English reading ability used different strategies in
handling OEM English documents
Figure 1-10. The airlines with low level of English Speaking ability used different strategies in
handling daily oral conversation
Figure 4-1. Relative frequency with which each of the seven scenarios was encountered
Figure 4-2. Percentage reporting each factor affecting scenario incidence
Figure 4-3. Percentage reporting each factor affecting scenario prevention
Figure 4-4. Percentage reporting each factor affecting scenario discovery
Figure 4-5. Scatter plots of the two aspects of performance (Accuracy, Time) against the two
covariates (Reading Level, Age)
Figure 4-6. Differences between Chinese translation and the average of all non-translation
groups on the fifteen rating scales
Figure 5-1. Relative frequency with which each of the seven scenarios was encountered
Figure 5-2. Percentage reporting each factor affecting scenario incidence
Figure 5-3. Percentage reporting each factor affecting scenario prevention
iv
Figure 5-4. Percentage reporting each factor affecting scenario discovery
Figure 5-5. Scatter plots of the two aspects of performance (Accuracy, Time) against the two
covariates (Reading Level)
Figure 5-6. Significant interaction between Intervention and Task Card Difficulty (see text)
Figure 5-7. Speed and Accuracy across the three countries
Figure 5-8. Interaction of Task Card and Simplified English for Accuracy /Time
Figure 5-9. Averages of the fifteen rating scales
Figure 6-1. Relative frequency with which each of the seven scenarios was encountered
Figure 6-2. Percentage reporting each factor affecting scenario incidence
Figure 6-3. Percentage reporting each factor affecting scenario prevention
Figure 6-4. Percentage reporting each factor affecting scenario discovery
Figure 6-5. Effects of Intervention on Accuracy and Time
(Note: not significant separate effects, see text)
Figure 6-6. Scatter plots of the two aspects of performance (Accuracy, Time) against the two
covariates (Reading Level, Age)
Figure 6-7. Averages of the fifteen rating scales
Figure 6-8. Significant effects of task card on four rating scales
Figure 7-1. Relative frequency with which each of the seven scenarios was encountered
Figure 7-2. Percentage reporting each factor affecting scenario incidence
Figure 7-3. Percentage reporting each factor affecting scenario prevention
Figure 7-4. Percentage reporting each factor affecting scenario discovery
Figure 7-5. Scatter plots of the two aspects of performance (Accuracy, Time) against the two
covariates (Reading Level, Age)
Figure 7-6. Effects of task card on accuracy and time
v
Figure 7-7. Averages of the fifteen rating scales
Figure 8-1. Country/area comparison of accuracy and time for baseline condition
Figure 8-2. Country/area comparison of accuracy and time for translated conditions
Figure 8-3. Changes in accuracy and time from baseline to translated conditions
vi
List of Tables
Table 1-1. Regional airline sample numbers
Table 1-2. Difficulties in handbook use reported by region.
Table 1-3. Regional differences between English speaking levels
Table 1-4. Regional differences between English reading levels
Table 1-5. Regional differences for modifications of OEM documents
Table 1-6. Regional differences for language used in different situations
Table 1-7. Language errors arising in a task sequence framework
Table 1-8. Predisposing and mitigating factors identified in the focus groups
Table 2-1. Code Switching Types (Montes-Alcala, 2000)
Table 3-1. Participant numbers by experimental conditions for Pilot Tests 1 and 2
Table 3-2. Results of Pilot Study 1 for Simplified English
Table 3-3. Results of Pilot Study 2 for Simplified English
Table 3-4. Results of Pilot Study 2 for Interventions
Table 4-1. Background information on the MROs in Asia
Table 4-2. Demographics of the three areas, with mean values and test results
Note that * signifies a mean value different from the others at p<0.05 on the post hoc
Tukey test, or Standardized Residuals test for Chi-square.
Table 4-3. Median weeks since previous occurrence and mean percent reported for each scenario
Table 4-4. Summary of ANONA results for intervention performance
Table 4-5. Performance results for the four interventions
Shaded results not significant at p < 0.05
Table 4-6. 	Performance comparisons by Area. Shaded results not significant at p < 0.05. Note
that * signifies a mean value different from the others at p < 0.05 on the post hoc
Tukey test
vii
Table 4-7. Performance comparisons between the two task cards. Shaded results not significant
at p < 0.05
Table 5-1. Background information on the MROs in Latin America
Table 5-2. Demographics of the four countries, with mean values and test results. Note that *
signifies a mean value different from the others at p<0.05 on the post hoc Tukey test.
Table 5-3. Median Weeks Since Previous Occurrence and Mean Percent Reported for each
Scenario
Table 5-4. Summary of ANONA results for intervention performance
Table 6-1. Background information on the MRO in Europe
Table 6-2. Demographics of the single country tested in Europe
Table 6-3. Median weeks since previous occurrence and mean percent reported for each
scenario
Table 6-4. Summary of ANOVA results for intervention performance
Table 7-1. Background information on the MROs in USA
Table 7-2. Demographics of the USA sample
Table 7-3. Median weeks since previous occurrence and mean percent reported for each
scenario
Table 7- 4. Summary of ANOVA results for intervention performance
viii
List of Acronyms
AECMA………………………Aircraft European Contractors Manufacturers Association
AIAA………………………………...American Institute of Aeronautics and Astronautics
AMT……………………………………………………Aviation Maintenance Technician
ANCOVA…………………………………………………………Analyses of Covariance
ANOVA……………………………………………………………...Analysis of Variance
ASRS………………………………………….. NASA Aviation Safety Reporting System
CACC……………………………………………..Civil Aviation Administration of China
CAUC……………………………………………….....Civil Aviation University of China
FAA…………………………………………………….. Federal Aviation Administration
FAR…………………………………………………………..Federal Aviation Regulation
GRE………………………………………………………...Graduate Record Examination
GLM………………………………………………………………..General Linear Models
JAA………………………………………………….………….Joint Aviation Authorities
JAR…………………………………………………………………..Joint Aviation Repair
MRO……………………………………………….……Maintenance, Repair & Overhaul
NASA……………………………………National Aeronautics and Space Administration
NRR………………………………………………...………………….Non-routine Repair
NTSB……………………………………………….National Transportation Safety Board
OEM…………………………………………………….Original Equipment Manufacture
PA…………………………………………………………………………..Public Address
QA…………………………………………………...………………….Quality Assurance
SHELL…………………………..Software, Hardware, Environment, Liveware, Liveware
TOEFL…………………………………………….Test of English as a Foreign Language
EXECUTIVE SUMMARY
In the past decade there has been a great increase in contract maintenance among major airlines,
to a current level of about 50%. The fastest growing segment of the worldwide Maintenance
Repair and Overhaul (MRO) market is outside the USA. Although English is the language of
aviation, it is certainly not the native language of most of the world. Thus, language errors may
well arise for maintenance of the US civil fleet due to non-native English speakers interacting
with maintenance materials in English. This study assists the Federal Aviation Administration
(FAA) in answering a Secretary of Transportation recommendation that:
“The FAA should establish a method for determining whether language barriers
result in maintenance deficiencies.”
The contribution of this study has been to collect quantitative evidence to test whether language
errors pose a problem for maintenance and further to provide quantitative evidence for how any
potential problem can be managed. A total of 941 aviation maintenance workers on four
continents were tested to measure the incidence of language error, to examine the factors leading
to such error and its detection, and to measure the effectiveness of chosen interventions.
From analysis of an Original Equipment Manufacture (OEM) database on language use, we were
able to find the prevalence of English and native language usage from 113 airlines around the
world. English verbal abilities were highest in North America, followed by Europe and lowest in
Asia and the rest of the world. Translation of maintenance manuals was rare while translation of
task cards and engineering orders was more common in Asia. Most meetings and training were
conducted in the native language. Even among airlines with low reported levels of English
ability, translation of documents was uncommon.
Our own observations and focus groups in USA and UK helped develop a pattern of language
error scenarios, and a set of factors that may influence the frequency of these scenarios. The
frequency of occurrence of these scenarios, and factors affecting their incidence and mitigation,
was measured in the study of 941 maintenance personnel, largely Aviation Maintenance
Technicians (AMTs). A comprehension test methodology quantified the effectiveness of
language error interventions, for example by providing a bilingual coach, providing an English –
native language glossary or using a full or partial translation of a document.
From the OEM survey and demographic data on language use, the choice of sites was narrowed
to those using a form of Chinese or Spanish. With English, these two languages are the most
commonly used on earth. We chose as regions Asia, Latin America and Europe (Spain), with a
control sample from the USA. While we were measuring scenario frequency and intervention
effectiveness, we also collected data on English vocabulary of participants, which gives a direct
estimate of reading level on a scale equivalent to US grades in school. Finally, focus groups
were held at each site to discuss how that MRO coped with the potential for language error.
Three scenarios related to AMT abilities to understand written and verbal communication in
English were the most frequent, being seen by participants about 4 to 10 times per year. Most
1
language errors were detected early in the communications process. The reading grade level of
participants at USA MROs was about 14 as found in earlier studies. For MROs on other
continents, the reading grade level was about 5, with higher levels where there was a history of
bilingualism. On all continents, task card comprehension performance improved with reading
grade level. In that test, accuracy performance was generally good, and was better in areas that
were bilingual. None of the interventions except translation proved effective. Partial translation,
leaving technical terms in English, proved as effective as full translation. The use of good
practices in documentation design was seen as a contributing factor to language error mitigation.
A set of practical interventions emerged from the scenario frequency estimates, the
comprehension test and the focus groups. These are given in Chapter 9 as findings and
recommendations. Design of work documentation is the primary way to reduce written language
errors. Good design practice helps reduce errors and translation into the native language, if
performed carefully, was found to increase document comprehension. Individual ability of
Aviation Maintenance Technicians (AMTs), inspectors, managers and engineers in written and
verbal English communication was important, and can be improved by training and controlled
practice. The organizational environment should recognize the deleterious effects of time
pressure on errors, and also recognize the symptoms of imperfect communication when it occurs.
The organization also needs to plan work assignments to allow AMTs to become more familiar
with particular tasks, and provide planned English practice for all personnel. Time pressure on
tasks needs to be managed if language errors are to be reduced.
2
ContractMaintenance,%
Chapter 1. INTRODUCTION: PROBLEM, MODELS
AND ARCHIVAL DATA
As the Federal Aviation Administration’s (FAA) Office of the Inspector General reported in June
2005, the country’s air carrier industry is in an era of transition (OIG, 2005). Part of the cause of
the transition is record financial losses for FAR Part 121 carriers, and part of the solution is seen
as contract maintenance, popularly known as outsourcing. The volume of contract maintenance
has been increasing each year, with the percentages for both large Network carriers and Low
Cost operators now exceeding 50%. Indeed, an Analysis of Variance of the percentage data
(quoted on page 8 of OIG, 2005) for 2002-2004 showed a significant year effect (F(2,22) = 6.04,
p = 0,008), with the mean data shown in Figure 1-1. For comparison, the percentage outsourcing
in 1996 was 37% (OIG, 2003).
70
60
50
40
30
20
10
0
2002 2003 2004 (Q1-Q3)
Network
Low Cost
Figure 1-1. Mean percentage contract maintenance for network and low cost airlines from
2002 to 2004, from raw data in OIG (2005)
Contract maintenance is a preferred corporate strategy for reducing nonessential costs and
focusing an organization on its core business (Cant and Jeynes, 1998). In aviation maintenance,
Contract maintenance has been advocated and widely used, as it avoids tying up capital in
maintenance facilities, and can reduce costs by opening the airline’s maintenance operation to
outside competition. One potential impact of such Contract maintenance is that there are more
interfaces within the system, each of which represents an opportunity for error. The “system”
without Contract maintenance includes the aircraft itself, the airline and the regulatory agency
(e.g. the FAA). However, with Contract maintenance, a fourth organization is added to the
3
system: the Maintenance/ Repair Organization (MRO). Drury, Wenner and Kritkausky (2000)
provided models of these interactions and examined potential and actual error sources from using
MROs. Data collection at a number of domestic and foreign MROs did indeed show a potential
for increased errors, but little evidence of errors in practice.
Sparaco (2002) sees the formation of global MRO networks involving US and foreign airlines, as
well as repair stations. In addition to offshore MROs, there are many within the USA where
non-native English speakers form part of the labor pool. The difficulty of moving between
languages creates an additional potential for error. The language of aviation is primarily English,
both in operations and in maintenance. Aviation Maintenance Technicians (AMTs) must pass
their examinations in English, and maintenance documentation in use at the Federal Aviation
Administration (FAA) approved facilities is in English. This poses a second-language or
translation burden for Non-Native English Speakers (NNESs) that can potentially increase their
workload, their performance time or their error rate, or even all three measures.
In a 2001 report to the Secretary of Transportation by the Aircraft Repair and Maintenance
Advisory Committee, many of these issues were raised in considering changes to the domestic
and foreign FAR Part 145. They recommended that:
“The FAA should establish a method for determining whether language barriers
result in maintenance deficiencies.”
This project is a direct response to these concerns that NNES, in repair stations in the USA and
abroad, may be prone to an increased error rate that could potentially affect airworthiness.
1.1 Models of Communication
Communication is defined as “a dynamic and irreversible process by which we engage and
interpret messages within a given situation or context, and it reveals the dynamic nature of
relationships and organizations” (Rifkind, 1996). Communication can be formal or informal.
Davidmann (1998) made a distinction between formal and informal communication, where
formal communication implies that a record is kept of what has been said or written, so that it
can be attributed to its originator. On the whole, written communications are formal. Most on-
the-job communication is informal, unwritten, and sometimes even unspoken. An important
distinction made in communication theory is the temporal aspect: communication is either
synchronous or asynchronous. In aviation maintenance, synchronous communication is typically
verbal, e.g. conversations or PA announcements, while asynchronous communication is typically
written, e.g. work documentation or placards. In the context of aviation maintenance and
inspection, communication has been the most frequent aspect studied since the human factors
movement began there in the early 1990’s (Taylor and Patankar, 2000).
The fundamental function of communication is to deliver a message from one human being to
another. In almost every aspect of aviation work, communication also fulfills a secondary role as
an enabler (or tool) that makes it possible to accomplish a piece of work (Kanki and Smith,
2001). Based on examination of accident investigations and incident reports, Orasanu, Davision
4
and Fischer (1997) summarized how ineffective communication can compromise aviation safety
in three basic ways:
1. Wrong information may be used.
2. Situation awareness may be lost.
3. Participants may fail to build a shared model of the present situation at a team level.
Communication models in the form of generally simple diagrams are important in helping people
to understand the concept and process (Wideman, 2002). Kanki and Smith (2001) state that
human communication always takes place within a set of contexts, such as a social context, a
physical context and/or an operational context. Compared to some other work settings, the
aviation operational context is relatively structured by standard operating procedures that
organize task performance. Figure 1-2 presents a communication model we synthesized from our
literature review.
Medium
i
i
/
iisruption, etc.
Fil
Not on
Peceived
Not on
Encode Decode
Sender Receiver
Content
Mode
Chanel
Feedback
Interface
Culture,
Attitude, etc.
Culture,
Att tude, etc.Noise, Distortion, D
ter, Loss
Glossary S Glossary R
Message Message
Figure 1-2. The Communication Model synthesized from literature review (Wideman,
2002; McAuley, 1979; Johnson, 1972,etc.)
Based on basic communication theories, a communication process is composed of the
sender/receiver (e.g. people, manuals, computers, etc.), the message (e.g. information, emotions,
questions, etc.), the medium (e.g. speech, text, sensory, etc.), filters/barriers, feedback, etc.
(Kanki and Smith, 2001; Griffith, 1999).
Fegyveresi (1997) summarized many variables that influence communication, such as workload,
fatigue, personality traits, gender bias, standard phraseology, experience level, vocal cues, etc.
Language and cultural diversity can intensify differences and confusions in communication, but
a language barrier does not necessarily result in unsafe cockpit operations (Merritt and Ratwatte,
1997). In order to eliminate or at least minimize potential ambiguities and other variances,
people establish rules regarding which words, phrases, or other elements will be used for
communication, their meaning, and the way they will be connected with one another. The
aggregation of these rules is known as a “protocol.” There are four types of protocol related to
5
flight and aircraft safety (Rifkind, 1996): verbal, written, graphical, and gestural protocols.
According to Rifkind (1996), the only verbal protocol that has been established throughout
aviation, including maintenance, is the use of English as the standard language. This was done
when the International Civil Aviation Organization (ICAO) was established in 1944.
1.1.1 Current Data Sources 1: ASRS AND AIDS
Before field data is collected on language-related maintenance and inspection errors, existing
databases need to be searched for relevant reports of such errors. The most useful of these were
the NASA/FAA Aviation Safety Reporting System (ASRS) and the Accident/Incident Data
System (AIDS). Our main interest was in maintenance and inspection errors, but few were
reported in the databases studied. Hence, our objective changed to include all language-related
errors, whether by flight crew, ATC, cabin crew or ground crew. This decision was in line with
our literature search, which we broadened to include all communication errors. With a large
enough set of aviation-related language errors, we can form more general models, of which
maintenance and inspection errors will be a specific instance.
Based on a preliminary reading of about 60 incident reports, a taxonomy was developed of error
manifestations, causal factors and recovery mechanisms. Some entries in this taxonomy reflect
the earlier analysis by Orasanu, Davision and Fischer (1997), although we have tried to separate
contributing factors from recovery mechanisms. This preliminary reading also found likely key
words for searches. Two keyword searches were made of the ASRS and AIDS databases. The
first was on “English” and the second on “Language.” We classified 684 incidents by error
type, contributing factor, and recovery mechanism. Details are not presented here due to space
limitations.
The main division of error types was between synchronous and asynchronous communication.
Within these, a relatively fine classification was made by the roles of the two communicators,
e.g. flight crew with ground crew. This classification was eventually collapsed into four
categories. Note that “language” was used to refer to two items. Language could mean the
actual language used (e.g. French, Spanish, Chinese, English) or the choice of words/phrases
(e.g. listener expected one term but communicator used what was incorrectly thought to be a
synonym). Some of the communication channels themselves were poor, classified here as low
signal/noise ratio. In many cases, the report mentioned that at least one of the communicators
was inexperienced, for example an American crew’s first flight for some years into a Mexican
airport.
The analysis of the ASRS and AIDS databases used a cross-tabulation technique developed by
Wenner and Drury (2000) to show significant and often interesting conclusions in Figure 1-3 and
Figure 1-4. When the error locus was classified by the roles of the communicators, differences
in contributing factors and recovery mechanisms were seen. Our four categories of causal
factors gave roughly equal counts in the databases, showing that the use of other than a native
language was an important causal factor in these errors. This contributing factor appeared to be
distributed across error loci, except for asynchronous communication, where it was under­
represented. In fact, for asynchronous communication as a whole, native language and low
6
signal/noise ratio were under-represented factors, while unclear terminology was over­
represented. For recovery, asynchronous communication had the least opportunity for recovery
mechanisms. In particular, the repetition useful in synchronous communications was not usually
fruitful.
0
10
20
30
40
50
60
Contributing
Inexperience
Percentage
Native Language
Unclear Terminology
Low S/N Ratio
us
ic
ckpit
ups
ff
no
Tra
ro
A
synchro
C
o
G
a-
her
r
Int
O
t
0
20
40
60
80
Recovery
(
Figure 1-3. Pattern of contributing factors across error loci
100
PercentageUsing
Readback
Repeat
Clarify ns)
No Recovery
ps
kpit
ous
ic
ff
u
ro
on
ra
oc
rG
C
T
chr
a-
tr
he
n
A
sy
O
t
In
Figure 1-4. Pattern of recovery attempts across error loci
7
The characteristics of maintenance communications errors found here (asynchronous,
terminology-related, few recovery mechanisms) helped to set the stage for our direct
measurement of these errors from maintenance participant interviews and questionnaires.
1.1.2 Current Data Sources 2: OEM Survey of Airlines
From September 2002 to January 2003, an international corporation surveyed a large number of
airlines throughout the world concerning their use of English and other languages in flight
operations and maintenance operations. The database used was based on a large sample (n =
113) of airlines, approximately evenly divided between North America, Europe, Asia and the rest
of the world. As we wished to perform statistical analyses testing for differences between
regions, we needed to have enough responses in each Region, based on different challenges in
language they are a priori likely to face. Table 1-1 shows the numbers in each region.
Region Number Responding
Europe 35
North America 16
Asia 30
Other 32
Table 1-1. Regional airline sample numbers
The questions analyzed in this paper were all completed by Maintenance personnel. The first
analysis was for the question on “Has your company identified any of the following issues with
using the checklists in the manufacturer’s handbook? Check all that apply.” This question was
the only one that addressed the potential errors in checklist use, so that even though it
specifically referenced Flight Operations, it was deemed relevant to any study of patterns of error
in communication tasks. Each response type (e.g. Difficulty finding a checklist) was tested with
a Chi-square test of equality of proportions across the four Regions. Table 1-2 summarizes the
result.
Note first that there was a considerable difference between the sixteen error patterns, with some
having over twice the frequency of others. The higher frequency issues are to do with physically
locating the correct checklist and performing it despite interruptions. In contrast, the lower
frequency items have to do with the design, formatting and wording of the checklist itself.
Clearly, the airlines in this sample reported operational rather than design difficulties with
checklists.
8
Handbook Issue
Overall
% Yes
Chi-
Square Significance
Difficulty finding a checklist 38 10.7 0.014
Difficulty reading a checklist 28 13.7 0.003
Difficulty understanding the checklist 33 4.9 Ns
Don't understand why a checklist or checklist step is needed 30 4.7 Ns
Difficulty conducting a checklist 17 2.7 Ns
Difficulty following a condition statement 32 6.1 Ns
Get lost when navigating within a checklist 46 8.2 0.042
Forget to complete a checklist item after an interruption 35 1.6 Ns
Skip a step 38 4.7 Ns
Forget to complete a checklist 23 3.0 Ns
Complete the wrong checklist 45 1.0 Ns
Difficulty confirming the checklist is the right checklist 38 3.3 Ns
Performing the checklist properly relies too much on pilot's
system knowledge
19 3.4 Ns
The actions each pilot should perform or not perform are unclear 26 1.4 Ns
Not enough information to support crew in conduct of checklist 18 2.2 Ns
Information in checklist is difficult to read or interpret 21 11.8 0.008
Table 1-2. Difficulties in handbook use reported by region
For the four issues where there was a significant difference between regions, Figure 1-5 shows
these differences. For the first three issues (finding, reading, and navigating) Europe and North
America reported the most instances, with Asia and Other progressively less. There should be
no regional differences in at least finding a checklist, so that differential willingness to report
may be an issue here. Similarly, the final graph of Figure 1-5 on difficulty of reading and
interpreting information on the checklist, has North America showing almost twice as many
responses as any other region. Again, one would expect less difficulty understanding checklist
information in a predominantly English-speaking population, so perhaps the North American
users are less tolerant of sub-optimal conditions than those regions where an implicit translation
from English to a native language is often required. This may also explain to some extent that
checklist design problems are less likely to be reported than operational problems.
9
Figure 1-5. Significant Differences between Regions of Checklist Usage
Difficulty Finding a Checklist Difficulty Reading a Checklist
100 100
80 80
PercentageYes
PercentageYes
60 60
40 40
20 20
0
EU NA AS Other

Region

0
EU NA AS Other
Region
Get Lost When Navigating within a Checklist Information in Checklist is Difficult to Read or Interpret
100 100
8080
PercentageYes
PercentageYes
60
 60
40 40
2020
0
EU NA AS Other EU NA AS Other
0
Region Region
10
Our next analysis was of the reported English language ability of mechanics. One question
asked “Estimate the percentage of your mechanics who are described by each of the following
levels of English speaking ability”. Four levels of ability were presented:
- Can speak or understand very little English
- Can speak or understand a few English words or phrases
- Can speak and understand English for simple conversations
- Can speak and understand English in long, complex conversations
Similarly, the next question asked “Estimate the percentage of your mechanics who are
described by each of the following levels of English reading ability”. Three levels of ability
were presented:
- Can read very little English
- Can read English for maintenance documents
- Can read any English document
The data from each level was analyzed separately using one-way ANOVAs between the four
Regions. For Speaking ability all levels showed significant differences between regions as given
in Table 1-3.
English Speaking Level F(3,84) p
Can speak or understand very little English 4.53 0.005
Can speak or understand a few English words or phrases 10.12 <0.001
Can speak and understand English for simple conversations 7.06 <0.001
Can speak and understand English in long, complex conversations 16.73 <0.001
Table 1-3. Regional differences between English speaking levels
Figure 1-6 shows graphically how the speaking ability varied between Regions. Note the contrast
between Europe and North America, where most of the mechanics speak English, and Asia and
Other, where there is less reported speaking ability.
Exactly similar analyses were performed for English reading ability where again all levels
showed significant differences between regions shown in Table 1-4.
English Reading Level F(2, 82) p
Can read very little English 7.08 <0.001
Can read English for maintenance documents 7.42 <0.001
Can read any English document 10.81 <0.001
Table 1-4. Regional differences between English reading levels
11
100%
PercentageSpeaking
90%
80%
70%
60%
50%
40%
30%
20%
10%
0%
Complex
Conv.
Simple
Conv.
Few Words
V Little
EU NA AS Other
Region
Figure 1-6. English speaking ability reported by Region
These differences are shown in Figure 1-7 with common scales to provide comparisons. Note
again that there is a difference in English abilities between the two groups (Europe, North
America and Asia, Other).
0%
10%
20%
30%
40%
50%
60%
70%
80%
90%
100%
PercentageReading
V Little
Any Doc
Mtc Doc
EU NA AS Other
Region
Figure 1-7. English reading ability reported by Region
The next analysis was for the techniques used in each airline to deal with consequences of any
differences between the English language of documents and the native language of mechanics.
12
Three questions asked about translation of four types of document: Maintenance Manual,
Maintenance Task Cards, and Structural Repair Manual respectively. First, data from these
questions were analyzed using a Chi-square test with three responses:
- OEM document; in English and not modified
- OEM document; modified or rewritten in English by your company
- Translated to a different language
Where there were too few responses other than the first, the Chi-square was invalid and so data
were recoded to give just two levels:
- OEM document; in English and not modified
- Any modification
For the Maintenance Manual, only two of the 88 airlines reported other than “OEM document; in
English and not modified”, with one reporting each modification. Clearly, the Maintenance
Manual is typically left as supplied. For the other two documents, there was a significant
difference between regions (Table 1-5) when the data were combined to two levels as above:
Document
Overall
% Modified Chi-Square Significance
Maintenance Task Cards 13.6 26.1 < 0.001
Structural Repair Manual 4.6 12.6 Too few data
Table 1-5. Regional differences for modifications of OEM documents
In both cases the main difference was that only Asia and Other made modifications for the
Maintenance Task Cards; nine airlines modified them in English while three (two in Asia, one in
Other) translated them into the native language. Note that for Asia, 33% of the task cards were
modified. For the Structural Repair Manual, Asia was the only Region to modify the document,
with two performing each modification for a total of 13% modifying the OEM originals in some
way.
The next questions all dealt with languages used in common situations. Again, the languages
specified were English and a language other than English, but a mixture was also allowed if
respondents checked both alternatives. The following results (Table 1-6) were obtained from
Chi-square tests, with either three categories or recoded into two categories as for Question 1.
13
Engineering Order (2) 21.6 34.5 < 0.001
On-site maintenance training (3) 43.2 36.2 < 0.001
Meetings (3) 52.3 30.3 < 0.001
Casual talking (2) 59.1 30.1 < 0.001
Table 1-6. Regional differences for language used in different situations
Note that there were many uses of languages other than English, particularly for verbal
communication. This is in contrast to the previous question where there were few translations of
documents. It is more in line with Figures 6 and 7 in terms of English language abilities. The
regionRegion differences are shown in Figure 1-8, where the four graphs are again combined to
show similarities. As expected, North American airlines show the least use of languages other
than English, with only a single airline showing a mix of English and other languages. Europe
also does not use languages other than English even half the time, presumably because of the
widespread use of English in the European Union countries, as well as one whole country
speaking English as the primary language. However, Asia and Other regions make considerable
use of languages other than English in meetings and casual talking between mechanics, with over
79% using this strategy. Asia does translate Engineering Orders most of the time, but Other
regions make less than 20% use of this strategy.
We conducted a final analysis to further investigate the relationship between an airlines’ actual
English ability (reading and speaking) and its strategies of handling OEM English documents
and oral conversation in daily maintenance practice. For actual Reading English ability, we
recalculated responses to give a level of English reading and speaking ability from 0 = Very Low
to 4 = High.
We expected those airlines with low level of Reading English ability would adopt some
mitigating strategies in using the OEM documents (i.e. modification into AECMA simplified
English, translation into their native language). However, when using the Maintenance Manual, 7
out of 8 kept the original OEM document in English without any modification or translation,
while only one airline modified/rewrote it in English. When using the Structural Maintenance
Manual, 6 out of 8 airlines did not make any modification or translation. Figure 1-9 demonstrates
the details how these airlines deal with manufacturer’s English documents.
14
Engineering Order Onsite Maintenance Training
100 100
PercentageNon-English
80

60

40

20

PercentageNon-English
80
60
40
20
0 0
EU NA AS Other EU NA AS Other
Region Region
Meetings Casual Talk
0
20
40
60
80
100
PercentageNon-English
0
20
40
60
80
PercentageNon-English
100
EU NA AS Other EU NA AS Other
Region Region
Figure 1-8. Regional difference of English usage
15
8
7
6
5
4
3
2
1
0
i ion
No
i ion
NumberUsingEachStrategy
Translated
Modif cat
in English
Modif cat
Maintenance Structural Task Cards Engineering
Manual Repair Manual Order
OEM English Documents
Figure 1-9. The airlines with low level of English reading ability used different strategies in
handling OEM English documents
In a similar way, we analyzed the relationship between an airlines’ actual ability at Speaking
English and its strategies of handling oral conversation in daily maintenance practice. For actual
Speaking English ability, we calculated from the answers to Q14.2.4-Q14.2.7 as following:
For those airlines with low level of Speaking English ability (categories 1-3), when conducting
Onsite Maintenance Training, 100% conducted the training in a language other than English (i.e.
the native language). In Meetings, 10 out of 12 airlines used another language, with the
remaining two used both English and another language. Again, during Causal Talking, none of
the airlines used English. Figure 1-10 demonstrates the details how they use different strategies
in dealing with daily oral conversation.
Analysis of the use of English in written and spoken communications showed that English is
spoken and read at a high level in North America, and to a large extent (75% or so) in Europe.
In contrast, Asia and the other countries have about 50% of users able to work with written
English effectively, and about 30-40% able to work with spoken English in the same way. The
data from each level of English Speaking/Reading ability were analyzed separately using one-
way ANOVAs among the four regions. All levels showed significant differences between
regions.
16
12
10
8
6
4
2
0
PercentageYes
Mix
Other Language
English
Onsite Training Meeting Casual Talk
OEM English Documents
Figure 1-10. The airlines with low level of English Speaking ability used different strategies
in handling daily oral conversation
The airlines cope with any potential problems through a number of means, including document
translation, and conducting training and meetings in native languages. In Europe and North
America, such strategies were infrequently used, presumably because most mechanics speak
English, even if that is not their native language. In contrast, Asia and the rest of the world make
significant use of these strategies. Translation of documents was not a common strategy, except
for Asia, where 17% of airlines translated Task Cards and 60% translated Engineering Orders.
Comparable figures were about 4% and 20% of airlines in other parts of the world, and almost
nobody translated the Maintenance Manual. The strategy of using the native language in
speaking was widely seen, with almost all Asian airlines and most airlines in other non English-
speaking countries conducting meetings and maintenance training in languages other than
English. However, this may represent a mismatch to documentation used in the same task that
typically remained in English.
We expected that those airlines with low levels of English-reading ability would adopt some
mitigating strategies in using the original documents (i.e. modification into AECMA Simplified
English, translation into their native language). However, the overwhelming majority used
English documents. For those airlines with a low level of English-speaking ability, almost all
conducted Onsite Maintenance Training and Meetings in a language other than English (i.e. the
native language). Again, during Casual Talking, none of the airlines used English.
17
1.3 Focus Groups on Language Errors
While the analysis of archival data in the above section could provide some insight into language
errors in maintenance, such data were not collected for that purpose (c.f. Drury 1995). More
direct data collection involves the use of questionnaires and interviews specifically on the theme
of language errors in maintenance. However, before we can ask sensible questions, we must
have valid information on the types of errors involved. We collected such data from focus
groups at MROs in different countries. So far (May 2003), we have run five such focus groups,
three at US-based MROs and the other two at UK-based MROs.
A focus group gathers people together to discuss the issue at hand via moderator questions and
group discussions. Data are gathered through observations and conversations with participants.
Focus groups are particularly appropriate for use in exploratory studies when little is known
about a population or phenomenon. According to Albrecht et al. (1993), data collected in focus
groups may be more ecologically valid than methods that assess individuals’ opinions in a
relatively asocial setting, given that language errors are social events involving the interaction of
participants and the interplay and modification of ideas.
We used focus groups of people at MROs drawn from AMTs, supervisors, engineers and QA
specialists. Each interview lasted about 45 minutes. Our introductory statement (after
introductions, ground rules and assurance of anonymity) was:
“We are helping the FAA to reduce errors in aviation maintenance and inspection.
Our aim is to find improved ways of performing maintenance and inspection jobs.
One issue has been that although English is the primary language of aviation, many
people do not have English as their native language.”
Then, the focus groups discussed approximately ten questions with the principal investigator as
moderator. When we had transcribed the data, we compared the transcripts with our notes to look
for patterns of maintenance language errors or events under four headings.
1. Error types/patterns
2. Potential error detection points in the maintenance process.
3. Factors predisposing to language errors
4. Factors potentially mitigating language errors
18
Function Language Error Detection
Setup • AMT may appear perplexed, or may agree with everything said.
Task
Performance
• AMT may ask for assistance or clarification.
• AMT may close access prematurely (i.e. before buyback)
Buyback • Physical error may be detected.
• AMT may not understand inspector’s questions.
Table 1-7. Language errors arising in a task sequence framework
From these lists, we were able to see the functions of aircraft maintenance and inspection (see
Drury, Shepherd and Johnson 1997) and where language errors could arise. Table 1-7 represents
our current characterization of these situations where their errors could arise, presented within a
task sequence framework. We found the following patterns of error in both verbal (synchronous)
and written (asynchronous) communication:
Verbal (Synchronous)
1.	 AMT unable to communicate verbally to the level required.
2.	 AMT and colleagues/supervisors have poorly matched models of their own and each
other’s English ability.
3.	 Native English speakers with different regional or non-US English accents (e.g. UK,
India, Caribbean) prevent adequate communications.
4.	 AMTs unable to understand safety announcements over the PA system.
Written (Asynchronous)
5.	 AMT unable to understand safety placard in English.
6.	 AMT unable to understand written English documentation.
7.	 Foreign documentation poorly translated into English.
These patterns form the basis for a set of seven Scenarios that were tested in the field data
collection methodology defined in Chapter 2.
Table 1-8 shows the predisposing and mitigating factors identified in the focus groups. They are
classified in terms of the SHELL model of human factors in aviation (Easterby, 1967).
19
SHELL Category Predisposing Factors Mitigating Factors
Software (procedures) • Task complexity • Document translation
• Instruction complexity • Consistent terminology
• Good document design
Hardware (equipment) • Limitations of • Use of aircraft as a
communication channel, communication device:
e.g. radio, PA “show me”
Environment • Time pressure prevents
AMT from querying others
Liveware (individual) • Inadequate written English
ability
• Job familiarity
• Comprehension tests for
• Inadequate verbal English AMTs
ability
• Reversion to native
• Certify AMT for specific
jobs
language under stress
Liveware
(intercommunication)
• Unwillingness of AMT to
expose their lack of English
• Time pressure
• Translator available
• Assign AMTs to job based
on English ability
• Team AMT with native
English speaker
Table 1-8. Predisposing and mitigating factors identified in the focus groups
1.4 Discussion
The first phase was to find the patterns of language errors, provided there is evidence that they
exist. Our analysis of communication models and the company database has shown the potential
for language errors by showing that responses to language differences may not always keep pace
with the need for such interventions. The ASRS database analysis showed some actual language
errors, although these were mainly in the flight operations domain more likely to be reported to
ASRS. Patterns in this data showed that maintenance language errors were largely
asynchronous, were related to terminology and had few recovery mechanisms.
The five focus groups refined our conclusions. We now have ample evidence that language
errors exist, but also that recovery mechanisms and mitigating factors are possible. The patterns
found were numerous, and certainly not limited to asynchronous communication. Although
documentation was an important source of difficulty, there were other patterns in verbal
communication, including unexpected ones of regional accents of native English speakers. We
were also able to further document the time course and propagation of errors, including error
detection points and interventions. In an industry as heavily regulated as aviation maintenance,
there are a number of barriers to error propagation (c.f. Reason, 1990), including the initial work
assignment and inspection by a different person.
The characteristics of language errors found so far in maintenance suggests that a few overall
patterns may account for most of the potential errors. In the next chapter this project, we use the
patterns to design a study for collecting field data to estimate the prevalence of the patterns. It is
important to have data collection in several regions of the world, for example those used in our
20
analysis of the company database. A methodology of comprehension tests of workcards (e.g.
Chervak, Drury and Oullette, 1996; Drury, Wenner and Kritkausky, 1999) is available to test the
effectiveness of intervention strategies. These include use of Simplified English, full translation,
use of an English-speaking coach and provision of a local language glossary. In this way, we
provide a quantitative basis for recommendations to both MROs and regulatory bodies for the
effective reduction of language errors.
21
Chapter 2. METHODOLOGY
Three aspects of interest formed the basis for our data collection efforts, designed specifically to
answer FAA questions about the nature and frequency of language errors and possible
interventions to reduce these errors.
First, typical demographic measures were collected for each participant. In addition we collected
language-related data to characterize the population of AMTs and also to provide potential
covariates for our analyses of intervention effectiveness. These were Years Studying English,
and a measure of reading grade level from the Accuracy Levels Test. Second, a questionnaire
was given for each scenario asking whether the respondent had encountered that scenario, how
long ago, and what factors were associated with the scenario. Third, the set of interventions
noted above was tested using a task card comprehension measure to find their effectiveness.
Finally one or more focus groups were held at each site to better understand the way in which
potential language errors were handled in their organization.
2.1 Measures
Demographic data were collected as: Age, Gender, Job Category and Years as an Aviation
Maintenance Technician (AMT). The Accuracy Levels Test (Carver, 1987) is a timed 10-minute
test used a total of 100 words with a forced synonym choice among three alternatives, and
produced on the scale of reading grade level normed on US public schools. It has been validated
against more detailed measures of reading level (Chervak, Drury, Ouellette, 1996).
Frequency measures were collected for each of the following scenarios:
Scenario 1: “The Mechanic (Aircraft Maintenance Technician, AMT) or Inspector was
not able to communicate verbally to the level required for adequate performance.”
Scenario 2: “The Mechanic (AMT) or Inspector and the person to whom they were
speaking did not realize that the other had limited English ability.”
Scenario 3: “Native English speakers with different regional accents did not understand
each others’ communications.”
Scenario 4: “The Mechanic (AMT) or Inspector did not understand a safety
announcement over the Public Address (PA) system.”
Scenario 5: “The Mechanic (AMT) or Inspector did not fully understand a safety
placard.”
Scenario 6: “The Mechanic (AMT) or Inspector did not fully understand documentation
in English, for example a Work Card or a Manual.”
Scenario 7: “The Mechanic (AMT) or Inspector did not fully understand a document
translated from another language into their native language.”
For each of these seven scenarios the incidence questionnaire asked first whether each had ever
been encountered. This was the primary incidence measure, i.e. percentage incidence of each.
To gather more detail on frequency, respondents were asked whether the scenario occurred in the
22
past week, month, year or longer. We also asked how many months or years, but the data were
not always given in a quantitative manner, so an estimate of the median time since previous
occurrence was derived from the week/month/year data. Also, for each scenario, participants
were asked to check the factors associated with increased likelihood of the error occurring (9
factors), with mitigating each error (10 factors) and with the discovery of each error (6 factors).
The factors came from our previous analyses of databases of errors and focus groups used to
derive the scenarios (Drury and Ma, 2003).
The factors for each of Error Likelihood were:
Likelihood Factor
1 The task is complex
2 The task instructions are complex
3 The communication channel, e.g. radio or PA, interferes with good communication
4 Time pressure prevents the mechanic (AMT) or inspector from asking other people
for help
5 The mechanic (AMT) or inspector has inadequate written English ability
6 The mechanic (AMT) or inspector has inadequate verbal English ability
7 The mechanic (AMT) or inspector reverts to their native language under stress
8 The mechanic (AMT) or inspector is unwilling to expose their lack of English
9 Time pressure makes the mechanic (AMT) or inspector hurry
The factors for each of Error Prevention (Mitigation Factors) were:
Prevention Factor
1 The document is translated into the native language of the mechanic (AMT) or
inspector
2 The document uses terminology consistent with other documents
3 The document follows good design practice
4 The mechanic (AMT) or inspector uses the aircraft as a communication device, for
example to show the area to be inspected
5 The mechanic (AMT) or inspector is familiar with this particular job
6 The mechanic (AMT) or inspector has taken and passed a comprehension tests
7 The mechanic (AMT) or inspector was certified for that specific job
8 There is a translator available to help the mechanic (AMT) or inspector
9 Jobs are assigned to the mechanic (AMT) or inspector to job based on English
ability
10 The mechanic (AMT) or inspector is teamed with a native English speaker to
perform the job
The factors for each of Error Discovery were:
23
Discovery Factor
1 The mechanic (AMT) or inspector appeared perplexed.
2 The mechanic (AMT) or inspector agreed with everything that was said.
3 The mechanic (AMT) or inspector asked for assistance or clarification.
4 The mechanic (AMT) or inspector closed access prematurely (i.e. before buyback)
5 The physical error resulting from the language error was detected.
6 The mechanic (AMT) or inspector did not understand inspector’s questions at buy­
back.
To test for how potential documentation errors can be reduced, we measured the effectiveness of
document comprehension. In the study, one task card was given to each participant with a 10­
item questionnaire to test comprehension. The methodology had been validated in our previous
research (e.g., Chervak, et al., 1996; Drury, Wenner and Kritkausky, 1999). The comprehension
score was measured by the number of correct responses, with time taken to complete the
questionnaire as an additional measure. In addition, the task card was rated by the participant on
the fifteen scales originally developed by Patel et al (1994).
2.2 	 Task Cards
We selected two task cards, one “easy” and one “difficult,” from four task cards used in our
previous research (Drury, Wenner and Kritkausky, 1999), because it had already been found that
task difficulty affected the effectiveness of one strategy, Simplified English. As was expected,
the use of Simplified English had a larger effect on more complex task cards (Chervak and
Drury, 2003). The complexity of these task cards was evaluated by Boeing computational
linguists and University of Washington technical communications researchers considering word
count, words per sentence, percentage passive voice, and the Flesch-Kincaid reading score. The
cards differed on all measures. Note that both cards were comparatively well-written, certainly
compared to earlier task cards tested by Chervak et al (1996).
Both of the task cards were then prepared in the AECMA Simplified English versions, which
were also critiqued by experts from Boeing, the University of Washington, and the American
Institute of Aeronautics and Astronautics (AIAA) Simplified English Committee.
2.3 	 Experimental Design for Comprehension Test for Non-English
Speaking Countries
A fully nested (between subjects) 2 × 2 × 5 design was used with factors as follows:
Task card Complexity: 2 levels - Simple
- Complex
Task card Language: 2 levels - Simplified English
- Not Simplified English
24
Language Interaction: 5 levels - No intervention (English)
- English with glossary
- English with coach
- Full Native Language translation
(- Partial Native Language translation)
We have already observed the use of English coaching by a more senior person, e.g., lead,
foreman, engineer. Also, from the airline survey, we knew that some organizations translate
documents into the native language of the employees. Finally, we have seen glossaries of
English/native language words pertaining to aviation maintenance. All three are managerial
practices we wished to examine through experimentation.
The Partial Native Language translation intervention was only used in Latin America and Europe
as the need for this was only apparent after Asian data collection. Linguistic studies of
bilingualism and sociolinguistics have illustrated a phenomenon called “Code Mixing” or” Code
Switching”, i.e. the use of two languages in a conversation or in a written text (Luna and
Perachio, 2005; Montes-Alcala, 2000). People are motivated to switch from one language to
another to accommodate to different environments, external pressures or to align themselves
with groups that they wish to be identified (Gardner-Chloros, 1991). Table 2-1 shows eight the
different types of code switching that have been identified by Montes-Alcala (2000) and how
these are used by people in different contexts.
Code Switching Type Definition/Purpose/ Use
1. Quotes To quote the original words of a person in a specific language
or both.
2. Emphasis To highlight a word, a sentence or an idea. An author can get
more attention to a word by switching it to a different
language.
3. Clarification or
Elaboration
A word or a sentence is repeated in both languages to further
develop an idea.
4. Lexical Need A particular word that has a special meaning or connotation in
one language and it does not have it (or it does not exist) in the
other language, e.g. A culturally specific word or technical
words like “Internet”
5. Parenthetical
Comments
An author can enclose a comment in an imaginary parenthesis
by writing it in a different language.
6. Idioms/
Linguistic Routines
To express an idiomatic expression or linguistic cliché.
7. Stylistic Contributes to the rhythm of the stanzas and adds color and
life to the poems
8. Free Switching The code switching does not follow a specific pattern to make
the dialogues more lively and believable.
Table 2-1. Code Switching Types (Montes-Alcala, 2000)
25
In the context of language errors in aviation maintenance, the only one that relay concerns us is
#4: Lexical Need. Aviation English has many unique words, with new ones introduced
whenever new technical systems are implemented. AMTs learn the meaning of these new words
in context, on the job training and from the figures and graphs that illustrate the function of the
technical term. Many times these technical words do not have a simple translation on the native
language, so that it is easier to use the original term than to make an often cumbersome literal
translation. This direct use of foreign terms in aviation language was common in English in the
early days of aviation, where many terms were taken directly from the original French. Words
such as aileron, fuselage, empennage and longeron have become so accepted into English that
aviation users no longer see them as foreign imports.
When we found this phenomenon in the Asia data collection, we introduced a new intervention
called partial translation to test the impact on comprehension of using original English words
when the main sentences are kept in Spanish.
We originally intended to use an additional intervention using glossary plus coaching to form a 2
glossary × 2 coaching sub-design. However, in both our Chinese Engineering Graduate sample
and early tests at MRO sites, it became obvious that very few participants actually used these job
aids (see Section 3, Pilot Tests for more details). Thus, the glossary and coaching intervention
was dropped from the study. Additionally, the Chinese and Spanish translation of each task card
was only performed once, whether for Simplified English or not, so that no difference was
expected between task card language for that intervention.
2.4 Choice of Participants and Sites
As noted earlier, data from the manufacturer’s survey indicated that Asia, Europe and Other
Countries had quite different responses. Also, recent data (Seidenman and Spanovich, 2004)
suggests that Asia and Latin America are the most frequent countries for contract maintenance.
Thus our choice of regions was made as Asia and Latin America, with one country from Europe
and a control sample from USA.
2.4.1 Asia
The political status of the three “countries” selected, Mainland China, Hong Kong and Taiwan is
complex, so they will be referred to in this report as “Areas” to avoid the impression that they
are, or are not, parts of the same country. There are several reasons to collect data from MROs
located in Asia, especially mainland China, Taiwan Hong Kong. First, in our analysis of the
manufacturer’s survey data, we found that about 30% of users in Asia had a very limited English
speaking ability, another 40% were able to conduct simple conversations; about 40% of the users
were able to work effectively with only written maintenance/inspection related documents, and
another 15% had very little English reading ability. Compared with North America and Europe,
Asia has a much smaller base of English-using mechanics. Second, the Asia-Pacific region is
poised to be one of the strongest growth engines for the foreseeable future for the maintenance,
repair and overhaul industry (Overhaul & Maintenance, 2002). U.S. and European airlines
continue to ship wide-body aircraft to East Asia to take advantage of low labor costs. Almost
26
half of the top ten Asian MROs are located in China. According to Aviation Week & Space
Technology, “the Civil Aviation Administration of China (CAAC) is confident that despite the
downturn in the global airline industry, more maintenance, repair and overhaul (MRO) joint
venture companies will be set up with Chinese airlines within the next two years” (Dennis,
2002). Asia is expected to grow worldwide MRO market share from 18% in 2004 to 22% in
2014 (Seidenman and Spanovich, 2004) and is also likely to provide a wide range of managerial
practices for handling language differences. By choosing China, Hong Kong and Taiwan, we
were able to provide a reasonably consistent language use, and also to include an area (Hong
Kong) with a tradition of English/Chinese bilingualism.
2.4.2 Latin America
Central and South America are the recipients of an increasing share of worldwide maintenance
from North America (Philips, 2005). Their labor rates are generally lower than in North
America (Phillips, 2004). In the OEM survey, Latin America was classed as part of “Other”
regions for statistical convenience, but that whole class had similar levels of English ability to
Asia. Like Asia, a single language, Spanish in this case, is predominant, making translation and
administration of the data collection instruments simpler and more consistent. Within Latin
America, we chose Mexico as it has a large concentration of full-service MRO sites, Colombia
and Argentina as areas with much growth potential and Puerto Rico as an officially bilingual
area for comparison with traditionally Spanish-only countries.
2.4.3 Europe
The second largest share of worldwide MRO market is Europe, which is expected to grow
slightly from 25% in 2004 to 27% in 2014. In our OEM survey, Europe had the largest fraction
of good English readers of any region, with few modifications made to task cards. Europe was
expected to be the region with the best English performance, except for North America and
bilingual areas such as Hong Kong and Puerto Rico. Some European-based MRO organizations,
such as Lufthansa Technik, have sites in other regions as well as joint ventures with other
countries (Flottau, 2005). Airlines themselves are large MRO providers, with about 60% of the
current market in Europe (Phillips, 2005). Only two new comprehensive maintenance bases are
expected for the Airbus A380 large transport aircraft, with one in Asia and the other in Europe
(Wall, 2005). We chose Spain as we could compare the use of the same language, Spanish, to
our sample of Latin American countries.
2.4.4 USA
A control group from USA was chosen to provide a baseline comparison for the other regions.
We have worked with a number of airlines and MROs in the past, but this time chose an MRO
that we had never tested before. The MRO had a number of sites in the USA, of which we chose
two in the mid-West for convenience and for an expected low fraction of non-native English
speakers.
27
2.5 Preparation of the Data Collection Packets
Contacts in several Chinese-speaking countries were helpful in gaining access to MROs. The
translation process took place in two steps. A native Chinese research assistant (9 years as an
engineering major), who is very familiar with the task cards and bilingual in English, took a lead
in translating the packet. A large number of technical and language references were consulted.
The principal investigator and other domain experts (e.g., native Chinese mechanical engineers
in the Department of Aerospace and Mechanical Engineering at the University at Buffalo,
SUNY) were consulted on the technical details (e.g., lockwire). Then both translated and original
packets of data collection material were submitted to a retired professor (also fluent in English)
from the Department of Avionics, Civil Aviation University of China (CAUC) for review. The
translated material included the four task cards (for the full translation condition), the
comprehension questions, the task card ratings, the demographic information form, the informed
consent form and the questionnaire on frequency and causality of language errors.
We developed an English/Chinese glossary for each task card. We had two native English
speaking engineering graduate students and two native Chinese speaking engineering graduate
students read through all the task cards and circle all the words/phrases/sentences they did not
comprehend, or even those about which they were slightly unsure. We built up this glossary to be
as comprehensive as possible, including nouns, verbs, adjectives, abbreviations, etc.
For data collection where traditional Chinese was used (i.e., Taiwan), all forms were checked for
correct current usage of traditional Chinese characters by two bilingual Chinese/English
engineers with good knowledge of both human factors and aviation maintenance.
We also prepared for data collection in an Asian country with a different language, but the
MROs cancelled data collection prior to our visit.
For Latin American and European countries, we established a direct contact with the FAA’s
liaison of each selected MRO. The selection of MROs was based on their capabilities in
Airframe, Non-Destructive Test and Power plant. The translation process was done in two steps.
First, a native Spanish speaking research assistant (10 years as an engineering and industrial
safety majors) who is bilingual translated all the original English documents (informed consent,
demographic data, task cards, glossary, comprehensive questions, partial translation, task card
ratings and scenarios) to Spanish. Then, the complete package was reviewed by an expert team
of a human factors engineer and two Aviation Maintenance Technicians (from Spain and Latin
American countries) who currently work in a USA MRO. All suggested corrections to the
translation of technical words were made until the team was satisfied.
28
2.6 Data Collection Process
At each MRO site, an initial meeting with management was used to explain verbally the
objectives and conduct of the study, as a supplement to our earlier written communications. At
this meeting, we also discussed the type of work at the site, the range of customers served and
the importance of language issues and errors. Agreement was reached on the types of
participants of most use to us, e.g. AMTs, engineers, QA personnel, managers. The company
then scheduled multiple participants at approximately 75 minute intervals.
Groups of participants were nominally of six people, but groups with 2-10 were encountered.
Each group of participants was welcomed, and the general objective of the data collection, i.e. to
understand language errors and how to reduce them, was communicated. After obtaining
Informed Consent and completing demographic questions, the participants all started the timed
intervention evaluation (task card comprehension test) at the same time. The participants were
given one of the four task cards and its associated comprehension questions. They were timed,
but instructions emphasized accuracy. When this had been completed, each participant was given
the rating form. The participants who finished both of these rapidly were given the seven-
scenario frequency/causality questionnaire to allow slower participants to catch up. All were
then given the Accuracy Levels Test, starting the 10 minute timed test at the same time. If time
remained in the 75 minute session, the participants who had not completed the incidence
questionnaire were given that. If there would not be time, remaining participants were asked to
take that questionnaire back to their workplace and return the completed questionnaires later.
The participants were scheduled to be tested in groups with the same intervention, as far as
possible. However, at times too few participants arrived so that mixed groups were sometimes
tested. The participants were told that not all people in the experimental room were getting the
same Task Card, or the same intervention condition. On a couple of occasions, a participant did
not even attempt the task in one of the first three intervention conditions because they did not
read English. In these few cases, the response was noted and the participant was given the
equivalent full Chinese translation condition. We could later count this participant as scoring
zero on the comprehension test if required.
The participants were assigned to the Task Card complexity and Task Card language conditions
in rotation. As they were assigned to the experiment by their manager, no unwanted volunteer
bias from this procedure was expected. The participants were volunteers in the experiment, but
only after they had been assigned to attend by their managers.
A total of 13 focus groups, each of 6-15 engineers, quality personnel, AMTs and managers, were
conducted across the sites. Discussions were wide-ranging in English and Chinese, led by one or
more of the experimenters posing questions about language errors, communication problems,
their causal factors and how such errors are mitigated by the organization and its people.
29
Chapter 3. PILOT TESTS OF METHODOLOGY
In our continuing work, we will be visiting sites worldwide to measure the frequency of these
scenarios, but the current paper concentrates on the second aspect of the work, that of evaluating
countermeasures.
Our analysis of worldwide survey data from a major manufacturer reported earlier found that two
strategies used to reduce the potential for language errors were (a) translation into the native
language, and (b) conducting face-to-face meetings in the native language. However, only about
17% of airlines in the region that most often used translation (Asia) actually translated
maintenance documents into the native languages. Even among the group of 8 airlines who
reported the lowest English speaking ability, only two modified the English documents in any
way. Other strategies of intervention found in our site visits included having a bilingual
English/native language speaker assist the mechanic with the English documentation, and/or
providing a glossary of key words between the native language and English. Finally, our own
earlier research into the artificial maintenance language called AECMA Simplified English (e.g.,
Chervak, Drury and Ouellette, 1996) had shown this to be an effective error reduction technique,
particularly for non-native English speakers and for complex work documents.
Thus, we will compare four potential language error reduction interventions:
•	 The translation of a document into AECMA Simplified English
•	 The provision of a Glossary
•	 The provision of a bilingual coach
•	 The translation of a document and all related materials into a native language
Some of these methods may be combined, for example the provision of both a Glossary and a
bilingual coach, or the addition of AECMA Simplified English to all conditions except for
translations into the native language. Finally, for comparison, a baseline condition, no
intervention, will be required. This paper describes the first two experiments conducted within
this framework.
3.1 Design
As shown in Table 3-1, our study is a three-factor factorial design with the participants nested
under the three factors of:
1.	 Task Card Complexity (Easy vs. Difficult)
2.	 Document Language (Simplified English vs. Non-simplified English)
3.	 Interventions (None, Glossary, Full Translation, Bilingual Coach, Glossary Plus Bilingual
Coach)
30
Easy Task Card Difficult Task Card
Simplified Non-Simplified Simplified Non-Simplified
Intervention English English English English
#2 #2 #2 #2
#1 #1 #1 #1
1. Control 2
4
2
3
2
4
2
4
2. Glossary 2 2 2 2
3. Tutoring 2 2 2 2
4.Glossary &
Tutoring
2 2 2 2
5.Chinese
Translation
2 2 2 2
NOTE: #1 represents the number of participants in Pilot Test 1, and #2 represents the number of
participants in Pilot Test 2.
Table 3-1. Participant numbers by experimental conditions for Pilot Tests 1 and 2
3.2 Choice of Participants and Sites
The main task will take place at various foreign Maintenance/Repair organizations (MROs), but
the two studies reported here were performed in the USA as baseline and pilot tests.
There are several reasons to collect data from MROs located in Asia, especially China. First, in
our analysis of the manufacturer’s survey data, we found that about 30% of users in Asia had a
very limited English speaking ability, another 40% were able to conduct simple conversations;
about 40% of the users were able to work effectively with only written maintenance/inspection
related documents, and another 15% had very little English reading ability. Compared with
North America and Europe, Asia has a much smaller base of English-using mechanics. Second,
the Asia-Pacific region is poised to be one of strongest growth engines for the foreseeable future
for the maintenance, repair and overhaul industry (Overhaul & Maintenance, 2002). U.S. and
European airlines continue to ship wide-body aircraft to East Asia to take advantage of low labor
costs. Almost half of the top ten Asian MROs are located in China. According to Aviation Week
& Space Technology, “the Civil Aviation Administration of China (CAAC) is confident that
despite the downturn in the global airline industry, more maintenance, repair and overhaul
(MRO) joint venture companies will be set up with Chinese airlines within the next two years”
(Dennis, 2002).
Participants were tested singly or in small groups. After obtaining Informed Consent and
completing demographic questions, participants were given one of the four task cards and its
associated comprehension questions. They were timed, but instructions emphasized accuracy.
After the completion of the comprehension task, participants were given the Accuracy Level Test
for the required 10 minutes. This test used a total of 100 words with a forced synonym choice
among three alternatives, and produced on the scale of reading grade level. It has been validated
against more detailed measures of reading level (Chervak, Drury, Ouellette, 1996).
31
3.3 	 The Preparation of the Data Collection Packet in Chinese
The translation process took place in two steps. A native Chinese research assistant (9 years as
an engineering major), who is very familiar with the task cards, took a lead in translating the
packet. A large number of technical and language references were consulted. The principal
investigator and other domain experts (e.g., native Chinese mechanical engineers in the
Department of Aerospace and Mechanical Engineering at the University at Buffalo, SUNY) were
consulted on the technical details (e.g., lockwire). Then, both translated the task cards, and
original packets of data collection material were submitted to a retired professor from the
Department of Avionics, Civil Aviation University of China (CAUC) for a review.
We developed an English/Chinese glossary for each task card. We had two native English
speaking engineering graduate students and two native Chinese speaking engineering graduate
students read through all the task cards and circle all the words/phrases/sentences they did not
comprehend, or even those about which they were slightly unsure. We developed this glossary to
be as comprehensive as possible, including nouns, verbs, adjectives, abbreviations, etc.
With all of this material prepared, we performed two experiments before visiting the Chinese-
speaking sites.
3.3	 The Results of Pilot Test 1: Native English-speaking
Maintenance Personnel
This test used 15 participants from three sites in the UK and the USA as a representative sample
of English-speaking maintenance personnel who were unlikely to have any language errors.
They were tested on the same visits where focus group data was collected, as reported in Drury
and Ma (2003). All were tested under the four combinations of Simplified English/Not and
Easy/Difficult Task Card to give a 2 x 2 between subjects design. There were no other
interventions with these native English speakers.
First, there was a high negative correlation between accuracy and time for the comprehension
test (r = 0.692, p = 0.004), and moderate correlations of both with Reading Level at p = 0.06.
Thus, another variable was created through dividing Accuracy by Time to give a combined
overall Performance score. Reading Level was tested as a covariate, but was not significant in
any of three GLM ANOVAs of Accuracy, Time and Performance. In each of those ANOVAs,
the only significant effect was Task Card, which was significant at p = 0.044, 0.012 and 0.017,
respectively. As shown in Table 3-2, the difficult task card had worse performance on all
variables than did the easy task card.
32
Accuracy, Performance,
% Time, s %/s
Easy Task Card 74 754 0.104
Difficult Task Card 58 1073 0.058
Table 3-2. Results of Pilot Study 1 for Simplified English
3.5 Results of Pilot Test 2: Native Chinese Engineering Students
From December 2003 to February 2004, we conducted a pilot test of our methodology before
actually collecting data in foreign MROs in China. 40 native Chinese engineering students were
recruited from the graduate student pool at the University at Buffalo. We assumed that a Chinese
graduate student majoring in Engineering in the United States possessed more knowledge and
had a higher ability to use the English language in general than would be typical of maintenance
personnel in China. In order to decrease the gap between these two groups, we specified that
student participants should have arrived in the United States less than one year ago to be eligible
for this experiment. For this pilot test, we used 40 participants in a three-factor design (5
Interventions x 2 Simplified English/Not x 2 Task Cards).
For our pilot test group, there were three possible individual variables that might have affected
performance: reading level score, years of learning English, and years as an Engineering major.
These could have been useful covariates in the analysis of main factors by reducing the expected
variability between individual participants. An inter-correlation matrix of these revealed that
“Years of Learning English” was significantly correlated with the time to complete the task card
comprehension questionnaire (R = 0.498, p = 0.001), and “Reading Level Score” was related to
accuracy (R = 0.34, p = 0.032). We decided to consider two covariates: “Year of Learning
English” and “Reading Level Score.” Note that, as with Pilot Test 1, there was a negative
correlation between Accuracy and Time, but here it was not statistically significant (p = 0.091).
We used GLM 3-factor ANOVAs on each performance variable with and without the above
covariates, and found statistical significance for Time and Accuracy/Time in both cases. For
Time, there was significant effect of Intervention (F(4,20) = 7.77, p = 0.001), and for
Accuracy/Time there was significant effect of Task Card (F(1,20)=5.68, p=0.027). As shown in
Table 3-3, the easy task card had a worse performance on all variables than did the difficult task
card. The results were quite counter-intuitive, with the difficult task card having better
performance than the easy one. We suspect that this may have been caused by the potential
variability when two versions of each task card were translated into Mandarin. The effects of
Simplified English may also have been different for the Mandarin and original versions. In fact,
if the “Translation” intervention is eliminated, no terms in the ANOVA are significant.
33
Accuracy, Performance,
% Time, s %/s
Easy Task Card 66 1364 0.051
Difficult Task Card 72 1202 0.063
Table 3-3. Results of Pilot Study 2 for Simplified English
All the interventions resulted in decreased accuracy, but shorter time for completion. We did
expect that these Chinese graduate students would achieve higher accuracy when comprehending
a task card written in their native language. One possible explanation for this is that the aviation
maintenance domain is a very specialized domain, so task cards in both English and Chinese
were unfamiliar and difficult for the participants, and the advantages of the native language were
somehow minimized. If we considered Performance (i.e., Accuracy/Time), all four interventions
(except Glossary) resulted in better overall scores than the Control condition, and the Chinese
Translation was significantly better than the Control condition at 0.068 vs. 0.500 (T = -7.81, p =
0.004). As a check on the even distribution of participants across Interventions, a one-way
ANOVA of Reading Level between Interventions was conducted. As shown in Table 3-4, there
were significant differences in Reading Level (F(4,35) = 3.91, p< 0.01), showing that our
random assignment did not in fact produce equivalent groups.
English
Reading Accuracy, Time, Performance,
Level % s %/s
0 Control 10.3 75 1560 0.050
1. Glossary 11.9 73 1519 0.050
3. Tutoring 8.9 69 1264 0.056
4. Glossary & Tutoring 8.8 61 1027 0.057
2. Chinese Translation 10.6 66 1046 0.068
Table 3-4. Results of Pilot Study 2 for Interventions
Because “English Reading Level” was significantly different across Interventions, we
reconsidered it as a covariate, and ran GLM 3-factor ANOVAs on each performance variable.
For performance variables Time and Accuracy/Time, there was not much difference between
with and without the new covariate. For Accuracy, with the covariate, the interaction between
Intervention and Document English became marginally significant at (F (4, 19) = 2.83, p =
0.054).
3.6 Observations
According to our observations, most of the student participants did not utilize the interventions
of glossaries, tutoring, or the combination of the above two as much as we had expected. After
the experiment, the native Chinese experimenter asked them why they did not utilize the
resources. The participants agreed that: “although we do not understand some words, even a
34
sentence here and there, we are still able to answer the comprehension questionnaire; clarifying
the meaning of all the details may not necessarily improve our performance, but it will take
much longer to finish the task.” In fact, this makes sense, as all international students who apply
for graduate school in the United States need to submit their scores on the Test of English as
Foreign Language (TOEFL), and the Graduate Record Examination (GRE). For non-native
English speakers, in order to achieve better scores on the TOEFL and GRE-Verbal tests in a
limited time, one key factor is the ability to figure out unknown words, phrases, and even
sentences in context. This is a common consensus by non-native English speaking students who
have gone through this process. As a result of Pilot Test 2, we have eliminated the combined
Glossary and Tutoring condition from our subsequent Asian data collection.
3.7 Conclusions
The main comprehension task took less than half an hour to complete, while the other measures,
such as the Reading test and the rating scales, together took another 15 minutes or so. Because
many people could be tested together, we were efficient in data collection at the site, and cannot
develop accurate timetables for our on-site work in China.
This experiment used a baseline condition of English documents, and then added translation
(including the test form), a glossary, a bilingual coach, and a combination of these last two
conditions. We used two levels of task card difficulty, each with and without Simplified English.
This made a three-factor factorial experiment (Intervention x Difficulty x Simplified English),
with the Reading Level score as a covariate. On the samples tested so far, the US and the UK
participants obviously had the baseline intervention only, whereas the Chinese-speaking
engineering students had all of the interventions. At this stage, any significant effects should be
treated with caution, despite the interesting findings on Simplified English and Interventions.
These pilot studies are being used for testing the methodology, training the experimenters, and
providing an English-speaking baseline condition.
35
Chapter 4. ASIA RESULTS
A general description of the characteristics of each of the nine sites is presented in Table 4-1.
The data were collected from written sources, managers and focus group discussions. A primary
result of this data collection was that all of the sites in China used a mixture of English and
translated Chinese documentation, while in Hong Kong and Taiwan only English documentation
was used.
Area Site #
Number of
Employees
Style of Using Task Card
in Maintenance
Mainland China 1 > 3,500 English-Chinese
Mainland China 2 1,520 English-Chinese
Hong Kong 3 632 English
Hong Kong 4 2,500 English
Mainland China 5 1,993 English-Chinese
Mainland China 6 769 English-Chinese
Taiwan 7 ~ 300 English
Taiwan 8 1,300 English
Taiwan 9 <100 English
Table 4-1. Background information on the MROs in Asia
4.1 Demographics
For each participant we recorded their Gender, Age, Years as an AMT, Years Learning English
and Reading Level as given by the Accuracy Levels Test. As it was most unlikely that these
demographics would remain constant across the three areas (Mainland China, Hong Kong,
Taiwan), one-way ANOVAs were conducted of each demographic, except for the categorical
variable of Gender that was tested using Chi-Square. All comparisons gave significant
differences by Area, as shown in Table 4-2.
Mainland
China
Hong
Kong Taiwan
UK/
USA Test Result Significance
Number Tested 175 25 54 15
Percent Female 25%* 4% 4% 0 χ2
(2) = 15.84 p < 0.001
Age 33.5* 42.9 40.5 F(2,250) = 34.7 p < 0.001
Years as AMT 8.6* 18.4* 13.6* F(2,250) = 21.9 p < 0.001
Yr. Learning
English
20.1* 35.6* 27.1* - F(2,243) = 79.9 p < 0.001
Reading Level 4.9* 6.6 5.8 14.1 F(2,253 = 7.9 p < 0.001
Table 4-2. Demographics of the three areas, with mean values and test results. Note that *
signifies a mean value different from the others at p<0.05 on the post hoc Tukey
test, or Standardized Residuals test for Chi-square.
Note that Mainland China has more females represented, in a generally younger, less
experienced sample with lower English exposure and reading ability. For Years as AMT and
36
Maint language final

More Related Content

What's hot

Sap MM-configuration-step-by-step-guide
Sap MM-configuration-step-by-step-guideSap MM-configuration-step-by-step-guide
Sap MM-configuration-step-by-step-guideVenet Dheer
 
Sap mm-configuration-step-by-step-guide
Sap mm-configuration-step-by-step-guideSap mm-configuration-step-by-step-guide
Sap mm-configuration-step-by-step-guidevenkat1571
 
Handbook for vaccine and cold chain handlers 2015 (26.08.15)
Handbook for vaccine and cold chain  handlers 2015 (26.08.15)Handbook for vaccine and cold chain  handlers 2015 (26.08.15)
Handbook for vaccine and cold chain handlers 2015 (26.08.15)drdduttaM
 
rigid and flexiable pavement of highway Project bbjr report
rigid and flexiable pavement of highway Project bbjr reportrigid and flexiable pavement of highway Project bbjr report
rigid and flexiable pavement of highway Project bbjr reportrakeshchoudhary129
 
Vertex Configuration Guide. A to Z Steps with Description.
Vertex Configuration Guide. A to Z Steps with Description.Vertex Configuration Guide. A to Z Steps with Description.
Vertex Configuration Guide. A to Z Steps with Description.Keyur Mistry
 
Technical Communication 14th Edition Lannon Solutions Manual
Technical Communication 14th Edition Lannon Solutions ManualTechnical Communication 14th Edition Lannon Solutions Manual
Technical Communication 14th Edition Lannon Solutions ManualIgnaciaCash
 
PA Marcellus Shale Advisory Commission Final Report
PA Marcellus Shale Advisory Commission Final ReportPA Marcellus Shale Advisory Commission Final Report
PA Marcellus Shale Advisory Commission Final ReportMarcellus Drilling News
 
Honolulu Emergency Services Audit
Honolulu Emergency Services AuditHonolulu Emergency Services Audit
Honolulu Emergency Services AuditHonolulu Civil Beat
 
R3 tax interface configuration guide
R3 tax interface configuration guideR3 tax interface configuration guide
R3 tax interface configuration guideNaval Bhatt ,PMP
 
Sap mm configuration document ramesh kamishetty
Sap mm  configuration document ramesh kamishettySap mm  configuration document ramesh kamishetty
Sap mm configuration document ramesh kamishettyRamesh Kamishetty
 
TOC training KeyCloak Redhat SSO core
TOC training KeyCloak Redhat SSO coreTOC training KeyCloak Redhat SSO core
TOC training KeyCloak Redhat SSO corePascal Flamand
 
TOC training Keycloak RedhatSSO advanced
TOC training Keycloak RedhatSSO advancedTOC training Keycloak RedhatSSO advanced
TOC training Keycloak RedhatSSO advancedPascal Flamand
 
Software Engineering
Software EngineeringSoftware Engineering
Software EngineeringSoftware Guru
 
TOC training Keycloak RedhatSSO UMA
TOC training Keycloak RedhatSSO UMATOC training Keycloak RedhatSSO UMA
TOC training Keycloak RedhatSSO UMAPascal Flamand
 
gem-south-africa-2014-report-1431707163
gem-south-africa-2014-report-1431707163gem-south-africa-2014-report-1431707163
gem-south-africa-2014-report-1431707163Nigel Engelbrecht
 
Paul Ebbs (2011) - Can lean construction improve the irish construction industry
Paul Ebbs (2011) - Can lean construction improve the irish construction industryPaul Ebbs (2011) - Can lean construction improve the irish construction industry
Paul Ebbs (2011) - Can lean construction improve the irish construction industryPaul Ebbs
 

What's hot (20)

Sap MM-configuration-step-by-step-guide
Sap MM-configuration-step-by-step-guideSap MM-configuration-step-by-step-guide
Sap MM-configuration-step-by-step-guide
 
Sap mm-configuration-step-by-step-guide
Sap mm-configuration-step-by-step-guideSap mm-configuration-step-by-step-guide
Sap mm-configuration-step-by-step-guide
 
Handbook for vaccine and cold chain handlers 2015 (26.08.15)
Handbook for vaccine and cold chain  handlers 2015 (26.08.15)Handbook for vaccine and cold chain  handlers 2015 (26.08.15)
Handbook for vaccine and cold chain handlers 2015 (26.08.15)
 
rigid and flexiable pavement of highway Project bbjr report
rigid and flexiable pavement of highway Project bbjr reportrigid and flexiable pavement of highway Project bbjr report
rigid and flexiable pavement of highway Project bbjr report
 
Evaluating Your Program
Evaluating Your ProgramEvaluating Your Program
Evaluating Your Program
 
Vertex Configuration Guide. A to Z Steps with Description.
Vertex Configuration Guide. A to Z Steps with Description.Vertex Configuration Guide. A to Z Steps with Description.
Vertex Configuration Guide. A to Z Steps with Description.
 
Technical Communication 14th Edition Lannon Solutions Manual
Technical Communication 14th Edition Lannon Solutions ManualTechnical Communication 14th Edition Lannon Solutions Manual
Technical Communication 14th Edition Lannon Solutions Manual
 
Gheorghe M. T. Radulescu
Gheorghe M. T. RadulescuGheorghe M. T. Radulescu
Gheorghe M. T. Radulescu
 
PA Marcellus Shale Advisory Commission Final Report
PA Marcellus Shale Advisory Commission Final ReportPA Marcellus Shale Advisory Commission Final Report
PA Marcellus Shale Advisory Commission Final Report
 
Honolulu Emergency Services Audit
Honolulu Emergency Services AuditHonolulu Emergency Services Audit
Honolulu Emergency Services Audit
 
R3 tax interface configuration guide
R3 tax interface configuration guideR3 tax interface configuration guide
R3 tax interface configuration guide
 
Sap mm configuration document ramesh kamishetty
Sap mm  configuration document ramesh kamishettySap mm  configuration document ramesh kamishetty
Sap mm configuration document ramesh kamishetty
 
Gate2014 brochure
Gate2014 brochureGate2014 brochure
Gate2014 brochure
 
TOC training KeyCloak Redhat SSO core
TOC training KeyCloak Redhat SSO coreTOC training KeyCloak Redhat SSO core
TOC training KeyCloak Redhat SSO core
 
TOC training Keycloak RedhatSSO advanced
TOC training Keycloak RedhatSSO advancedTOC training Keycloak RedhatSSO advanced
TOC training Keycloak RedhatSSO advanced
 
Software Engineering
Software EngineeringSoftware Engineering
Software Engineering
 
TOC training Keycloak RedhatSSO UMA
TOC training Keycloak RedhatSSO UMATOC training Keycloak RedhatSSO UMA
TOC training Keycloak RedhatSSO UMA
 
gem-south-africa-2014-report-1431707163
gem-south-africa-2014-report-1431707163gem-south-africa-2014-report-1431707163
gem-south-africa-2014-report-1431707163
 
Paul Ebbs (2011) - Can lean construction improve the irish construction industry
Paul Ebbs (2011) - Can lean construction improve the irish construction industryPaul Ebbs (2011) - Can lean construction improve the irish construction industry
Paul Ebbs (2011) - Can lean construction improve the irish construction industry
 
MScThesis(S.A.van.der.Wulp)
MScThesis(S.A.van.der.Wulp)MScThesis(S.A.van.der.Wulp)
MScThesis(S.A.van.der.Wulp)
 

Similar to Maint language final

Helikoptersikkerhetsstudie 3 (Hss 3) Vedleggsrapport
Helikoptersikkerhetsstudie 3 (Hss 3) VedleggsrapportHelikoptersikkerhetsstudie 3 (Hss 3) Vedleggsrapport
Helikoptersikkerhetsstudie 3 (Hss 3) VedleggsrapportE.ON Exploration & Production
 
Protective Device Coordination
Protective Device CoordinationProtective Device Coordination
Protective Device Coordinationjoeengi
 
10201 Executive Summary And Manifesto Event Processing
10201 Executive Summary And Manifesto Event Processing10201 Executive Summary And Manifesto Event Processing
10201 Executive Summary And Manifesto Event ProcessingChristine Maffla
 
NYU Masters Thesis - 2009 (Thesis of the Year - Runner Up)
NYU Masters Thesis - 2009 (Thesis of the Year - Runner Up)NYU Masters Thesis - 2009 (Thesis of the Year - Runner Up)
NYU Masters Thesis - 2009 (Thesis of the Year - Runner Up)Jim Floyd
 
Capstone jordan new award metrics for sustainability_final
Capstone jordan new award metrics for sustainability_finalCapstone jordan new award metrics for sustainability_final
Capstone jordan new award metrics for sustainability_finalLuke Statz
 
Pressure Vessel Selection Sizing and Troubleshooting
Pressure Vessel Selection Sizing and Troubleshooting Pressure Vessel Selection Sizing and Troubleshooting
Pressure Vessel Selection Sizing and Troubleshooting Karl Kolmetz
 
BizTalk Practical Course Preview
BizTalk Practical Course PreviewBizTalk Practical Course Preview
BizTalk Practical Course PreviewMoustafaRefaat
 
Operations manual for_owners_and_managers_multi-unit_residential_buildings
Operations manual for_owners_and_managers_multi-unit_residential_buildingsOperations manual for_owners_and_managers_multi-unit_residential_buildings
Operations manual for_owners_and_managers_multi-unit_residential_buildingsSherry Schluessel
 
Yahoo Web Analytics API Reference Guide
Yahoo Web Analytics API Reference GuideYahoo Web Analytics API Reference Guide
Yahoo Web Analytics API Reference GuideAndrew Talcott
 
SSTRM - StrategicReviewGroup.ca - Workshop 2: Power/Energy and Sustainability...
SSTRM - StrategicReviewGroup.ca - Workshop 2: Power/Energy and Sustainability...SSTRM - StrategicReviewGroup.ca - Workshop 2: Power/Energy and Sustainability...
SSTRM - StrategicReviewGroup.ca - Workshop 2: Power/Energy and Sustainability...Phil Carr
 
Miele Gas Dryer T9820 Service Manual
Miele Gas Dryer T9820 Service ManualMiele Gas Dryer T9820 Service Manual
Miele Gas Dryer T9820 Service ManualAjit Verma
 
U.S. Communications Law and Transactions (Winter 2010) White Paper
U.S. Communications Law and Transactions (Winter 2010) White PaperU.S. Communications Law and Transactions (Winter 2010) White Paper
U.S. Communications Law and Transactions (Winter 2010) White Paperokurtin
 
Performance Measures Report Results Summary
Performance Measures Report Results SummaryPerformance Measures Report Results Summary
Performance Measures Report Results SummaryKelly Carlson
 
FCC Interop Board Final Report 05 22 12
FCC Interop Board Final Report 05 22 12FCC Interop Board Final Report 05 22 12
FCC Interop Board Final Report 05 22 12Claudio Lucente
 

Similar to Maint language final (20)

It project development fundamentals
It project development fundamentalsIt project development fundamentals
It project development fundamentals
 
Helikoptersikkerhetsstudie 3 (Hss 3) Vedleggsrapport
Helikoptersikkerhetsstudie 3 (Hss 3) VedleggsrapportHelikoptersikkerhetsstudie 3 (Hss 3) Vedleggsrapport
Helikoptersikkerhetsstudie 3 (Hss 3) Vedleggsrapport
 
Protective Device Coordination
Protective Device CoordinationProtective Device Coordination
Protective Device Coordination
 
Gemini Manual
Gemini ManualGemini Manual
Gemini Manual
 
Thesis writing
Thesis writingThesis writing
Thesis writing
 
10201 Executive Summary And Manifesto Event Processing
10201 Executive Summary And Manifesto Event Processing10201 Executive Summary And Manifesto Event Processing
10201 Executive Summary And Manifesto Event Processing
 
NYU Masters Thesis - 2009 (Thesis of the Year - Runner Up)
NYU Masters Thesis - 2009 (Thesis of the Year - Runner Up)NYU Masters Thesis - 2009 (Thesis of the Year - Runner Up)
NYU Masters Thesis - 2009 (Thesis of the Year - Runner Up)
 
Capstone jordan new award metrics for sustainability_final
Capstone jordan new award metrics for sustainability_finalCapstone jordan new award metrics for sustainability_final
Capstone jordan new award metrics for sustainability_final
 
Fr a200
Fr a200Fr a200
Fr a200
 
2002annualreport[1]
2002annualreport[1]2002annualreport[1]
2002annualreport[1]
 
Pressure Vessel Selection Sizing and Troubleshooting
Pressure Vessel Selection Sizing and Troubleshooting Pressure Vessel Selection Sizing and Troubleshooting
Pressure Vessel Selection Sizing and Troubleshooting
 
BizTalk Practical Course Preview
BizTalk Practical Course PreviewBizTalk Practical Course Preview
BizTalk Practical Course Preview
 
Operations manual for_owners_and_managers_multi-unit_residential_buildings
Operations manual for_owners_and_managers_multi-unit_residential_buildingsOperations manual for_owners_and_managers_multi-unit_residential_buildings
Operations manual for_owners_and_managers_multi-unit_residential_buildings
 
Yahoo Web Analytics API Reference Guide
Yahoo Web Analytics API Reference GuideYahoo Web Analytics API Reference Guide
Yahoo Web Analytics API Reference Guide
 
SSTRM - StrategicReviewGroup.ca - Workshop 2: Power/Energy and Sustainability...
SSTRM - StrategicReviewGroup.ca - Workshop 2: Power/Energy and Sustainability...SSTRM - StrategicReviewGroup.ca - Workshop 2: Power/Energy and Sustainability...
SSTRM - StrategicReviewGroup.ca - Workshop 2: Power/Energy and Sustainability...
 
Miele Gas Dryer T9820 Service Manual
Miele Gas Dryer T9820 Service ManualMiele Gas Dryer T9820 Service Manual
Miele Gas Dryer T9820 Service Manual
 
PHAST Version 2.pdf
PHAST Version 2.pdfPHAST Version 2.pdf
PHAST Version 2.pdf
 
U.S. Communications Law and Transactions (Winter 2010) White Paper
U.S. Communications Law and Transactions (Winter 2010) White PaperU.S. Communications Law and Transactions (Winter 2010) White Paper
U.S. Communications Law and Transactions (Winter 2010) White Paper
 
Performance Measures Report Results Summary
Performance Measures Report Results SummaryPerformance Measures Report Results Summary
Performance Measures Report Results Summary
 
FCC Interop Board Final Report 05 22 12
FCC Interop Board Final Report 05 22 12FCC Interop Board Final Report 05 22 12
FCC Interop Board Final Report 05 22 12
 

Recently uploaded

Introduction to Multiple Access Protocol.pptx
Introduction to Multiple Access Protocol.pptxIntroduction to Multiple Access Protocol.pptx
Introduction to Multiple Access Protocol.pptxupamatechverse
 
(RIA) Call Girls Bhosari ( 7001035870 ) HI-Fi Pune Escorts Service
(RIA) Call Girls Bhosari ( 7001035870 ) HI-Fi Pune Escorts Service(RIA) Call Girls Bhosari ( 7001035870 ) HI-Fi Pune Escorts Service
(RIA) Call Girls Bhosari ( 7001035870 ) HI-Fi Pune Escorts Serviceranjana rawat
 
(ANVI) Koregaon Park Call Girls Just Call 7001035870 [ Cash on Delivery ] Pun...
(ANVI) Koregaon Park Call Girls Just Call 7001035870 [ Cash on Delivery ] Pun...(ANVI) Koregaon Park Call Girls Just Call 7001035870 [ Cash on Delivery ] Pun...
(ANVI) Koregaon Park Call Girls Just Call 7001035870 [ Cash on Delivery ] Pun...ranjana rawat
 
(PRIYA) Rajgurunagar Call Girls Just Call 7001035870 [ Cash on Delivery ] Pun...
(PRIYA) Rajgurunagar Call Girls Just Call 7001035870 [ Cash on Delivery ] Pun...(PRIYA) Rajgurunagar Call Girls Just Call 7001035870 [ Cash on Delivery ] Pun...
(PRIYA) Rajgurunagar Call Girls Just Call 7001035870 [ Cash on Delivery ] Pun...ranjana rawat
 
Study on Air-Water & Water-Water Heat Exchange in a Finned Tube Exchanger
Study on Air-Water & Water-Water Heat Exchange in a Finned Tube ExchangerStudy on Air-Water & Water-Water Heat Exchange in a Finned Tube Exchanger
Study on Air-Water & Water-Water Heat Exchange in a Finned Tube ExchangerAnamika Sarkar
 
(MEERA) Dapodi Call Girls Just Call 7001035870 [ Cash on Delivery ] Pune Escorts
(MEERA) Dapodi Call Girls Just Call 7001035870 [ Cash on Delivery ] Pune Escorts(MEERA) Dapodi Call Girls Just Call 7001035870 [ Cash on Delivery ] Pune Escorts
(MEERA) Dapodi Call Girls Just Call 7001035870 [ Cash on Delivery ] Pune Escortsranjana rawat
 
High Profile Call Girls Nagpur Isha Call 7001035870 Meet With Nagpur Escorts
High Profile Call Girls Nagpur Isha Call 7001035870 Meet With Nagpur EscortsHigh Profile Call Girls Nagpur Isha Call 7001035870 Meet With Nagpur Escorts
High Profile Call Girls Nagpur Isha Call 7001035870 Meet With Nagpur Escortsranjana rawat
 
Model Call Girl in Narela Delhi reach out to us at 🔝8264348440🔝
Model Call Girl in Narela Delhi reach out to us at 🔝8264348440🔝Model Call Girl in Narela Delhi reach out to us at 🔝8264348440🔝
Model Call Girl in Narela Delhi reach out to us at 🔝8264348440🔝soniya singh
 
Porous Ceramics seminar and technical writing
Porous Ceramics seminar and technical writingPorous Ceramics seminar and technical writing
Porous Ceramics seminar and technical writingrakeshbaidya232001
 
SPICE PARK APR2024 ( 6,793 SPICE Models )
SPICE PARK APR2024 ( 6,793 SPICE Models )SPICE PARK APR2024 ( 6,793 SPICE Models )
SPICE PARK APR2024 ( 6,793 SPICE Models )Tsuyoshi Horigome
 
What are the advantages and disadvantages of membrane structures.pptx
What are the advantages and disadvantages of membrane structures.pptxWhat are the advantages and disadvantages of membrane structures.pptx
What are the advantages and disadvantages of membrane structures.pptxwendy cai
 
OSVC_Meta-Data based Simulation Automation to overcome Verification Challenge...
OSVC_Meta-Data based Simulation Automation to overcome Verification Challenge...OSVC_Meta-Data based Simulation Automation to overcome Verification Challenge...
OSVC_Meta-Data based Simulation Automation to overcome Verification Challenge...Soham Mondal
 
Introduction to IEEE STANDARDS and its different types.pptx
Introduction to IEEE STANDARDS and its different types.pptxIntroduction to IEEE STANDARDS and its different types.pptx
Introduction to IEEE STANDARDS and its different types.pptxupamatechverse
 
High Profile Call Girls Nagpur Meera Call 7001035870 Meet With Nagpur Escorts
High Profile Call Girls Nagpur Meera Call 7001035870 Meet With Nagpur EscortsHigh Profile Call Girls Nagpur Meera Call 7001035870 Meet With Nagpur Escorts
High Profile Call Girls Nagpur Meera Call 7001035870 Meet With Nagpur EscortsCall Girls in Nagpur High Profile
 
Call Girls in Nagpur Suman Call 7001035870 Meet With Nagpur Escorts
Call Girls in Nagpur Suman Call 7001035870 Meet With Nagpur EscortsCall Girls in Nagpur Suman Call 7001035870 Meet With Nagpur Escorts
Call Girls in Nagpur Suman Call 7001035870 Meet With Nagpur EscortsCall Girls in Nagpur High Profile
 
Architect Hassan Khalil Portfolio for 2024
Architect Hassan Khalil Portfolio for 2024Architect Hassan Khalil Portfolio for 2024
Architect Hassan Khalil Portfolio for 2024hassan khalil
 
Coefficient of Thermal Expansion and their Importance.pptx
Coefficient of Thermal Expansion and their Importance.pptxCoefficient of Thermal Expansion and their Importance.pptx
Coefficient of Thermal Expansion and their Importance.pptxAsutosh Ranjan
 
IMPLICATIONS OF THE ABOVE HOLISTIC UNDERSTANDING OF HARMONY ON PROFESSIONAL E...
IMPLICATIONS OF THE ABOVE HOLISTIC UNDERSTANDING OF HARMONY ON PROFESSIONAL E...IMPLICATIONS OF THE ABOVE HOLISTIC UNDERSTANDING OF HARMONY ON PROFESSIONAL E...
IMPLICATIONS OF THE ABOVE HOLISTIC UNDERSTANDING OF HARMONY ON PROFESSIONAL E...RajaP95
 

Recently uploaded (20)

Introduction to Multiple Access Protocol.pptx
Introduction to Multiple Access Protocol.pptxIntroduction to Multiple Access Protocol.pptx
Introduction to Multiple Access Protocol.pptx
 
(RIA) Call Girls Bhosari ( 7001035870 ) HI-Fi Pune Escorts Service
(RIA) Call Girls Bhosari ( 7001035870 ) HI-Fi Pune Escorts Service(RIA) Call Girls Bhosari ( 7001035870 ) HI-Fi Pune Escorts Service
(RIA) Call Girls Bhosari ( 7001035870 ) HI-Fi Pune Escorts Service
 
(ANVI) Koregaon Park Call Girls Just Call 7001035870 [ Cash on Delivery ] Pun...
(ANVI) Koregaon Park Call Girls Just Call 7001035870 [ Cash on Delivery ] Pun...(ANVI) Koregaon Park Call Girls Just Call 7001035870 [ Cash on Delivery ] Pun...
(ANVI) Koregaon Park Call Girls Just Call 7001035870 [ Cash on Delivery ] Pun...
 
(PRIYA) Rajgurunagar Call Girls Just Call 7001035870 [ Cash on Delivery ] Pun...
(PRIYA) Rajgurunagar Call Girls Just Call 7001035870 [ Cash on Delivery ] Pun...(PRIYA) Rajgurunagar Call Girls Just Call 7001035870 [ Cash on Delivery ] Pun...
(PRIYA) Rajgurunagar Call Girls Just Call 7001035870 [ Cash on Delivery ] Pun...
 
★ CALL US 9953330565 ( HOT Young Call Girls In Badarpur delhi NCR
★ CALL US 9953330565 ( HOT Young Call Girls In Badarpur delhi NCR★ CALL US 9953330565 ( HOT Young Call Girls In Badarpur delhi NCR
★ CALL US 9953330565 ( HOT Young Call Girls In Badarpur delhi NCR
 
Study on Air-Water & Water-Water Heat Exchange in a Finned Tube Exchanger
Study on Air-Water & Water-Water Heat Exchange in a Finned Tube ExchangerStudy on Air-Water & Water-Water Heat Exchange in a Finned Tube Exchanger
Study on Air-Water & Water-Water Heat Exchange in a Finned Tube Exchanger
 
(MEERA) Dapodi Call Girls Just Call 7001035870 [ Cash on Delivery ] Pune Escorts
(MEERA) Dapodi Call Girls Just Call 7001035870 [ Cash on Delivery ] Pune Escorts(MEERA) Dapodi Call Girls Just Call 7001035870 [ Cash on Delivery ] Pune Escorts
(MEERA) Dapodi Call Girls Just Call 7001035870 [ Cash on Delivery ] Pune Escorts
 
High Profile Call Girls Nagpur Isha Call 7001035870 Meet With Nagpur Escorts
High Profile Call Girls Nagpur Isha Call 7001035870 Meet With Nagpur EscortsHigh Profile Call Girls Nagpur Isha Call 7001035870 Meet With Nagpur Escorts
High Profile Call Girls Nagpur Isha Call 7001035870 Meet With Nagpur Escorts
 
Model Call Girl in Narela Delhi reach out to us at 🔝8264348440🔝
Model Call Girl in Narela Delhi reach out to us at 🔝8264348440🔝Model Call Girl in Narela Delhi reach out to us at 🔝8264348440🔝
Model Call Girl in Narela Delhi reach out to us at 🔝8264348440🔝
 
Porous Ceramics seminar and technical writing
Porous Ceramics seminar and technical writingPorous Ceramics seminar and technical writing
Porous Ceramics seminar and technical writing
 
SPICE PARK APR2024 ( 6,793 SPICE Models )
SPICE PARK APR2024 ( 6,793 SPICE Models )SPICE PARK APR2024 ( 6,793 SPICE Models )
SPICE PARK APR2024 ( 6,793 SPICE Models )
 
Exploring_Network_Security_with_JA3_by_Rakesh Seal.pptx
Exploring_Network_Security_with_JA3_by_Rakesh Seal.pptxExploring_Network_Security_with_JA3_by_Rakesh Seal.pptx
Exploring_Network_Security_with_JA3_by_Rakesh Seal.pptx
 
What are the advantages and disadvantages of membrane structures.pptx
What are the advantages and disadvantages of membrane structures.pptxWhat are the advantages and disadvantages of membrane structures.pptx
What are the advantages and disadvantages of membrane structures.pptx
 
OSVC_Meta-Data based Simulation Automation to overcome Verification Challenge...
OSVC_Meta-Data based Simulation Automation to overcome Verification Challenge...OSVC_Meta-Data based Simulation Automation to overcome Verification Challenge...
OSVC_Meta-Data based Simulation Automation to overcome Verification Challenge...
 
Introduction to IEEE STANDARDS and its different types.pptx
Introduction to IEEE STANDARDS and its different types.pptxIntroduction to IEEE STANDARDS and its different types.pptx
Introduction to IEEE STANDARDS and its different types.pptx
 
High Profile Call Girls Nagpur Meera Call 7001035870 Meet With Nagpur Escorts
High Profile Call Girls Nagpur Meera Call 7001035870 Meet With Nagpur EscortsHigh Profile Call Girls Nagpur Meera Call 7001035870 Meet With Nagpur Escorts
High Profile Call Girls Nagpur Meera Call 7001035870 Meet With Nagpur Escorts
 
Call Girls in Nagpur Suman Call 7001035870 Meet With Nagpur Escorts
Call Girls in Nagpur Suman Call 7001035870 Meet With Nagpur EscortsCall Girls in Nagpur Suman Call 7001035870 Meet With Nagpur Escorts
Call Girls in Nagpur Suman Call 7001035870 Meet With Nagpur Escorts
 
Architect Hassan Khalil Portfolio for 2024
Architect Hassan Khalil Portfolio for 2024Architect Hassan Khalil Portfolio for 2024
Architect Hassan Khalil Portfolio for 2024
 
Coefficient of Thermal Expansion and their Importance.pptx
Coefficient of Thermal Expansion and their Importance.pptxCoefficient of Thermal Expansion and their Importance.pptx
Coefficient of Thermal Expansion and their Importance.pptx
 
IMPLICATIONS OF THE ABOVE HOLISTIC UNDERSTANDING OF HARMONY ON PROFESSIONAL E...
IMPLICATIONS OF THE ABOVE HOLISTIC UNDERSTANDING OF HARMONY ON PROFESSIONAL E...IMPLICATIONS OF THE ABOVE HOLISTIC UNDERSTANDING OF HARMONY ON PROFESSIONAL E...
IMPLICATIONS OF THE ABOVE HOLISTIC UNDERSTANDING OF HARMONY ON PROFESSIONAL E...
 

Maint language final

  • 1. Language Error in Aviation Maintenance Final Report C. G. Drury, J. Ma and C. V. Marin August 2005 Prepared for: Federal Aviation Administration William J. Hughes Technical Center Atlantic City International Airport, NJ 08405 Contract #2002-G-025 Dr. William Krebs
  • 2. TABLE OF CONTENTS EXECUTIVE SUMMARY .................................................................................................1 Chapter 1. INTRODUCTION: PROBLEM, MODELS3 AND ARCHIVAL DATA....................................................................................................3 1.1 Models of Communication......................................................................................4 1.1.1 Current Data Sources 1: ASRS AND AIDS...................................................................... 6 1.1.2 Current Data Sources 2: OEM Survey of Airlines............................................................. 8 1.3 Focus Groups on Language Errors.....................................................................18 1.4 Discussion....................................................................................................................20 Chapter 2. METHODOLOGY ........................................................................................22 2.1 Measures.......................................................................................................................22 2.2 Task Cards ...................................................................................................................24 2.3 Experimental Design for Comprehension Test for Non-English Speaking Countries.......................................................................................................................24 2.4 Choice of Participants and Sites..........................................................................26 2.4.1 Asia ........................................................................................................................... 26 2.4.2 Latin America ........................................................................................................... 27 2.4.3 Europe....................................................................................................................... 27 2.4.4 USA........................................................................................................................... 27 2.5 Preparation of the Data Collection Packets....................................................28 2.6 Data Collection Process..........................................................................................29 Chapter 3. PILOT TESTS OF METHODOLOGY.................................................30 3.1 Design............................................................................................................................30 3.2 Choice of Participants and Sites..........................................................................31 3.3 The Preparation of the Data Collection Packet in Chinese......................32 3.3 The Results of Pilot Test 1: Native English-speaking ...............................32 Maintenance Personnel...........................................................................................32 3.5 Results of Pilot Test 2: Native Chinese Engineering Students...............33 3.6 Observations................................................................................................................34 3.7 Conclusions .................................................................................................................35 4.1 Demographics.............................................................................................................36 4.2 Incidence Questionnaire.........................................................................................37 4.2.1 Error Factors ............................................................................................................. 38 4.2.2 Prevention Factors .................................................................................................... 39 4.2.3 Discovery Factors ..................................................................................................... 40 4.3 Intervention Effectiveness.....................................................................................40 4.3.1 Rating scales ............................................................................................................. 44 4.4 Focus Groups..............................................................................................................44 4.4.1 Current Practice ........................................................................................................ 46 4.4.2 Intervention Methods................................................................................................ 47 ii
  • 3. Chapter 5. LATIN AMERICA RESULTS..................................................................50 5.1 Demographics.............................................................................................................50 5.2 Incidence Questionnaire........................................................................................51 5.2.1 Error Factors ............................................................................................................. 52 5.2.3 Discovery Factors ..................................................................................................... 53 5.3 Intervention Effectiveness.....................................................................................54 5.4.2 Rating scales ............................................................................................................. 58 5.4.1 Background information........................................................................................... 60 5.4.2 Written communications to AMTs ........................................................................... 60 5.4.3 Writing communications from AMTs ...................................................................... 61 5.4.4 Verbal Communication:............................................................................................ 61 5.4.5 Common Errors......................................................................................................... 61 5.4.5 Intervention Methods................................................................................................ 61 Chapter 6. EUROPE RESULTS......................................................................................64 6.1 Demographics.............................................................................................................64 6.2 Incidence Questionnaire.........................................................................................64 6.2.1 Error Factors ............................................................................................................. 65 6.2.2 Prevention Factors .................................................................................................... 66 6.2.3 Discovery Factors ..................................................................................................... 67 6.3 Intervention Effectiveness.....................................................................................68 6.4.2 Rating scales ............................................................................................................. 71 6.4 Focus Groups..............................................................................................................73 6.4.1 Current Practice ......................................................................................................... 73 Chapter 7. USA RESULTS................................................................................................75 7.1 Demographics.............................................................................................................75 7.2 Incidence Questionnaire.........................................................................................75 7.2.1 Error Factors .............................................................................................................. 76 7.2.2 Prevention Factors ..................................................................................................... 77 7.2.3 Discovery Factors ...................................................................................................... 78 7.3 Intervention Effectiveness ..........................................................................................78 7.3.1 Rating scales .............................................................................................................. 81 7.4 Focus Groups..............................................................................................................82 Chapter 8. INTEGRATION AND DISCUSSION OF RESULTS ....................83 8.1 Comparisons across Regions................................................................................84 8.1.1 Reading Levels.......................................................................................................... 84 8.1.2 Scenario Frequency and Factors Affecting............................................................... 85 8.1.3 Intervention Effectiveness ........................................................................................ 87 8.2 Effectiveness of Interventions..............................................................................90 8.2.1 Software.................................................................................................................... 90 8.2.2 Hardware................................................................................................................... 92 8.2.3 Environment.............................................................................................................. 92 Chapter 9. FINDINGS AND RECOMMENDATIONS ........................................94 iii
  • 4. List of Figures Figure 1-1. Mean percentage contract maintenance for network and low cost airlines from 2002 to 2004, from raw data in OIG (2005) Figure 1-2. The Communication Model synthesized from literature review (Wideman, 2002; McAuley, 1979; Johnson, 1972, etc.) Figure 1-3. Pattern of contributing factors across error loci Figure 1-4. Pattern of Recovery Attempts across error loci Figure 1-5. Significant differences between Regions of checklist usage Figure 1-6. English speaking ability reported by Region Figure 1-7. English reading ability reported by region Figure 1-8. Regional difference of English usage Figure 1-9. The airlines with low level of English reading ability used different strategies in handling OEM English documents Figure 1-10. The airlines with low level of English Speaking ability used different strategies in handling daily oral conversation Figure 4-1. Relative frequency with which each of the seven scenarios was encountered Figure 4-2. Percentage reporting each factor affecting scenario incidence Figure 4-3. Percentage reporting each factor affecting scenario prevention Figure 4-4. Percentage reporting each factor affecting scenario discovery Figure 4-5. Scatter plots of the two aspects of performance (Accuracy, Time) against the two covariates (Reading Level, Age) Figure 4-6. Differences between Chinese translation and the average of all non-translation groups on the fifteen rating scales Figure 5-1. Relative frequency with which each of the seven scenarios was encountered Figure 5-2. Percentage reporting each factor affecting scenario incidence Figure 5-3. Percentage reporting each factor affecting scenario prevention iv
  • 5. Figure 5-4. Percentage reporting each factor affecting scenario discovery Figure 5-5. Scatter plots of the two aspects of performance (Accuracy, Time) against the two covariates (Reading Level) Figure 5-6. Significant interaction between Intervention and Task Card Difficulty (see text) Figure 5-7. Speed and Accuracy across the three countries Figure 5-8. Interaction of Task Card and Simplified English for Accuracy /Time Figure 5-9. Averages of the fifteen rating scales Figure 6-1. Relative frequency with which each of the seven scenarios was encountered Figure 6-2. Percentage reporting each factor affecting scenario incidence Figure 6-3. Percentage reporting each factor affecting scenario prevention Figure 6-4. Percentage reporting each factor affecting scenario discovery Figure 6-5. Effects of Intervention on Accuracy and Time (Note: not significant separate effects, see text) Figure 6-6. Scatter plots of the two aspects of performance (Accuracy, Time) against the two covariates (Reading Level, Age) Figure 6-7. Averages of the fifteen rating scales Figure 6-8. Significant effects of task card on four rating scales Figure 7-1. Relative frequency with which each of the seven scenarios was encountered Figure 7-2. Percentage reporting each factor affecting scenario incidence Figure 7-3. Percentage reporting each factor affecting scenario prevention Figure 7-4. Percentage reporting each factor affecting scenario discovery Figure 7-5. Scatter plots of the two aspects of performance (Accuracy, Time) against the two covariates (Reading Level, Age) Figure 7-6. Effects of task card on accuracy and time v
  • 6. Figure 7-7. Averages of the fifteen rating scales Figure 8-1. Country/area comparison of accuracy and time for baseline condition Figure 8-2. Country/area comparison of accuracy and time for translated conditions Figure 8-3. Changes in accuracy and time from baseline to translated conditions vi
  • 7. List of Tables Table 1-1. Regional airline sample numbers Table 1-2. Difficulties in handbook use reported by region. Table 1-3. Regional differences between English speaking levels Table 1-4. Regional differences between English reading levels Table 1-5. Regional differences for modifications of OEM documents Table 1-6. Regional differences for language used in different situations Table 1-7. Language errors arising in a task sequence framework Table 1-8. Predisposing and mitigating factors identified in the focus groups Table 2-1. Code Switching Types (Montes-Alcala, 2000) Table 3-1. Participant numbers by experimental conditions for Pilot Tests 1 and 2 Table 3-2. Results of Pilot Study 1 for Simplified English Table 3-3. Results of Pilot Study 2 for Simplified English Table 3-4. Results of Pilot Study 2 for Interventions Table 4-1. Background information on the MROs in Asia Table 4-2. Demographics of the three areas, with mean values and test results Note that * signifies a mean value different from the others at p<0.05 on the post hoc Tukey test, or Standardized Residuals test for Chi-square. Table 4-3. Median weeks since previous occurrence and mean percent reported for each scenario Table 4-4. Summary of ANONA results for intervention performance Table 4-5. Performance results for the four interventions Shaded results not significant at p < 0.05 Table 4-6. Performance comparisons by Area. Shaded results not significant at p < 0.05. Note that * signifies a mean value different from the others at p < 0.05 on the post hoc Tukey test vii
  • 8. Table 4-7. Performance comparisons between the two task cards. Shaded results not significant at p < 0.05 Table 5-1. Background information on the MROs in Latin America Table 5-2. Demographics of the four countries, with mean values and test results. Note that * signifies a mean value different from the others at p<0.05 on the post hoc Tukey test. Table 5-3. Median Weeks Since Previous Occurrence and Mean Percent Reported for each Scenario Table 5-4. Summary of ANONA results for intervention performance Table 6-1. Background information on the MRO in Europe Table 6-2. Demographics of the single country tested in Europe Table 6-3. Median weeks since previous occurrence and mean percent reported for each scenario Table 6-4. Summary of ANOVA results for intervention performance Table 7-1. Background information on the MROs in USA Table 7-2. Demographics of the USA sample Table 7-3. Median weeks since previous occurrence and mean percent reported for each scenario Table 7- 4. Summary of ANOVA results for intervention performance viii
  • 9. List of Acronyms AECMA………………………Aircraft European Contractors Manufacturers Association AIAA………………………………...American Institute of Aeronautics and Astronautics AMT……………………………………………………Aviation Maintenance Technician ANCOVA…………………………………………………………Analyses of Covariance ANOVA……………………………………………………………...Analysis of Variance ASRS………………………………………….. NASA Aviation Safety Reporting System CACC……………………………………………..Civil Aviation Administration of China CAUC……………………………………………….....Civil Aviation University of China FAA…………………………………………………….. Federal Aviation Administration FAR…………………………………………………………..Federal Aviation Regulation GRE………………………………………………………...Graduate Record Examination GLM………………………………………………………………..General Linear Models JAA………………………………………………….………….Joint Aviation Authorities JAR…………………………………………………………………..Joint Aviation Repair MRO……………………………………………….……Maintenance, Repair & Overhaul NASA……………………………………National Aeronautics and Space Administration NRR………………………………………………...………………….Non-routine Repair NTSB……………………………………………….National Transportation Safety Board OEM…………………………………………………….Original Equipment Manufacture PA…………………………………………………………………………..Public Address QA…………………………………………………...………………….Quality Assurance SHELL…………………………..Software, Hardware, Environment, Liveware, Liveware TOEFL…………………………………………….Test of English as a Foreign Language
  • 10. EXECUTIVE SUMMARY In the past decade there has been a great increase in contract maintenance among major airlines, to a current level of about 50%. The fastest growing segment of the worldwide Maintenance Repair and Overhaul (MRO) market is outside the USA. Although English is the language of aviation, it is certainly not the native language of most of the world. Thus, language errors may well arise for maintenance of the US civil fleet due to non-native English speakers interacting with maintenance materials in English. This study assists the Federal Aviation Administration (FAA) in answering a Secretary of Transportation recommendation that: “The FAA should establish a method for determining whether language barriers result in maintenance deficiencies.” The contribution of this study has been to collect quantitative evidence to test whether language errors pose a problem for maintenance and further to provide quantitative evidence for how any potential problem can be managed. A total of 941 aviation maintenance workers on four continents were tested to measure the incidence of language error, to examine the factors leading to such error and its detection, and to measure the effectiveness of chosen interventions. From analysis of an Original Equipment Manufacture (OEM) database on language use, we were able to find the prevalence of English and native language usage from 113 airlines around the world. English verbal abilities were highest in North America, followed by Europe and lowest in Asia and the rest of the world. Translation of maintenance manuals was rare while translation of task cards and engineering orders was more common in Asia. Most meetings and training were conducted in the native language. Even among airlines with low reported levels of English ability, translation of documents was uncommon. Our own observations and focus groups in USA and UK helped develop a pattern of language error scenarios, and a set of factors that may influence the frequency of these scenarios. The frequency of occurrence of these scenarios, and factors affecting their incidence and mitigation, was measured in the study of 941 maintenance personnel, largely Aviation Maintenance Technicians (AMTs). A comprehension test methodology quantified the effectiveness of language error interventions, for example by providing a bilingual coach, providing an English – native language glossary or using a full or partial translation of a document. From the OEM survey and demographic data on language use, the choice of sites was narrowed to those using a form of Chinese or Spanish. With English, these two languages are the most commonly used on earth. We chose as regions Asia, Latin America and Europe (Spain), with a control sample from the USA. While we were measuring scenario frequency and intervention effectiveness, we also collected data on English vocabulary of participants, which gives a direct estimate of reading level on a scale equivalent to US grades in school. Finally, focus groups were held at each site to discuss how that MRO coped with the potential for language error. Three scenarios related to AMT abilities to understand written and verbal communication in English were the most frequent, being seen by participants about 4 to 10 times per year. Most 1
  • 11. language errors were detected early in the communications process. The reading grade level of participants at USA MROs was about 14 as found in earlier studies. For MROs on other continents, the reading grade level was about 5, with higher levels where there was a history of bilingualism. On all continents, task card comprehension performance improved with reading grade level. In that test, accuracy performance was generally good, and was better in areas that were bilingual. None of the interventions except translation proved effective. Partial translation, leaving technical terms in English, proved as effective as full translation. The use of good practices in documentation design was seen as a contributing factor to language error mitigation. A set of practical interventions emerged from the scenario frequency estimates, the comprehension test and the focus groups. These are given in Chapter 9 as findings and recommendations. Design of work documentation is the primary way to reduce written language errors. Good design practice helps reduce errors and translation into the native language, if performed carefully, was found to increase document comprehension. Individual ability of Aviation Maintenance Technicians (AMTs), inspectors, managers and engineers in written and verbal English communication was important, and can be improved by training and controlled practice. The organizational environment should recognize the deleterious effects of time pressure on errors, and also recognize the symptoms of imperfect communication when it occurs. The organization also needs to plan work assignments to allow AMTs to become more familiar with particular tasks, and provide planned English practice for all personnel. Time pressure on tasks needs to be managed if language errors are to be reduced. 2
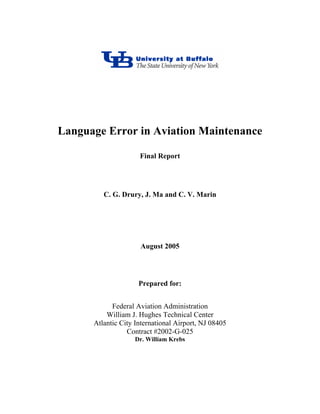
  • 12. ContractMaintenance,% Chapter 1. INTRODUCTION: PROBLEM, MODELS AND ARCHIVAL DATA As the Federal Aviation Administration’s (FAA) Office of the Inspector General reported in June 2005, the country’s air carrier industry is in an era of transition (OIG, 2005). Part of the cause of the transition is record financial losses for FAR Part 121 carriers, and part of the solution is seen as contract maintenance, popularly known as outsourcing. The volume of contract maintenance has been increasing each year, with the percentages for both large Network carriers and Low Cost operators now exceeding 50%. Indeed, an Analysis of Variance of the percentage data (quoted on page 8 of OIG, 2005) for 2002-2004 showed a significant year effect (F(2,22) = 6.04, p = 0,008), with the mean data shown in Figure 1-1. For comparison, the percentage outsourcing in 1996 was 37% (OIG, 2003). 70 60 50 40 30 20 10 0 2002 2003 2004 (Q1-Q3) Network Low Cost Figure 1-1. Mean percentage contract maintenance for network and low cost airlines from 2002 to 2004, from raw data in OIG (2005) Contract maintenance is a preferred corporate strategy for reducing nonessential costs and focusing an organization on its core business (Cant and Jeynes, 1998). In aviation maintenance, Contract maintenance has been advocated and widely used, as it avoids tying up capital in maintenance facilities, and can reduce costs by opening the airline’s maintenance operation to outside competition. One potential impact of such Contract maintenance is that there are more interfaces within the system, each of which represents an opportunity for error. The “system” without Contract maintenance includes the aircraft itself, the airline and the regulatory agency (e.g. the FAA). However, with Contract maintenance, a fourth organization is added to the 3
  • 13. system: the Maintenance/ Repair Organization (MRO). Drury, Wenner and Kritkausky (2000) provided models of these interactions and examined potential and actual error sources from using MROs. Data collection at a number of domestic and foreign MROs did indeed show a potential for increased errors, but little evidence of errors in practice. Sparaco (2002) sees the formation of global MRO networks involving US and foreign airlines, as well as repair stations. In addition to offshore MROs, there are many within the USA where non-native English speakers form part of the labor pool. The difficulty of moving between languages creates an additional potential for error. The language of aviation is primarily English, both in operations and in maintenance. Aviation Maintenance Technicians (AMTs) must pass their examinations in English, and maintenance documentation in use at the Federal Aviation Administration (FAA) approved facilities is in English. This poses a second-language or translation burden for Non-Native English Speakers (NNESs) that can potentially increase their workload, their performance time or their error rate, or even all three measures. In a 2001 report to the Secretary of Transportation by the Aircraft Repair and Maintenance Advisory Committee, many of these issues were raised in considering changes to the domestic and foreign FAR Part 145. They recommended that: “The FAA should establish a method for determining whether language barriers result in maintenance deficiencies.” This project is a direct response to these concerns that NNES, in repair stations in the USA and abroad, may be prone to an increased error rate that could potentially affect airworthiness. 1.1 Models of Communication Communication is defined as “a dynamic and irreversible process by which we engage and interpret messages within a given situation or context, and it reveals the dynamic nature of relationships and organizations” (Rifkind, 1996). Communication can be formal or informal. Davidmann (1998) made a distinction between formal and informal communication, where formal communication implies that a record is kept of what has been said or written, so that it can be attributed to its originator. On the whole, written communications are formal. Most on- the-job communication is informal, unwritten, and sometimes even unspoken. An important distinction made in communication theory is the temporal aspect: communication is either synchronous or asynchronous. In aviation maintenance, synchronous communication is typically verbal, e.g. conversations or PA announcements, while asynchronous communication is typically written, e.g. work documentation or placards. In the context of aviation maintenance and inspection, communication has been the most frequent aspect studied since the human factors movement began there in the early 1990’s (Taylor and Patankar, 2000). The fundamental function of communication is to deliver a message from one human being to another. In almost every aspect of aviation work, communication also fulfills a secondary role as an enabler (or tool) that makes it possible to accomplish a piece of work (Kanki and Smith, 2001). Based on examination of accident investigations and incident reports, Orasanu, Davision 4
  • 14. and Fischer (1997) summarized how ineffective communication can compromise aviation safety in three basic ways: 1. Wrong information may be used. 2. Situation awareness may be lost. 3. Participants may fail to build a shared model of the present situation at a team level. Communication models in the form of generally simple diagrams are important in helping people to understand the concept and process (Wideman, 2002). Kanki and Smith (2001) state that human communication always takes place within a set of contexts, such as a social context, a physical context and/or an operational context. Compared to some other work settings, the aviation operational context is relatively structured by standard operating procedures that organize task performance. Figure 1-2 presents a communication model we synthesized from our literature review. Medium i i / iisruption, etc. Fil Not on Peceived Not on Encode Decode Sender Receiver Content Mode Chanel Feedback Interface Culture, Attitude, etc. Culture, Att tude, etc.Noise, Distortion, D ter, Loss Glossary S Glossary R Message Message Figure 1-2. The Communication Model synthesized from literature review (Wideman, 2002; McAuley, 1979; Johnson, 1972,etc.) Based on basic communication theories, a communication process is composed of the sender/receiver (e.g. people, manuals, computers, etc.), the message (e.g. information, emotions, questions, etc.), the medium (e.g. speech, text, sensory, etc.), filters/barriers, feedback, etc. (Kanki and Smith, 2001; Griffith, 1999). Fegyveresi (1997) summarized many variables that influence communication, such as workload, fatigue, personality traits, gender bias, standard phraseology, experience level, vocal cues, etc. Language and cultural diversity can intensify differences and confusions in communication, but a language barrier does not necessarily result in unsafe cockpit operations (Merritt and Ratwatte, 1997). In order to eliminate or at least minimize potential ambiguities and other variances, people establish rules regarding which words, phrases, or other elements will be used for communication, their meaning, and the way they will be connected with one another. The aggregation of these rules is known as a “protocol.” There are four types of protocol related to 5
  • 15. flight and aircraft safety (Rifkind, 1996): verbal, written, graphical, and gestural protocols. According to Rifkind (1996), the only verbal protocol that has been established throughout aviation, including maintenance, is the use of English as the standard language. This was done when the International Civil Aviation Organization (ICAO) was established in 1944. 1.1.1 Current Data Sources 1: ASRS AND AIDS Before field data is collected on language-related maintenance and inspection errors, existing databases need to be searched for relevant reports of such errors. The most useful of these were the NASA/FAA Aviation Safety Reporting System (ASRS) and the Accident/Incident Data System (AIDS). Our main interest was in maintenance and inspection errors, but few were reported in the databases studied. Hence, our objective changed to include all language-related errors, whether by flight crew, ATC, cabin crew or ground crew. This decision was in line with our literature search, which we broadened to include all communication errors. With a large enough set of aviation-related language errors, we can form more general models, of which maintenance and inspection errors will be a specific instance. Based on a preliminary reading of about 60 incident reports, a taxonomy was developed of error manifestations, causal factors and recovery mechanisms. Some entries in this taxonomy reflect the earlier analysis by Orasanu, Davision and Fischer (1997), although we have tried to separate contributing factors from recovery mechanisms. This preliminary reading also found likely key words for searches. Two keyword searches were made of the ASRS and AIDS databases. The first was on “English” and the second on “Language.” We classified 684 incidents by error type, contributing factor, and recovery mechanism. Details are not presented here due to space limitations. The main division of error types was between synchronous and asynchronous communication. Within these, a relatively fine classification was made by the roles of the two communicators, e.g. flight crew with ground crew. This classification was eventually collapsed into four categories. Note that “language” was used to refer to two items. Language could mean the actual language used (e.g. French, Spanish, Chinese, English) or the choice of words/phrases (e.g. listener expected one term but communicator used what was incorrectly thought to be a synonym). Some of the communication channels themselves were poor, classified here as low signal/noise ratio. In many cases, the report mentioned that at least one of the communicators was inexperienced, for example an American crew’s first flight for some years into a Mexican airport. The analysis of the ASRS and AIDS databases used a cross-tabulation technique developed by Wenner and Drury (2000) to show significant and often interesting conclusions in Figure 1-3 and Figure 1-4. When the error locus was classified by the roles of the communicators, differences in contributing factors and recovery mechanisms were seen. Our four categories of causal factors gave roughly equal counts in the databases, showing that the use of other than a native language was an important causal factor in these errors. This contributing factor appeared to be distributed across error loci, except for asynchronous communication, where it was under­ represented. In fact, for asynchronous communication as a whole, native language and low 6
  • 16. signal/noise ratio were under-represented factors, while unclear terminology was over­ represented. For recovery, asynchronous communication had the least opportunity for recovery mechanisms. In particular, the repetition useful in synchronous communications was not usually fruitful. 0 10 20 30 40 50 60 Contributing Inexperience Percentage Native Language Unclear Terminology Low S/N Ratio us ic ckpit ups ff no Tra ro A synchro C o G a- her r Int O t 0 20 40 60 80 Recovery ( Figure 1-3. Pattern of contributing factors across error loci 100 PercentageUsing Readback Repeat Clarify ns) No Recovery ps kpit ous ic ff u ro on ra oc rG C T chr a- tr he n A sy O t In Figure 1-4. Pattern of recovery attempts across error loci 7
  • 17. The characteristics of maintenance communications errors found here (asynchronous, terminology-related, few recovery mechanisms) helped to set the stage for our direct measurement of these errors from maintenance participant interviews and questionnaires. 1.1.2 Current Data Sources 2: OEM Survey of Airlines From September 2002 to January 2003, an international corporation surveyed a large number of airlines throughout the world concerning their use of English and other languages in flight operations and maintenance operations. The database used was based on a large sample (n = 113) of airlines, approximately evenly divided between North America, Europe, Asia and the rest of the world. As we wished to perform statistical analyses testing for differences between regions, we needed to have enough responses in each Region, based on different challenges in language they are a priori likely to face. Table 1-1 shows the numbers in each region. Region Number Responding Europe 35 North America 16 Asia 30 Other 32 Table 1-1. Regional airline sample numbers The questions analyzed in this paper were all completed by Maintenance personnel. The first analysis was for the question on “Has your company identified any of the following issues with using the checklists in the manufacturer’s handbook? Check all that apply.” This question was the only one that addressed the potential errors in checklist use, so that even though it specifically referenced Flight Operations, it was deemed relevant to any study of patterns of error in communication tasks. Each response type (e.g. Difficulty finding a checklist) was tested with a Chi-square test of equality of proportions across the four Regions. Table 1-2 summarizes the result. Note first that there was a considerable difference between the sixteen error patterns, with some having over twice the frequency of others. The higher frequency issues are to do with physically locating the correct checklist and performing it despite interruptions. In contrast, the lower frequency items have to do with the design, formatting and wording of the checklist itself. Clearly, the airlines in this sample reported operational rather than design difficulties with checklists. 8
  • 18. Handbook Issue Overall % Yes Chi- Square Significance Difficulty finding a checklist 38 10.7 0.014 Difficulty reading a checklist 28 13.7 0.003 Difficulty understanding the checklist 33 4.9 Ns Don't understand why a checklist or checklist step is needed 30 4.7 Ns Difficulty conducting a checklist 17 2.7 Ns Difficulty following a condition statement 32 6.1 Ns Get lost when navigating within a checklist 46 8.2 0.042 Forget to complete a checklist item after an interruption 35 1.6 Ns Skip a step 38 4.7 Ns Forget to complete a checklist 23 3.0 Ns Complete the wrong checklist 45 1.0 Ns Difficulty confirming the checklist is the right checklist 38 3.3 Ns Performing the checklist properly relies too much on pilot's system knowledge 19 3.4 Ns The actions each pilot should perform or not perform are unclear 26 1.4 Ns Not enough information to support crew in conduct of checklist 18 2.2 Ns Information in checklist is difficult to read or interpret 21 11.8 0.008 Table 1-2. Difficulties in handbook use reported by region For the four issues where there was a significant difference between regions, Figure 1-5 shows these differences. For the first three issues (finding, reading, and navigating) Europe and North America reported the most instances, with Asia and Other progressively less. There should be no regional differences in at least finding a checklist, so that differential willingness to report may be an issue here. Similarly, the final graph of Figure 1-5 on difficulty of reading and interpreting information on the checklist, has North America showing almost twice as many responses as any other region. Again, one would expect less difficulty understanding checklist information in a predominantly English-speaking population, so perhaps the North American users are less tolerant of sub-optimal conditions than those regions where an implicit translation from English to a native language is often required. This may also explain to some extent that checklist design problems are less likely to be reported than operational problems. 9
  • 19. Figure 1-5. Significant Differences between Regions of Checklist Usage Difficulty Finding a Checklist Difficulty Reading a Checklist 100 100 80 80 PercentageYes PercentageYes 60 60 40 40 20 20 0 EU NA AS Other Region 0 EU NA AS Other Region Get Lost When Navigating within a Checklist Information in Checklist is Difficult to Read or Interpret 100 100 8080 PercentageYes PercentageYes 60 60 40 40 2020 0 EU NA AS Other EU NA AS Other 0 Region Region 10
  • 20. Our next analysis was of the reported English language ability of mechanics. One question asked “Estimate the percentage of your mechanics who are described by each of the following levels of English speaking ability”. Four levels of ability were presented: - Can speak or understand very little English - Can speak or understand a few English words or phrases - Can speak and understand English for simple conversations - Can speak and understand English in long, complex conversations Similarly, the next question asked “Estimate the percentage of your mechanics who are described by each of the following levels of English reading ability”. Three levels of ability were presented: - Can read very little English - Can read English for maintenance documents - Can read any English document The data from each level was analyzed separately using one-way ANOVAs between the four Regions. For Speaking ability all levels showed significant differences between regions as given in Table 1-3. English Speaking Level F(3,84) p Can speak or understand very little English 4.53 0.005 Can speak or understand a few English words or phrases 10.12 <0.001 Can speak and understand English for simple conversations 7.06 <0.001 Can speak and understand English in long, complex conversations 16.73 <0.001 Table 1-3. Regional differences between English speaking levels Figure 1-6 shows graphically how the speaking ability varied between Regions. Note the contrast between Europe and North America, where most of the mechanics speak English, and Asia and Other, where there is less reported speaking ability. Exactly similar analyses were performed for English reading ability where again all levels showed significant differences between regions shown in Table 1-4. English Reading Level F(2, 82) p Can read very little English 7.08 <0.001 Can read English for maintenance documents 7.42 <0.001 Can read any English document 10.81 <0.001 Table 1-4. Regional differences between English reading levels 11
  • 21. 100% PercentageSpeaking 90% 80% 70% 60% 50% 40% 30% 20% 10% 0% Complex Conv. Simple Conv. Few Words V Little EU NA AS Other Region Figure 1-6. English speaking ability reported by Region These differences are shown in Figure 1-7 with common scales to provide comparisons. Note again that there is a difference in English abilities between the two groups (Europe, North America and Asia, Other). 0% 10% 20% 30% 40% 50% 60% 70% 80% 90% 100% PercentageReading V Little Any Doc Mtc Doc EU NA AS Other Region Figure 1-7. English reading ability reported by Region The next analysis was for the techniques used in each airline to deal with consequences of any differences between the English language of documents and the native language of mechanics. 12
  • 22. Three questions asked about translation of four types of document: Maintenance Manual, Maintenance Task Cards, and Structural Repair Manual respectively. First, data from these questions were analyzed using a Chi-square test with three responses: - OEM document; in English and not modified - OEM document; modified or rewritten in English by your company - Translated to a different language Where there were too few responses other than the first, the Chi-square was invalid and so data were recoded to give just two levels: - OEM document; in English and not modified - Any modification For the Maintenance Manual, only two of the 88 airlines reported other than “OEM document; in English and not modified”, with one reporting each modification. Clearly, the Maintenance Manual is typically left as supplied. For the other two documents, there was a significant difference between regions (Table 1-5) when the data were combined to two levels as above: Document Overall % Modified Chi-Square Significance Maintenance Task Cards 13.6 26.1 < 0.001 Structural Repair Manual 4.6 12.6 Too few data Table 1-5. Regional differences for modifications of OEM documents In both cases the main difference was that only Asia and Other made modifications for the Maintenance Task Cards; nine airlines modified them in English while three (two in Asia, one in Other) translated them into the native language. Note that for Asia, 33% of the task cards were modified. For the Structural Repair Manual, Asia was the only Region to modify the document, with two performing each modification for a total of 13% modifying the OEM originals in some way. The next questions all dealt with languages used in common situations. Again, the languages specified were English and a language other than English, but a mixture was also allowed if respondents checked both alternatives. The following results (Table 1-6) were obtained from Chi-square tests, with either three categories or recoded into two categories as for Question 1. 13
  • 23. Engineering Order (2) 21.6 34.5 < 0.001 On-site maintenance training (3) 43.2 36.2 < 0.001 Meetings (3) 52.3 30.3 < 0.001 Casual talking (2) 59.1 30.1 < 0.001 Table 1-6. Regional differences for language used in different situations Note that there were many uses of languages other than English, particularly for verbal communication. This is in contrast to the previous question where there were few translations of documents. It is more in line with Figures 6 and 7 in terms of English language abilities. The regionRegion differences are shown in Figure 1-8, where the four graphs are again combined to show similarities. As expected, North American airlines show the least use of languages other than English, with only a single airline showing a mix of English and other languages. Europe also does not use languages other than English even half the time, presumably because of the widespread use of English in the European Union countries, as well as one whole country speaking English as the primary language. However, Asia and Other regions make considerable use of languages other than English in meetings and casual talking between mechanics, with over 79% using this strategy. Asia does translate Engineering Orders most of the time, but Other regions make less than 20% use of this strategy. We conducted a final analysis to further investigate the relationship between an airlines’ actual English ability (reading and speaking) and its strategies of handling OEM English documents and oral conversation in daily maintenance practice. For actual Reading English ability, we recalculated responses to give a level of English reading and speaking ability from 0 = Very Low to 4 = High. We expected those airlines with low level of Reading English ability would adopt some mitigating strategies in using the OEM documents (i.e. modification into AECMA simplified English, translation into their native language). However, when using the Maintenance Manual, 7 out of 8 kept the original OEM document in English without any modification or translation, while only one airline modified/rewrote it in English. When using the Structural Maintenance Manual, 6 out of 8 airlines did not make any modification or translation. Figure 1-9 demonstrates the details how these airlines deal with manufacturer’s English documents. 14
  • 24. Engineering Order Onsite Maintenance Training 100 100 PercentageNon-English 80 60 40 20 PercentageNon-English 80 60 40 20 0 0 EU NA AS Other EU NA AS Other Region Region Meetings Casual Talk 0 20 40 60 80 100 PercentageNon-English 0 20 40 60 80 PercentageNon-English 100 EU NA AS Other EU NA AS Other Region Region Figure 1-8. Regional difference of English usage 15
  • 25. 8 7 6 5 4 3 2 1 0 i ion No i ion NumberUsingEachStrategy Translated Modif cat in English Modif cat Maintenance Structural Task Cards Engineering Manual Repair Manual Order OEM English Documents Figure 1-9. The airlines with low level of English reading ability used different strategies in handling OEM English documents In a similar way, we analyzed the relationship between an airlines’ actual ability at Speaking English and its strategies of handling oral conversation in daily maintenance practice. For actual Speaking English ability, we calculated from the answers to Q14.2.4-Q14.2.7 as following: For those airlines with low level of Speaking English ability (categories 1-3), when conducting Onsite Maintenance Training, 100% conducted the training in a language other than English (i.e. the native language). In Meetings, 10 out of 12 airlines used another language, with the remaining two used both English and another language. Again, during Causal Talking, none of the airlines used English. Figure 1-10 demonstrates the details how they use different strategies in dealing with daily oral conversation. Analysis of the use of English in written and spoken communications showed that English is spoken and read at a high level in North America, and to a large extent (75% or so) in Europe. In contrast, Asia and the other countries have about 50% of users able to work with written English effectively, and about 30-40% able to work with spoken English in the same way. The data from each level of English Speaking/Reading ability were analyzed separately using one- way ANOVAs among the four regions. All levels showed significant differences between regions. 16
  • 26. 12 10 8 6 4 2 0 PercentageYes Mix Other Language English Onsite Training Meeting Casual Talk OEM English Documents Figure 1-10. The airlines with low level of English Speaking ability used different strategies in handling daily oral conversation The airlines cope with any potential problems through a number of means, including document translation, and conducting training and meetings in native languages. In Europe and North America, such strategies were infrequently used, presumably because most mechanics speak English, even if that is not their native language. In contrast, Asia and the rest of the world make significant use of these strategies. Translation of documents was not a common strategy, except for Asia, where 17% of airlines translated Task Cards and 60% translated Engineering Orders. Comparable figures were about 4% and 20% of airlines in other parts of the world, and almost nobody translated the Maintenance Manual. The strategy of using the native language in speaking was widely seen, with almost all Asian airlines and most airlines in other non English- speaking countries conducting meetings and maintenance training in languages other than English. However, this may represent a mismatch to documentation used in the same task that typically remained in English. We expected that those airlines with low levels of English-reading ability would adopt some mitigating strategies in using the original documents (i.e. modification into AECMA Simplified English, translation into their native language). However, the overwhelming majority used English documents. For those airlines with a low level of English-speaking ability, almost all conducted Onsite Maintenance Training and Meetings in a language other than English (i.e. the native language). Again, during Casual Talking, none of the airlines used English. 17
  • 27. 1.3 Focus Groups on Language Errors While the analysis of archival data in the above section could provide some insight into language errors in maintenance, such data were not collected for that purpose (c.f. Drury 1995). More direct data collection involves the use of questionnaires and interviews specifically on the theme of language errors in maintenance. However, before we can ask sensible questions, we must have valid information on the types of errors involved. We collected such data from focus groups at MROs in different countries. So far (May 2003), we have run five such focus groups, three at US-based MROs and the other two at UK-based MROs. A focus group gathers people together to discuss the issue at hand via moderator questions and group discussions. Data are gathered through observations and conversations with participants. Focus groups are particularly appropriate for use in exploratory studies when little is known about a population or phenomenon. According to Albrecht et al. (1993), data collected in focus groups may be more ecologically valid than methods that assess individuals’ opinions in a relatively asocial setting, given that language errors are social events involving the interaction of participants and the interplay and modification of ideas. We used focus groups of people at MROs drawn from AMTs, supervisors, engineers and QA specialists. Each interview lasted about 45 minutes. Our introductory statement (after introductions, ground rules and assurance of anonymity) was: “We are helping the FAA to reduce errors in aviation maintenance and inspection. Our aim is to find improved ways of performing maintenance and inspection jobs. One issue has been that although English is the primary language of aviation, many people do not have English as their native language.” Then, the focus groups discussed approximately ten questions with the principal investigator as moderator. When we had transcribed the data, we compared the transcripts with our notes to look for patterns of maintenance language errors or events under four headings. 1. Error types/patterns 2. Potential error detection points in the maintenance process. 3. Factors predisposing to language errors 4. Factors potentially mitigating language errors 18
  • 28. Function Language Error Detection Setup • AMT may appear perplexed, or may agree with everything said. Task Performance • AMT may ask for assistance or clarification. • AMT may close access prematurely (i.e. before buyback) Buyback • Physical error may be detected. • AMT may not understand inspector’s questions. Table 1-7. Language errors arising in a task sequence framework From these lists, we were able to see the functions of aircraft maintenance and inspection (see Drury, Shepherd and Johnson 1997) and where language errors could arise. Table 1-7 represents our current characterization of these situations where their errors could arise, presented within a task sequence framework. We found the following patterns of error in both verbal (synchronous) and written (asynchronous) communication: Verbal (Synchronous) 1. AMT unable to communicate verbally to the level required. 2. AMT and colleagues/supervisors have poorly matched models of their own and each other’s English ability. 3. Native English speakers with different regional or non-US English accents (e.g. UK, India, Caribbean) prevent adequate communications. 4. AMTs unable to understand safety announcements over the PA system. Written (Asynchronous) 5. AMT unable to understand safety placard in English. 6. AMT unable to understand written English documentation. 7. Foreign documentation poorly translated into English. These patterns form the basis for a set of seven Scenarios that were tested in the field data collection methodology defined in Chapter 2. Table 1-8 shows the predisposing and mitigating factors identified in the focus groups. They are classified in terms of the SHELL model of human factors in aviation (Easterby, 1967). 19
  • 29. SHELL Category Predisposing Factors Mitigating Factors Software (procedures) • Task complexity • Document translation • Instruction complexity • Consistent terminology • Good document design Hardware (equipment) • Limitations of • Use of aircraft as a communication channel, communication device: e.g. radio, PA “show me” Environment • Time pressure prevents AMT from querying others Liveware (individual) • Inadequate written English ability • Job familiarity • Comprehension tests for • Inadequate verbal English AMTs ability • Reversion to native • Certify AMT for specific jobs language under stress Liveware (intercommunication) • Unwillingness of AMT to expose their lack of English • Time pressure • Translator available • Assign AMTs to job based on English ability • Team AMT with native English speaker Table 1-8. Predisposing and mitigating factors identified in the focus groups 1.4 Discussion The first phase was to find the patterns of language errors, provided there is evidence that they exist. Our analysis of communication models and the company database has shown the potential for language errors by showing that responses to language differences may not always keep pace with the need for such interventions. The ASRS database analysis showed some actual language errors, although these were mainly in the flight operations domain more likely to be reported to ASRS. Patterns in this data showed that maintenance language errors were largely asynchronous, were related to terminology and had few recovery mechanisms. The five focus groups refined our conclusions. We now have ample evidence that language errors exist, but also that recovery mechanisms and mitigating factors are possible. The patterns found were numerous, and certainly not limited to asynchronous communication. Although documentation was an important source of difficulty, there were other patterns in verbal communication, including unexpected ones of regional accents of native English speakers. We were also able to further document the time course and propagation of errors, including error detection points and interventions. In an industry as heavily regulated as aviation maintenance, there are a number of barriers to error propagation (c.f. Reason, 1990), including the initial work assignment and inspection by a different person. The characteristics of language errors found so far in maintenance suggests that a few overall patterns may account for most of the potential errors. In the next chapter this project, we use the patterns to design a study for collecting field data to estimate the prevalence of the patterns. It is important to have data collection in several regions of the world, for example those used in our 20
  • 30. analysis of the company database. A methodology of comprehension tests of workcards (e.g. Chervak, Drury and Oullette, 1996; Drury, Wenner and Kritkausky, 1999) is available to test the effectiveness of intervention strategies. These include use of Simplified English, full translation, use of an English-speaking coach and provision of a local language glossary. In this way, we provide a quantitative basis for recommendations to both MROs and regulatory bodies for the effective reduction of language errors. 21
  • 31. Chapter 2. METHODOLOGY Three aspects of interest formed the basis for our data collection efforts, designed specifically to answer FAA questions about the nature and frequency of language errors and possible interventions to reduce these errors. First, typical demographic measures were collected for each participant. In addition we collected language-related data to characterize the population of AMTs and also to provide potential covariates for our analyses of intervention effectiveness. These were Years Studying English, and a measure of reading grade level from the Accuracy Levels Test. Second, a questionnaire was given for each scenario asking whether the respondent had encountered that scenario, how long ago, and what factors were associated with the scenario. Third, the set of interventions noted above was tested using a task card comprehension measure to find their effectiveness. Finally one or more focus groups were held at each site to better understand the way in which potential language errors were handled in their organization. 2.1 Measures Demographic data were collected as: Age, Gender, Job Category and Years as an Aviation Maintenance Technician (AMT). The Accuracy Levels Test (Carver, 1987) is a timed 10-minute test used a total of 100 words with a forced synonym choice among three alternatives, and produced on the scale of reading grade level normed on US public schools. It has been validated against more detailed measures of reading level (Chervak, Drury, Ouellette, 1996). Frequency measures were collected for each of the following scenarios: Scenario 1: “The Mechanic (Aircraft Maintenance Technician, AMT) or Inspector was not able to communicate verbally to the level required for adequate performance.” Scenario 2: “The Mechanic (AMT) or Inspector and the person to whom they were speaking did not realize that the other had limited English ability.” Scenario 3: “Native English speakers with different regional accents did not understand each others’ communications.” Scenario 4: “The Mechanic (AMT) or Inspector did not understand a safety announcement over the Public Address (PA) system.” Scenario 5: “The Mechanic (AMT) or Inspector did not fully understand a safety placard.” Scenario 6: “The Mechanic (AMT) or Inspector did not fully understand documentation in English, for example a Work Card or a Manual.” Scenario 7: “The Mechanic (AMT) or Inspector did not fully understand a document translated from another language into their native language.” For each of these seven scenarios the incidence questionnaire asked first whether each had ever been encountered. This was the primary incidence measure, i.e. percentage incidence of each. To gather more detail on frequency, respondents were asked whether the scenario occurred in the 22
  • 32. past week, month, year or longer. We also asked how many months or years, but the data were not always given in a quantitative manner, so an estimate of the median time since previous occurrence was derived from the week/month/year data. Also, for each scenario, participants were asked to check the factors associated with increased likelihood of the error occurring (9 factors), with mitigating each error (10 factors) and with the discovery of each error (6 factors). The factors came from our previous analyses of databases of errors and focus groups used to derive the scenarios (Drury and Ma, 2003). The factors for each of Error Likelihood were: Likelihood Factor 1 The task is complex 2 The task instructions are complex 3 The communication channel, e.g. radio or PA, interferes with good communication 4 Time pressure prevents the mechanic (AMT) or inspector from asking other people for help 5 The mechanic (AMT) or inspector has inadequate written English ability 6 The mechanic (AMT) or inspector has inadequate verbal English ability 7 The mechanic (AMT) or inspector reverts to their native language under stress 8 The mechanic (AMT) or inspector is unwilling to expose their lack of English 9 Time pressure makes the mechanic (AMT) or inspector hurry The factors for each of Error Prevention (Mitigation Factors) were: Prevention Factor 1 The document is translated into the native language of the mechanic (AMT) or inspector 2 The document uses terminology consistent with other documents 3 The document follows good design practice 4 The mechanic (AMT) or inspector uses the aircraft as a communication device, for example to show the area to be inspected 5 The mechanic (AMT) or inspector is familiar with this particular job 6 The mechanic (AMT) or inspector has taken and passed a comprehension tests 7 The mechanic (AMT) or inspector was certified for that specific job 8 There is a translator available to help the mechanic (AMT) or inspector 9 Jobs are assigned to the mechanic (AMT) or inspector to job based on English ability 10 The mechanic (AMT) or inspector is teamed with a native English speaker to perform the job The factors for each of Error Discovery were: 23
  • 33. Discovery Factor 1 The mechanic (AMT) or inspector appeared perplexed. 2 The mechanic (AMT) or inspector agreed with everything that was said. 3 The mechanic (AMT) or inspector asked for assistance or clarification. 4 The mechanic (AMT) or inspector closed access prematurely (i.e. before buyback) 5 The physical error resulting from the language error was detected. 6 The mechanic (AMT) or inspector did not understand inspector’s questions at buy­ back. To test for how potential documentation errors can be reduced, we measured the effectiveness of document comprehension. In the study, one task card was given to each participant with a 10­ item questionnaire to test comprehension. The methodology had been validated in our previous research (e.g., Chervak, et al., 1996; Drury, Wenner and Kritkausky, 1999). The comprehension score was measured by the number of correct responses, with time taken to complete the questionnaire as an additional measure. In addition, the task card was rated by the participant on the fifteen scales originally developed by Patel et al (1994). 2.2 Task Cards We selected two task cards, one “easy” and one “difficult,” from four task cards used in our previous research (Drury, Wenner and Kritkausky, 1999), because it had already been found that task difficulty affected the effectiveness of one strategy, Simplified English. As was expected, the use of Simplified English had a larger effect on more complex task cards (Chervak and Drury, 2003). The complexity of these task cards was evaluated by Boeing computational linguists and University of Washington technical communications researchers considering word count, words per sentence, percentage passive voice, and the Flesch-Kincaid reading score. The cards differed on all measures. Note that both cards were comparatively well-written, certainly compared to earlier task cards tested by Chervak et al (1996). Both of the task cards were then prepared in the AECMA Simplified English versions, which were also critiqued by experts from Boeing, the University of Washington, and the American Institute of Aeronautics and Astronautics (AIAA) Simplified English Committee. 2.3 Experimental Design for Comprehension Test for Non-English Speaking Countries A fully nested (between subjects) 2 × 2 × 5 design was used with factors as follows: Task card Complexity: 2 levels - Simple - Complex Task card Language: 2 levels - Simplified English - Not Simplified English 24
  • 34. Language Interaction: 5 levels - No intervention (English) - English with glossary - English with coach - Full Native Language translation (- Partial Native Language translation) We have already observed the use of English coaching by a more senior person, e.g., lead, foreman, engineer. Also, from the airline survey, we knew that some organizations translate documents into the native language of the employees. Finally, we have seen glossaries of English/native language words pertaining to aviation maintenance. All three are managerial practices we wished to examine through experimentation. The Partial Native Language translation intervention was only used in Latin America and Europe as the need for this was only apparent after Asian data collection. Linguistic studies of bilingualism and sociolinguistics have illustrated a phenomenon called “Code Mixing” or” Code Switching”, i.e. the use of two languages in a conversation or in a written text (Luna and Perachio, 2005; Montes-Alcala, 2000). People are motivated to switch from one language to another to accommodate to different environments, external pressures or to align themselves with groups that they wish to be identified (Gardner-Chloros, 1991). Table 2-1 shows eight the different types of code switching that have been identified by Montes-Alcala (2000) and how these are used by people in different contexts. Code Switching Type Definition/Purpose/ Use 1. Quotes To quote the original words of a person in a specific language or both. 2. Emphasis To highlight a word, a sentence or an idea. An author can get more attention to a word by switching it to a different language. 3. Clarification or Elaboration A word or a sentence is repeated in both languages to further develop an idea. 4. Lexical Need A particular word that has a special meaning or connotation in one language and it does not have it (or it does not exist) in the other language, e.g. A culturally specific word or technical words like “Internet” 5. Parenthetical Comments An author can enclose a comment in an imaginary parenthesis by writing it in a different language. 6. Idioms/ Linguistic Routines To express an idiomatic expression or linguistic cliché. 7. Stylistic Contributes to the rhythm of the stanzas and adds color and life to the poems 8. Free Switching The code switching does not follow a specific pattern to make the dialogues more lively and believable. Table 2-1. Code Switching Types (Montes-Alcala, 2000) 25
  • 35. In the context of language errors in aviation maintenance, the only one that relay concerns us is #4: Lexical Need. Aviation English has many unique words, with new ones introduced whenever new technical systems are implemented. AMTs learn the meaning of these new words in context, on the job training and from the figures and graphs that illustrate the function of the technical term. Many times these technical words do not have a simple translation on the native language, so that it is easier to use the original term than to make an often cumbersome literal translation. This direct use of foreign terms in aviation language was common in English in the early days of aviation, where many terms were taken directly from the original French. Words such as aileron, fuselage, empennage and longeron have become so accepted into English that aviation users no longer see them as foreign imports. When we found this phenomenon in the Asia data collection, we introduced a new intervention called partial translation to test the impact on comprehension of using original English words when the main sentences are kept in Spanish. We originally intended to use an additional intervention using glossary plus coaching to form a 2 glossary × 2 coaching sub-design. However, in both our Chinese Engineering Graduate sample and early tests at MRO sites, it became obvious that very few participants actually used these job aids (see Section 3, Pilot Tests for more details). Thus, the glossary and coaching intervention was dropped from the study. Additionally, the Chinese and Spanish translation of each task card was only performed once, whether for Simplified English or not, so that no difference was expected between task card language for that intervention. 2.4 Choice of Participants and Sites As noted earlier, data from the manufacturer’s survey indicated that Asia, Europe and Other Countries had quite different responses. Also, recent data (Seidenman and Spanovich, 2004) suggests that Asia and Latin America are the most frequent countries for contract maintenance. Thus our choice of regions was made as Asia and Latin America, with one country from Europe and a control sample from USA. 2.4.1 Asia The political status of the three “countries” selected, Mainland China, Hong Kong and Taiwan is complex, so they will be referred to in this report as “Areas” to avoid the impression that they are, or are not, parts of the same country. There are several reasons to collect data from MROs located in Asia, especially mainland China, Taiwan Hong Kong. First, in our analysis of the manufacturer’s survey data, we found that about 30% of users in Asia had a very limited English speaking ability, another 40% were able to conduct simple conversations; about 40% of the users were able to work effectively with only written maintenance/inspection related documents, and another 15% had very little English reading ability. Compared with North America and Europe, Asia has a much smaller base of English-using mechanics. Second, the Asia-Pacific region is poised to be one of the strongest growth engines for the foreseeable future for the maintenance, repair and overhaul industry (Overhaul & Maintenance, 2002). U.S. and European airlines continue to ship wide-body aircraft to East Asia to take advantage of low labor costs. Almost 26
  • 36. half of the top ten Asian MROs are located in China. According to Aviation Week & Space Technology, “the Civil Aviation Administration of China (CAAC) is confident that despite the downturn in the global airline industry, more maintenance, repair and overhaul (MRO) joint venture companies will be set up with Chinese airlines within the next two years” (Dennis, 2002). Asia is expected to grow worldwide MRO market share from 18% in 2004 to 22% in 2014 (Seidenman and Spanovich, 2004) and is also likely to provide a wide range of managerial practices for handling language differences. By choosing China, Hong Kong and Taiwan, we were able to provide a reasonably consistent language use, and also to include an area (Hong Kong) with a tradition of English/Chinese bilingualism. 2.4.2 Latin America Central and South America are the recipients of an increasing share of worldwide maintenance from North America (Philips, 2005). Their labor rates are generally lower than in North America (Phillips, 2004). In the OEM survey, Latin America was classed as part of “Other” regions for statistical convenience, but that whole class had similar levels of English ability to Asia. Like Asia, a single language, Spanish in this case, is predominant, making translation and administration of the data collection instruments simpler and more consistent. Within Latin America, we chose Mexico as it has a large concentration of full-service MRO sites, Colombia and Argentina as areas with much growth potential and Puerto Rico as an officially bilingual area for comparison with traditionally Spanish-only countries. 2.4.3 Europe The second largest share of worldwide MRO market is Europe, which is expected to grow slightly from 25% in 2004 to 27% in 2014. In our OEM survey, Europe had the largest fraction of good English readers of any region, with few modifications made to task cards. Europe was expected to be the region with the best English performance, except for North America and bilingual areas such as Hong Kong and Puerto Rico. Some European-based MRO organizations, such as Lufthansa Technik, have sites in other regions as well as joint ventures with other countries (Flottau, 2005). Airlines themselves are large MRO providers, with about 60% of the current market in Europe (Phillips, 2005). Only two new comprehensive maintenance bases are expected for the Airbus A380 large transport aircraft, with one in Asia and the other in Europe (Wall, 2005). We chose Spain as we could compare the use of the same language, Spanish, to our sample of Latin American countries. 2.4.4 USA A control group from USA was chosen to provide a baseline comparison for the other regions. We have worked with a number of airlines and MROs in the past, but this time chose an MRO that we had never tested before. The MRO had a number of sites in the USA, of which we chose two in the mid-West for convenience and for an expected low fraction of non-native English speakers. 27
  • 37. 2.5 Preparation of the Data Collection Packets Contacts in several Chinese-speaking countries were helpful in gaining access to MROs. The translation process took place in two steps. A native Chinese research assistant (9 years as an engineering major), who is very familiar with the task cards and bilingual in English, took a lead in translating the packet. A large number of technical and language references were consulted. The principal investigator and other domain experts (e.g., native Chinese mechanical engineers in the Department of Aerospace and Mechanical Engineering at the University at Buffalo, SUNY) were consulted on the technical details (e.g., lockwire). Then both translated and original packets of data collection material were submitted to a retired professor (also fluent in English) from the Department of Avionics, Civil Aviation University of China (CAUC) for review. The translated material included the four task cards (for the full translation condition), the comprehension questions, the task card ratings, the demographic information form, the informed consent form and the questionnaire on frequency and causality of language errors. We developed an English/Chinese glossary for each task card. We had two native English speaking engineering graduate students and two native Chinese speaking engineering graduate students read through all the task cards and circle all the words/phrases/sentences they did not comprehend, or even those about which they were slightly unsure. We built up this glossary to be as comprehensive as possible, including nouns, verbs, adjectives, abbreviations, etc. For data collection where traditional Chinese was used (i.e., Taiwan), all forms were checked for correct current usage of traditional Chinese characters by two bilingual Chinese/English engineers with good knowledge of both human factors and aviation maintenance. We also prepared for data collection in an Asian country with a different language, but the MROs cancelled data collection prior to our visit. For Latin American and European countries, we established a direct contact with the FAA’s liaison of each selected MRO. The selection of MROs was based on their capabilities in Airframe, Non-Destructive Test and Power plant. The translation process was done in two steps. First, a native Spanish speaking research assistant (10 years as an engineering and industrial safety majors) who is bilingual translated all the original English documents (informed consent, demographic data, task cards, glossary, comprehensive questions, partial translation, task card ratings and scenarios) to Spanish. Then, the complete package was reviewed by an expert team of a human factors engineer and two Aviation Maintenance Technicians (from Spain and Latin American countries) who currently work in a USA MRO. All suggested corrections to the translation of technical words were made until the team was satisfied. 28
  • 38. 2.6 Data Collection Process At each MRO site, an initial meeting with management was used to explain verbally the objectives and conduct of the study, as a supplement to our earlier written communications. At this meeting, we also discussed the type of work at the site, the range of customers served and the importance of language issues and errors. Agreement was reached on the types of participants of most use to us, e.g. AMTs, engineers, QA personnel, managers. The company then scheduled multiple participants at approximately 75 minute intervals. Groups of participants were nominally of six people, but groups with 2-10 were encountered. Each group of participants was welcomed, and the general objective of the data collection, i.e. to understand language errors and how to reduce them, was communicated. After obtaining Informed Consent and completing demographic questions, the participants all started the timed intervention evaluation (task card comprehension test) at the same time. The participants were given one of the four task cards and its associated comprehension questions. They were timed, but instructions emphasized accuracy. When this had been completed, each participant was given the rating form. The participants who finished both of these rapidly were given the seven- scenario frequency/causality questionnaire to allow slower participants to catch up. All were then given the Accuracy Levels Test, starting the 10 minute timed test at the same time. If time remained in the 75 minute session, the participants who had not completed the incidence questionnaire were given that. If there would not be time, remaining participants were asked to take that questionnaire back to their workplace and return the completed questionnaires later. The participants were scheduled to be tested in groups with the same intervention, as far as possible. However, at times too few participants arrived so that mixed groups were sometimes tested. The participants were told that not all people in the experimental room were getting the same Task Card, or the same intervention condition. On a couple of occasions, a participant did not even attempt the task in one of the first three intervention conditions because they did not read English. In these few cases, the response was noted and the participant was given the equivalent full Chinese translation condition. We could later count this participant as scoring zero on the comprehension test if required. The participants were assigned to the Task Card complexity and Task Card language conditions in rotation. As they were assigned to the experiment by their manager, no unwanted volunteer bias from this procedure was expected. The participants were volunteers in the experiment, but only after they had been assigned to attend by their managers. A total of 13 focus groups, each of 6-15 engineers, quality personnel, AMTs and managers, were conducted across the sites. Discussions were wide-ranging in English and Chinese, led by one or more of the experimenters posing questions about language errors, communication problems, their causal factors and how such errors are mitigated by the organization and its people. 29
  • 39. Chapter 3. PILOT TESTS OF METHODOLOGY In our continuing work, we will be visiting sites worldwide to measure the frequency of these scenarios, but the current paper concentrates on the second aspect of the work, that of evaluating countermeasures. Our analysis of worldwide survey data from a major manufacturer reported earlier found that two strategies used to reduce the potential for language errors were (a) translation into the native language, and (b) conducting face-to-face meetings in the native language. However, only about 17% of airlines in the region that most often used translation (Asia) actually translated maintenance documents into the native languages. Even among the group of 8 airlines who reported the lowest English speaking ability, only two modified the English documents in any way. Other strategies of intervention found in our site visits included having a bilingual English/native language speaker assist the mechanic with the English documentation, and/or providing a glossary of key words between the native language and English. Finally, our own earlier research into the artificial maintenance language called AECMA Simplified English (e.g., Chervak, Drury and Ouellette, 1996) had shown this to be an effective error reduction technique, particularly for non-native English speakers and for complex work documents. Thus, we will compare four potential language error reduction interventions: • The translation of a document into AECMA Simplified English • The provision of a Glossary • The provision of a bilingual coach • The translation of a document and all related materials into a native language Some of these methods may be combined, for example the provision of both a Glossary and a bilingual coach, or the addition of AECMA Simplified English to all conditions except for translations into the native language. Finally, for comparison, a baseline condition, no intervention, will be required. This paper describes the first two experiments conducted within this framework. 3.1 Design As shown in Table 3-1, our study is a three-factor factorial design with the participants nested under the three factors of: 1. Task Card Complexity (Easy vs. Difficult) 2. Document Language (Simplified English vs. Non-simplified English) 3. Interventions (None, Glossary, Full Translation, Bilingual Coach, Glossary Plus Bilingual Coach) 30
  • 40. Easy Task Card Difficult Task Card Simplified Non-Simplified Simplified Non-Simplified Intervention English English English English #2 #2 #2 #2 #1 #1 #1 #1 1. Control 2 4 2 3 2 4 2 4 2. Glossary 2 2 2 2 3. Tutoring 2 2 2 2 4.Glossary & Tutoring 2 2 2 2 5.Chinese Translation 2 2 2 2 NOTE: #1 represents the number of participants in Pilot Test 1, and #2 represents the number of participants in Pilot Test 2. Table 3-1. Participant numbers by experimental conditions for Pilot Tests 1 and 2 3.2 Choice of Participants and Sites The main task will take place at various foreign Maintenance/Repair organizations (MROs), but the two studies reported here were performed in the USA as baseline and pilot tests. There are several reasons to collect data from MROs located in Asia, especially China. First, in our analysis of the manufacturer’s survey data, we found that about 30% of users in Asia had a very limited English speaking ability, another 40% were able to conduct simple conversations; about 40% of the users were able to work effectively with only written maintenance/inspection related documents, and another 15% had very little English reading ability. Compared with North America and Europe, Asia has a much smaller base of English-using mechanics. Second, the Asia-Pacific region is poised to be one of strongest growth engines for the foreseeable future for the maintenance, repair and overhaul industry (Overhaul & Maintenance, 2002). U.S. and European airlines continue to ship wide-body aircraft to East Asia to take advantage of low labor costs. Almost half of the top ten Asian MROs are located in China. According to Aviation Week & Space Technology, “the Civil Aviation Administration of China (CAAC) is confident that despite the downturn in the global airline industry, more maintenance, repair and overhaul (MRO) joint venture companies will be set up with Chinese airlines within the next two years” (Dennis, 2002). Participants were tested singly or in small groups. After obtaining Informed Consent and completing demographic questions, participants were given one of the four task cards and its associated comprehension questions. They were timed, but instructions emphasized accuracy. After the completion of the comprehension task, participants were given the Accuracy Level Test for the required 10 minutes. This test used a total of 100 words with a forced synonym choice among three alternatives, and produced on the scale of reading grade level. It has been validated against more detailed measures of reading level (Chervak, Drury, Ouellette, 1996). 31
  • 41. 3.3 The Preparation of the Data Collection Packet in Chinese The translation process took place in two steps. A native Chinese research assistant (9 years as an engineering major), who is very familiar with the task cards, took a lead in translating the packet. A large number of technical and language references were consulted. The principal investigator and other domain experts (e.g., native Chinese mechanical engineers in the Department of Aerospace and Mechanical Engineering at the University at Buffalo, SUNY) were consulted on the technical details (e.g., lockwire). Then, both translated the task cards, and original packets of data collection material were submitted to a retired professor from the Department of Avionics, Civil Aviation University of China (CAUC) for a review. We developed an English/Chinese glossary for each task card. We had two native English speaking engineering graduate students and two native Chinese speaking engineering graduate students read through all the task cards and circle all the words/phrases/sentences they did not comprehend, or even those about which they were slightly unsure. We developed this glossary to be as comprehensive as possible, including nouns, verbs, adjectives, abbreviations, etc. With all of this material prepared, we performed two experiments before visiting the Chinese- speaking sites. 3.3 The Results of Pilot Test 1: Native English-speaking Maintenance Personnel This test used 15 participants from three sites in the UK and the USA as a representative sample of English-speaking maintenance personnel who were unlikely to have any language errors. They were tested on the same visits where focus group data was collected, as reported in Drury and Ma (2003). All were tested under the four combinations of Simplified English/Not and Easy/Difficult Task Card to give a 2 x 2 between subjects design. There were no other interventions with these native English speakers. First, there was a high negative correlation between accuracy and time for the comprehension test (r = 0.692, p = 0.004), and moderate correlations of both with Reading Level at p = 0.06. Thus, another variable was created through dividing Accuracy by Time to give a combined overall Performance score. Reading Level was tested as a covariate, but was not significant in any of three GLM ANOVAs of Accuracy, Time and Performance. In each of those ANOVAs, the only significant effect was Task Card, which was significant at p = 0.044, 0.012 and 0.017, respectively. As shown in Table 3-2, the difficult task card had worse performance on all variables than did the easy task card. 32
  • 42. Accuracy, Performance, % Time, s %/s Easy Task Card 74 754 0.104 Difficult Task Card 58 1073 0.058 Table 3-2. Results of Pilot Study 1 for Simplified English 3.5 Results of Pilot Test 2: Native Chinese Engineering Students From December 2003 to February 2004, we conducted a pilot test of our methodology before actually collecting data in foreign MROs in China. 40 native Chinese engineering students were recruited from the graduate student pool at the University at Buffalo. We assumed that a Chinese graduate student majoring in Engineering in the United States possessed more knowledge and had a higher ability to use the English language in general than would be typical of maintenance personnel in China. In order to decrease the gap between these two groups, we specified that student participants should have arrived in the United States less than one year ago to be eligible for this experiment. For this pilot test, we used 40 participants in a three-factor design (5 Interventions x 2 Simplified English/Not x 2 Task Cards). For our pilot test group, there were three possible individual variables that might have affected performance: reading level score, years of learning English, and years as an Engineering major. These could have been useful covariates in the analysis of main factors by reducing the expected variability between individual participants. An inter-correlation matrix of these revealed that “Years of Learning English” was significantly correlated with the time to complete the task card comprehension questionnaire (R = 0.498, p = 0.001), and “Reading Level Score” was related to accuracy (R = 0.34, p = 0.032). We decided to consider two covariates: “Year of Learning English” and “Reading Level Score.” Note that, as with Pilot Test 1, there was a negative correlation between Accuracy and Time, but here it was not statistically significant (p = 0.091). We used GLM 3-factor ANOVAs on each performance variable with and without the above covariates, and found statistical significance for Time and Accuracy/Time in both cases. For Time, there was significant effect of Intervention (F(4,20) = 7.77, p = 0.001), and for Accuracy/Time there was significant effect of Task Card (F(1,20)=5.68, p=0.027). As shown in Table 3-3, the easy task card had a worse performance on all variables than did the difficult task card. The results were quite counter-intuitive, with the difficult task card having better performance than the easy one. We suspect that this may have been caused by the potential variability when two versions of each task card were translated into Mandarin. The effects of Simplified English may also have been different for the Mandarin and original versions. In fact, if the “Translation” intervention is eliminated, no terms in the ANOVA are significant. 33
  • 43. Accuracy, Performance, % Time, s %/s Easy Task Card 66 1364 0.051 Difficult Task Card 72 1202 0.063 Table 3-3. Results of Pilot Study 2 for Simplified English All the interventions resulted in decreased accuracy, but shorter time for completion. We did expect that these Chinese graduate students would achieve higher accuracy when comprehending a task card written in their native language. One possible explanation for this is that the aviation maintenance domain is a very specialized domain, so task cards in both English and Chinese were unfamiliar and difficult for the participants, and the advantages of the native language were somehow minimized. If we considered Performance (i.e., Accuracy/Time), all four interventions (except Glossary) resulted in better overall scores than the Control condition, and the Chinese Translation was significantly better than the Control condition at 0.068 vs. 0.500 (T = -7.81, p = 0.004). As a check on the even distribution of participants across Interventions, a one-way ANOVA of Reading Level between Interventions was conducted. As shown in Table 3-4, there were significant differences in Reading Level (F(4,35) = 3.91, p< 0.01), showing that our random assignment did not in fact produce equivalent groups. English Reading Accuracy, Time, Performance, Level % s %/s 0 Control 10.3 75 1560 0.050 1. Glossary 11.9 73 1519 0.050 3. Tutoring 8.9 69 1264 0.056 4. Glossary & Tutoring 8.8 61 1027 0.057 2. Chinese Translation 10.6 66 1046 0.068 Table 3-4. Results of Pilot Study 2 for Interventions Because “English Reading Level” was significantly different across Interventions, we reconsidered it as a covariate, and ran GLM 3-factor ANOVAs on each performance variable. For performance variables Time and Accuracy/Time, there was not much difference between with and without the new covariate. For Accuracy, with the covariate, the interaction between Intervention and Document English became marginally significant at (F (4, 19) = 2.83, p = 0.054). 3.6 Observations According to our observations, most of the student participants did not utilize the interventions of glossaries, tutoring, or the combination of the above two as much as we had expected. After the experiment, the native Chinese experimenter asked them why they did not utilize the resources. The participants agreed that: “although we do not understand some words, even a 34
  • 44. sentence here and there, we are still able to answer the comprehension questionnaire; clarifying the meaning of all the details may not necessarily improve our performance, but it will take much longer to finish the task.” In fact, this makes sense, as all international students who apply for graduate school in the United States need to submit their scores on the Test of English as Foreign Language (TOEFL), and the Graduate Record Examination (GRE). For non-native English speakers, in order to achieve better scores on the TOEFL and GRE-Verbal tests in a limited time, one key factor is the ability to figure out unknown words, phrases, and even sentences in context. This is a common consensus by non-native English speaking students who have gone through this process. As a result of Pilot Test 2, we have eliminated the combined Glossary and Tutoring condition from our subsequent Asian data collection. 3.7 Conclusions The main comprehension task took less than half an hour to complete, while the other measures, such as the Reading test and the rating scales, together took another 15 minutes or so. Because many people could be tested together, we were efficient in data collection at the site, and cannot develop accurate timetables for our on-site work in China. This experiment used a baseline condition of English documents, and then added translation (including the test form), a glossary, a bilingual coach, and a combination of these last two conditions. We used two levels of task card difficulty, each with and without Simplified English. This made a three-factor factorial experiment (Intervention x Difficulty x Simplified English), with the Reading Level score as a covariate. On the samples tested so far, the US and the UK participants obviously had the baseline intervention only, whereas the Chinese-speaking engineering students had all of the interventions. At this stage, any significant effects should be treated with caution, despite the interesting findings on Simplified English and Interventions. These pilot studies are being used for testing the methodology, training the experimenters, and providing an English-speaking baseline condition. 35
  • 45. Chapter 4. ASIA RESULTS A general description of the characteristics of each of the nine sites is presented in Table 4-1. The data were collected from written sources, managers and focus group discussions. A primary result of this data collection was that all of the sites in China used a mixture of English and translated Chinese documentation, while in Hong Kong and Taiwan only English documentation was used. Area Site # Number of Employees Style of Using Task Card in Maintenance Mainland China 1 > 3,500 English-Chinese Mainland China 2 1,520 English-Chinese Hong Kong 3 632 English Hong Kong 4 2,500 English Mainland China 5 1,993 English-Chinese Mainland China 6 769 English-Chinese Taiwan 7 ~ 300 English Taiwan 8 1,300 English Taiwan 9 <100 English Table 4-1. Background information on the MROs in Asia 4.1 Demographics For each participant we recorded their Gender, Age, Years as an AMT, Years Learning English and Reading Level as given by the Accuracy Levels Test. As it was most unlikely that these demographics would remain constant across the three areas (Mainland China, Hong Kong, Taiwan), one-way ANOVAs were conducted of each demographic, except for the categorical variable of Gender that was tested using Chi-Square. All comparisons gave significant differences by Area, as shown in Table 4-2. Mainland China Hong Kong Taiwan UK/ USA Test Result Significance Number Tested 175 25 54 15 Percent Female 25%* 4% 4% 0 χ2 (2) = 15.84 p < 0.001 Age 33.5* 42.9 40.5 F(2,250) = 34.7 p < 0.001 Years as AMT 8.6* 18.4* 13.6* F(2,250) = 21.9 p < 0.001 Yr. Learning English 20.1* 35.6* 27.1* - F(2,243) = 79.9 p < 0.001 Reading Level 4.9* 6.6 5.8 14.1 F(2,253 = 7.9 p < 0.001 Table 4-2. Demographics of the three areas, with mean values and test results. Note that * signifies a mean value different from the others at p<0.05 on the post hoc Tukey test, or Standardized Residuals test for Chi-square. Note that Mainland China has more females represented, in a generally younger, less experienced sample with lower English exposure and reading ability. For Years as AMT and 36