
Recommended
Recommended
More Related Content
Similar to Lan\'s Presentation at the Ocean Sciences Meeting 2010
Similar to Lan\'s Presentation at the Ocean Sciences Meeting 2010 (20)
More from Lanimal
More from Lanimal (7)
Lan\'s Presentation at the Ocean Sciences Meeting 2010
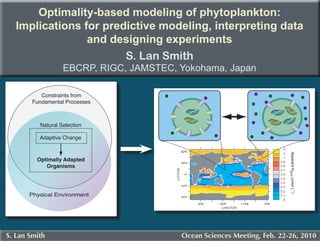
- 1. Optimality-based modeling of phytoplankton: Implications for predictive modeling, interpreting data and designing experiments S. Lan Smith EBCRP, RIGC, JAMSTEC, Yokohama, Japan Constraints from Fundamental Processes Natural Selection Adaptive Change Apparent KNO3 (μmol L-1) Optimally Adapted Organisms Physical Environment S. Lan Smith Ocean Sciences Meeting, Feb. 22-26, 2010
- 2. Optimality A result of Natural Selection, subject to Constraints Plankton are ideal subjects: Constraints from short generation times Fundamental Processes long evolutionary history Therefore we expect them to Natural Selection at least approach Optimality, Adaptive Change which suggests that this concept should be useful for interpreting Optimally Adapted & modeling their behavior. Organisms Physical Environment S. Lan Smith p. 2 Ocean Sciences Meeting, Feb. 22-26, 2010
- 3. Optimality-Based Ideas for Modeling Phytoplankton Selected Examples Roughly in the Space of Fundamental Processes Considered in Trade-offs Light Photoacclimation Aquisition Wirtz & Pahlow (MEPS, 2010) Pahlow (MEPS, 2005) Armstrong (DSRII, 2006) Armstrong (L&O, 1999) Bruggemann & Kooijman Wirtz (J. Biotech., 2002) (L&O, 2007) Smith & Yamanaka (L&O, 2007) Smith et al. (MEPS, 2009) Nutrient Uptake Resistance Merico et al. (Ecol. Modelling, 2009) to Predators S. Lan Smith p. 3 Ocean Sciences Meeting, Feb. 22-26, 2010
- 4. Equations for Rate of Nutrient Uptake Optimal Uptake (Pahlow, MEPS, 2005) Michaelis-Menten Equation V0 S Vmax S vOU = vMM = Ks + S A0 √ V0 + 2 V0 S + S A0 Ks is called the This is like a MM equation with: Half-Saturation “constant”. But it varies with: Nutrient Concentration A0 √ Ks = V0 + 2 V0 S A0 Species Temperature This predicts that Ks values (as fit to the MM eqn.) should increase with Affinity & Ks are related: nutrient concentration. Vmax A= Can this explain Ks the observed pattern? A is also called a (Healey. Micrbial Ecol., 1980) S. Lan Smith p. 4 Ocean Sciences Meeting, Feb. 22-26, 2010
- 5. What do short-term uptake experiments measure? If phytoplankton do not have time to acclimate during expts., Optimal Uptake (OU) kinetics predicts (Smith et al. MEPS, 2009) for apparent values of Michaelis-Menten “constants”: Vmax = √A0Sa/V0 V0 This agrees with observations by Kudela & Dugdale (DSRII 47, 2000), 1 + √A0Sa/V0 but it needs further testing. V0 Sa Ks = √ A0 This agrees with the observed pattern for KNO3 from ship-board expts. (Smith et al. 2009). It’s all based on a physiological trade-off: Sa is ambient nutrient concentration, to which phytoplankton were pre-acclimated before the short-term expts. Low Nutrient Conc. High Nutrient Conc. S. Lan Smith p. 5 Ocean Sciences Meeting, Feb. 22-26, 2010
- 6. Combined Effects of T & Nutrient Concentrations Growth rates increase exponentially with T (Eppley. Fish. Bull. 1972; Bissinger et al. L&O 2008). Max. Uptake Rate, Vmax For uptake or growth, Vmax is usually assumed to be independent of nutrient concentration: Temperature Michaelis-Menten (MM) kinetics. However, Optimal Upake (OU) kinetics predicts that Vmax (from short-term expts.) should MM increase hyperbolically with nutrient conc. OU (Smith et al. MEPS 2009). Nutrient Conc. Nutrient Conc. In the ocean, T and Nutrient Conc. are strongly (negatively) correlated. Vmax Field expts. observe the combined (net) effects. Assumptions about Uptake Kinetics impact the interpretation of observations. Temperature S. Lan Smith p. 6 Ocean Sciences Meeting, Feb. 22-26, 2010
- 7. Correlation of T & [NO3] in the Surface Ocean Negative Correlation in General (e.g., Silio-Calzada et al. Remote Sens. Environ.112, 2008) Up-welling brings cold, nutrient-rich water While phytoplankton grow, nutrients are depleted & at the same time, water is warmed Here for the data of Harrison et al (L&O 1996) *Thanks to G. W. Harrison for providing the complete data set. The regression line was fitted for log [NO3] vs. log T S. Lan Smith p. 7 Ocean Sciences Meeting, Feb. 22-26, 2010
- 8. Dependence of Uptake Rate, v, on T & Nutrients for maximum uptake rate, Vmax as determined by short-term expts. Assuming Multiplicative Effects This widely-applied equation is Michaelis-Menten (MM) from Goldman and Carpenter -Ea/RT [NO ] (Limnol. Oceanogr. 19, 1974). v = Vmax e 3 Ks + [NO3] Optimal Uptake (OU) v = V0√[NO3]aA0/V0 e a -E /RT [NO3] 1 + √[NO3]aA0/V0 √[NO3]aV0/A0 + [NO3] This ratio determines how Vmax The apparent value of Ks depends on ambient nutrient depends on ambient nutrient concentration, [NO3]a. concentration, before It can be determined separately sampling for expts. from fits to data: Ks vs. [NO3]a. (Smith et al. MEPS, 2009). S. Lan Smith p. 8 Ocean Sciences Meeting, Feb. 22-26, 2010
- 9. Dependence of Vmax on T & Nutrients for maximum uptake rate, Vmax, as determined by short-term expts, assuming Multiplicative Effects Michaelis-Menten (MM) Optimal Uptake (OU) -Ea/RT √[NO3]aA0/V0 V e-Ea/RT Vmax = V0 e Vmax = 0 1 + √[NO3]aA0/V0 2 parameters were fitted by regression to data sets for Vmax, [NO3]a & T, for each eq., respectively. This ratio was determined separately, from fits to V0 potential maximum of Vmax data for Ks vs. [NO3] as in Ea Energy of Activation Smith et al. (MEPS 2009). S. Lan Smith p. 9 Ocean Sciences Meeting, Feb. 22-26, 2010
- 10. data of Harrison et al. (L&O 1996) MM OU T- dependent model 100.0 N &T- dependent model 50 Fits of Arrhenius T- using fit of T vs. [NO3] 50.0 only T- dependent model Chl-Specific Max. NO3 Uptake Rate (nmol h-1(μg)-1) dependence, with the Q10 = 1.7 Q10 = 3.4 10 MM- and OU-based as- 5.0 10.0 5.0 sumptions, respectively, for Vmax 1.0 data 1.0 0.5 fits with obs. 0.5 Data: Chl-specific max. T & [NO3] [NO3] uptake rate. 275 285 295 275 285 295 Inferred Q10 is nearly T(K) 100.0 twice as high with the 50 50.0 OU-based assumption. 10 10.0 Residual Square Error: 5.0 5.0 MM OU 9.3 8.5 1.0 T- dependent model 1.0 constant Vmax 0.5 0.5 Fitted values of Ea sig. N &T- dependent model only N- dependent model diff. from 0 for both. 10 1 0.1 0.01 0.001 10 1 0.1 0.01 0.001 [NO3] (μmol L-1) S. Lan Smith p. 10 Ocean Sciences Meeting, Feb. 22-26, 2010
- 11. data of Kanda et al. (L&O 1985) MM OU 1.0 1.0 Q10 = 1.5 Q10 = 2.7 Chl-Specific Max. NO3 Uptake Rate (nmol h-1 (μg chl)-1 ) Fits of Arrhenius T- depen- dence, with the MM- and 0.5 0.5 OU-based assumptions, re- spectively, for Vmax Data: Chl-specific max. N &T- dependent model 0.1 0.1 T- dependent model [NO3] uptake rate. using fit of T vs. [NO3] using fit of [NO3] vs. T only T- dependent model Inferred Q10 is nearly 285 290 295 300 285 290 295 300 T(K) twice as high with the OU- 1.0 1.0 based assumption. Residual Square Error: 0.5 0.5 MM OU 0.82 0.34 Fitted values of Ea sig. diff. data 0.1 fits with obs. 0.1 N &T- dependent model from 0 for both. T & [NO3] using fit of T vs. [NO3] only N- dependent model 0.1 0.01 0.001 0.1 0.01 0.001 [NO3] (μmol L-1) S. Lan Smith p. 11 Ocean Sciences Meeting, Feb. 22-26, 2010
- 12. Conclusions Optimality-based ideas imply different Interpretations of Observations. Specifically for Combined Effects of T & Concentration on Uptake Estimated Q10’s are 2X greater assuming OU vs. MM kinetics. Caveat: The observed Vmax were Chl-specific Chl:N ratios tend to be greater under nutrient-rich conditions, which should under-estimate N-specific rates at high N (low T) Therefore my analysis probably over-estimates Q10’s for both MM- and OU- kinetics Yet even with biomass-specific Vmax, OU would yield higher Q10’s because of the strong negative correlation of T & [NO3} Significant Uncertainties remain about T-dependence & uptake kinetics We need more controlled experiments & field observations of biomass-specific rates S. Lan Smith p. 12 Ocean Sciences Meeting, Feb. 22-26, 2010