1. BACKGROUND
Cape
Romain
is
one
of
four
cuspate
forelands
along
the
Mid-‐Atlan8c
Coast,
which
are
characterized
by
a
triangular
shape
that
is
nearly
perpendicular
to
the
shoreline
(Hayes
et
al.,
2008).
Cuspate
forelands
are
most
commonly
formed
where
two
opposing
wind
direc8ons
converge,
resul8ng
in
converging
waves
that
mold
the
sediment
into
this
morphology
(Hayes
et
al.,
2008).
Cape
Romain
is
characterized
by
an
eroding
headland,
elonga8ng
spits
on
the
flanks
and
an
overall
erosional
nature.
The
two
lateral
flanks
are
rela8vely
symmetric
and
converge
at
just
over
a
90°
angle,
uncommon
for
cape
morphology.
The
outer
shore
of
Cape
Romain
is
one
of
the
most
erosional
coastlines
in
the
state
of
South
Carolina.
Tidal
and
wave
energy
are
important
to
the
morphology
of
Cape
Romain.
Due
to
its
micro-‐
to
meso-‐8dal
seNng,
the
8des
and
waves
influence
Cape
Romain,
with
wave
heights
approximately
1.2
m,
and
mean
8dal
range
of
1.76
m
(Hayes
and
Michel,
2008).
Cape
Romain’s
modern
cuspate
foreland
morphology
and
lateral
spreading
is
greatly
affected
by
wind
and
current
direc8on,
and
is
accelerated
by
hurricane
storm
surges
(Morton
and
Miller
2005).
A
study
of
the
coastal
changes
of
this
cuspate
foreland
was
completed
using
Google
Earth
historical
imagery
from
the
years
1989,
1994,
2005,
2011,
and
2014
(Figure
3).
ABSTRACT
Cape
Romain
is
a
prominent
cuspate
foreland
on
the
South
Carolina
coast,
located
approximately
35
miles
north
of
Charleston
(Figures
1
&
2).
A
thorough
study
using
Google
Earth
imagery
was
completed
in
order
to
determine
the
geomorphologic
changes
of
the
shoreline
from
1989
to
2014.
Major
factors
that
have
affected
the
shape
of
Cape
Romain
include
storm
surges
and
hurricanes,
offshore
morphology,
diverging
wind
paerns,
and
less
recently,
hard
structures
placed
to
the
north
of
the
cape.
Qualita8ve
data
were
analyzed
from
historical
imagery,
and
quan8ta8ve
analyses
of
shoreline
changes
were
made
using
Google
Earth
measurement
tools.
This
study
is
crucial
for
use
in
managing
the
Na8onal
Wildlife
Refuge
located
at
Cape
Romain,
and
understanding
the
effects
of
the
cuspate
forelands’
changing
morphology
on
the
nearby
barrier
islands.
METHODS
• Historical
imagery
viewed
from
Google
Earth
Pro
from
1989,
1994,
2005,
2011,
and
2014.
• Reference
lines
were
drawn
parallel
to
the
beach
of
the
north
and
south
flanks
of
the
cape
using
the
“Add
Path”
tool
on
Google
Earth
(Figure
4).
• Transects
were
drawn
perpendicular
to
the
reference
lines
at
560
m
intervals,
from
reference
line
to
vegeta8on
boundary
(Figure
5).
• Measurements
were
taken
from
reference
lines,
along
transects,
to
the
berm
(wet/dry
line)
and
to
vegeta8on.
• The
“Polygon”
tool
was
used
to
outline
the
beach
in
each
historical
image
(Figure
3)
and
determine
the
area
of
beach
(Figure
6).
• Measurements
were
output
into
tables
in
Excel,
where
quan8ta8ve
data
were
studied
and
graphs
were
made
for
visualizing
the
data
(Figures
7-‐10).
RESULTS
Data
from
transects
show
a
landward
migra8ng
shoreline.
The
western
end
of
the
south
flank
has
a
more
significant
landward
migra8on
than
the
eastern
end,
while
the
largest
amount
of
overall
landward
migra8on
is
in
the
center
of
the
flank
as
seen
in
figure
9.
Transect
8S
shows
a
total
erosion
of
186
m,
the
most
of
each
transect
measure;
this
equates
to
a
rate
of
over
7
m/yr
in
this
25
year
study.
The
quan8ta8ve
data
at
the
south
flank
show
significant
variance
in
the
amount
of
beach
cover
throughout
the
period
of
the
study.
In
1994,
the
beach
land
cover
decreased
over
400,000
m2,
equa8ng
to
16
m2/yr.
The
north
flank
of
Cape
Romain
is
qualita8vely
more
variable
than
the
southern
por8on
previously
discussed.
Data
show
a
general
retreat
in
shoreline
along
with
an
overall
migra8on
to
the
northeast.
The
quan8ta8ve
data
of
the
north
flank
of
Cape
Romain
is
not
as
complex
as
the
south
flank.
Transects
4N-‐10N
show
the
greatest
amount
of
retreat,
in
which
5N
and
6N
are
breached
by
2014.
Transect
7N
shows
the
largest
amount
of
retreat
with
471
m
erosion
equa8ng
to
almost
19
m/yr.
The
beach
area
decreases
for
several
years,
approximately
269,908
m2
un8l
2011
when
the
area
of
beach
begins
to
increase
steadily
throughout
the
remainder
of
the
study.
The
area
of
beach
cover
on
the
north
flank
increases
approximately
149,661
m2
from
June,
2011
to
2014.
DISCUSSION
&
CONCLUSIONS
During
the
study
period
1989
to
2014,
the
morphology
of
Cape
Romain
has
been
severely
affected
by
hurricanes.
The
north
flank
was
greatly
impacted
by
three
hurricanes:
Hurricane
Hugo
in
September
of
1989;
Hurricane
Irene
in
August
of
2011;
and
Hurricane
Sandy
in
September
of
2012.
Hurricane
Hugo
redirected
the
en8re
direc8on
of
the
main
inlet
of
the
cuspate
foreland.
Hurricane
Irene
created
three
new
small
inlets
along
the
north
flank
at
transects
3N,
5N
and
7N.
One
year
later
Hurricane
Sandy
opened
up
much
of
the
north
flank
crea8ng
on
large
inlet
in
the
middle
of
it
as
seen
in
figure
10
at
transects
5N,
6N
and
7N.
Aside
from
natural
causes,
hard
structures
to
the
north
of
Cape
Romain
have
had
historic
influence
on
the
morphology
and
sediment
budget.
Though
these
hard
structures
were
installed
many
years
before
the
study,
they
s8ll
have
effect
on
the
sediment
transport
today,
starving
the
cape
of
much
needed
sediment.
Overall,
the
north
flank
of
Cape
Romain
is
eroding
much
more
rapidly
than
the
south
flank.
Erosion
of
the
north
flank
is
accelerated
by
it’s
posi8on,
exposing
it
to
erosion
from
orienta8on
of
wave
and
wind
driven
currents,
which
affect
lioral
transport.
Addi8onally,
hurricane’s
counterclockwise
circula8on
accelerates
nearshore
currents
and
transport
of
sediment
to
the
southwest,
accelera8ng
erosion
on
the
north
flank.
Erosion
of
the
flanks
of
Cape
Romain
can
severely
affect
the
backbarrier,
leaving
abundant
organisms
exposed.
Due
to
the
biodiversity
of
the
Na8onal
Wildlife
Refuge
area,
steps
must
be
taken
to
determine
causes
for
severe
erosion,
and
possible
solu8ons
for
mi8ga8ng
future
erosion.
Further
research
should
include
profiles
of
the
north
and
south
flank
with
an
accurate
measure
of
erosion
with
regards
to
eleva8on,
to
determine
quan8ta8ve
volumetric
data.
Aside
from
this,
offshore
shoals
should
be
measured
to
determine
proximity
of
welding,
height
and
size.
These
shoals,
as
stated
above,
are
sediment
sinks,
and
rather
than
welding
onto
the
barrier,
sit
close
to
shore.
Cape
Romain
is
one
of
the
most
rapidly
eroding
sec8on
of
beach
along
the
east
coast
of
the
United
States.
The
balance
of
sediment
influx
and
oullux
is
not
sufficient
to
keep
the
cape
from
disintegra8ng.
Ac8on
must
be
taken
to
protect
this
area,
as
many
factors
will
be
impacted.
Quan8fying
Coastal
Change
of
Cape
Romain
using
Google
Earth
from
1989
to
2014
Kori
Ktona,
Kris8n
Hughes,
and
Dr.
Leslie
Sauer
Department
of
Geology
and
Environmental
Sciences
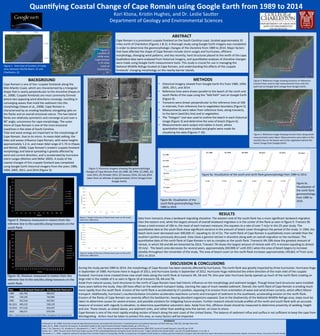
Figure
2.
Loca8on
of
study
area,
Cape
Romain
is
35
miles
north
of
Charleston,
SC.
Figure
1.
Overview
of
loca8on
of
study
area,
between
Myrtle
Beach,
SC
and
Charleston,
SC