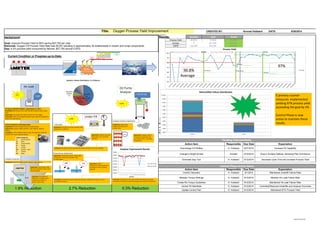
SlideShare a Scribd company logo
1 of 1
Download to read offline
Title: Oxygen Process Yield Improvement CREATED BY: Konrad Hubbard DATE: 8/26/2014
Results:
Row LabelsSum of He Leak %Sum of Blow Off %Sum of Analyzer %Sum of Venting %Sum of Underfill %Sum of Other % Sum of No Fill %Sum of Leak (Fill) % Failure
Baseline 0.038309115 0.00330251 0.00627477 0.00627477 0.03 0.001651255 0.001321 0.000660502
Current 0.01875 0.000892857 0.00267857 0.00133929 0 0.000892857 0.00044643 0.000892857
Grand Total0.057059115 0.004195367 0.00895334 0.00761405 0.03 0.002544112 0.00176743 0.001553359
Savings
102,000COPQ
K. Hubbard 9/12/2014
Control Calculator K. Hubbard 9/1/2014
$44,300 $30,428
90.80% 95.00% 97.00%
0 $57,700 $71,572
1.9% Reduction
Baseline Goal
Eliminate Gap Tool
Maintain Torque Settings
Action Item
Change to Bright Anneal
Update Control Plan
Create Re-Torque Guidelines
Action Item
Control Fill Manifolds
Current Condition or Progress-up-to-Date:
Control Phase Action Items:
Pending Improvements:
Actual
Process Yield
9/12/2014 Drop in Surface Defects, Sampling Plan CommenceAmetek
2.7% Reduction 0.3% Reduction Maintained 97% Process Yield
Maintain He Leak Failure Rate
Maintained He Leak Failure Rate
Controlled/Reduced Underfills and Analyzer Dummies
Decrease Cycle Time and increase Process Yield
Maintained Underfill Failure Rate
Responsible Due Date Expectation
Overcharge 014 Bottles K. Hubbard 8/27/2014 Increase Fill Capability
Surface Inspection and Categorization
Hypothesis: Surface Defects cause He Leak Failures.
Experiment: Inspect 100% cylinders, mark defects, observe
failures.
Conclusion: 15% of defects fail He Leak, 1% of process yield. W
and SD's are most relevant failures.
Background:
Goal: Improve Process Yield to 95% saving $57,700 per year.
Rationale: Oxygen Fill Process Yield Rate was 90.8% resulting in approximately 30 bottles/week in rework and scrap components.
Gap: 4.2% process yield consumed by failures, $57,700 annual COPQ
0.00%
1.00%
2.00%
3.00%
4.00%
5.00%
6.00%
7.00%
8.00%
9.00%
10.00%
Baseline Current
Before/After Failure Distriibution
Calculator
Hypothesis: Calculator truncates numbers, fails
good parts as Under Fill.
Temp Sensor Adjustment
< 99.5% O2
O2 Purity
Analyzer
0.6%
Analyzer Dummy Experiment
2 Fills
Hypothesis: Engineering
samples fail due to worn
rupture discs.
He Leak
Defect Categories:
C: OuterChamfer
D: Dent
IC: InnerChamfer
R: Rough
S: Scratch
SD: Scratch + Dent
T: Thread
W: Wavy
Ametek Inspection
Earlier Capping
Conclusion: No significant
difference in sealing surface
condition yet. Expect to
observe next month.
42% of
failures
LEAK RATE
(He
DETECTOR)
42%
UNDER FILL
(FILL
STATION)
32%
ANALYZER
DUMMY
7%
Baseline Failures Distribution, % of failures
90.8%
Baseline Process Yield
Under Fill
2.9%
Experiment: Analyze 2 fills of
16 Engineering Samples with
new Rupture Discs, controlling
components.
Experiment: Replace Calculator
with simple, non truncating
calculator.
Conclusion: Simplicity of new calculator eliminates truncation. No more cylinders
Hypothesis: Temperature Sensor reads colder
temperature, does not fill cylinders with
enough oxygen.
Experiment: Adjust
temperature sensor alignment.
Use finger to test if correctly
adjusted.
Conclusion: Temperature Sensor Adjustment reduces underfills and allows for more
accurate fill pressures.
Re-Torque Manifold to Bottle, Target Range is 2.14E-9
Hypothesis: Re-torque of He Leak Cylinders reduces leak to spec
level.
Experiment: Re-torque He Leakers in low E-8, E-9 ranges.
Conclusion: 63% of re-torqued cylinders pass. Effective method to
reduce He Leak Failures.
Hypothesis: Capping Cylinders earlier reduces surface defects.
Experiment: Cap cylinders right
after final inspection rather than
during shipping.
98.40%
98.60%
98.80%
99.00%
99.20%
99.40%
99.60%
99.80%
1 2 3 4 5 6 7 8 9 10 11 12 13 14 15 16
Bottle #
Analyzer Experiement Results
Sum of Fill1
Sum of Fill2
Conclusion: New Rupture Discs do not effect pass/fail of purity test.
Inconsistent Purities, but same fill average points towards Fill Manifold
70%
75%
80%
85%
90%
95%
100%
Process Yield
Total
Baseline Current
Re-torque
Calculator
Temp Sensor
Ametek
97%
90.8%
Average
5 primary counter
measures implemented
yielding 97% process yield
exceeding the goal by 2%
Control Phase is now
active to maintain these
results.
68F 71F
> spec
Pass
Fail
Copy of Konrad A3

More Related Content

Similar to OxygenBottleA3

Six Sigma Case Study
Six Sigma Case StudySix Sigma Case Study
Six Sigma Case Study
sanjay_asati
 
Velocys ppt140813_ENFL-ACS_2014
Velocys ppt140813_ENFL-ACS_2014Velocys ppt140813_ENFL-ACS_2014
Velocys ppt140813_ENFL-ACS_2014
John Glenning
 
Schedule of Works Cost Summary Report
Schedule of Works Cost Summary ReportSchedule of Works Cost Summary Report
Schedule of Works Cost Summary Report
Natalie Reid
 

Similar to OxygenBottleA3 (20)

Six Sigma Case Study
Six Sigma Case StudySix Sigma Case Study
Six Sigma Case Study
 
FLUID MECHANICS LAB MANUAL BSc Civil Technology 3rd Semster
FLUID  MECHANICS LAB  MANUAL BSc Civil Technology 3rd Semster FLUID  MECHANICS LAB  MANUAL BSc Civil Technology 3rd Semster
FLUID MECHANICS LAB MANUAL BSc Civil Technology 3rd Semster
 
Senior Design Project - B.S. Mechanical Engineering (ITV Research and analysis)
Senior Design Project - B.S. Mechanical Engineering (ITV Research and analysis)Senior Design Project - B.S. Mechanical Engineering (ITV Research and analysis)
Senior Design Project - B.S. Mechanical Engineering (ITV Research and analysis)
 
Sandeep six sigma ppt
Sandeep six sigma pptSandeep six sigma ppt
Sandeep six sigma ppt
 
Line sizing
Line sizingLine sizing
Line sizing
 
Qualification of instrumets
Qualification of instrumetsQualification of instrumets
Qualification of instrumets
 
234316293-Six-Sigma-in-Garment.pdf
234316293-Six-Sigma-in-Garment.pdf234316293-Six-Sigma-in-Garment.pdf
234316293-Six-Sigma-in-Garment.pdf
 
Vitaletti Leonardo, Elica Motors - Design for Six Sigma ed applicazioni minit...
Vitaletti Leonardo, Elica Motors - Design for Six Sigma ed applicazioni minit...Vitaletti Leonardo, Elica Motors - Design for Six Sigma ed applicazioni minit...
Vitaletti Leonardo, Elica Motors - Design for Six Sigma ed applicazioni minit...
 
15811-55S00.pdf
15811-55S00.pdf15811-55S00.pdf
15811-55S00.pdf
 
1 Hoja especificaciones.pdf
1 Hoja especificaciones.pdf1 Hoja especificaciones.pdf
1 Hoja especificaciones.pdf
 
Velocys ppt140813_ENFL-ACS_2014
Velocys ppt140813_ENFL-ACS_2014Velocys ppt140813_ENFL-ACS_2014
Velocys ppt140813_ENFL-ACS_2014
 
Javier Garcia - Verdugo Sanchez - Six Sigma Training - W1 Minitab - Graphical...
Javier Garcia - Verdugo Sanchez - Six Sigma Training - W1 Minitab - Graphical...Javier Garcia - Verdugo Sanchez - Six Sigma Training - W1 Minitab - Graphical...
Javier Garcia - Verdugo Sanchez - Six Sigma Training - W1 Minitab - Graphical...
 
Mmm lab manual_10_mel47b
Mmm lab manual_10_mel47bMmm lab manual_10_mel47b
Mmm lab manual_10_mel47b
 
Javier Garcia - Verdugo Sanchez - Six Sigma Training - W4 Multiple Regression
Javier Garcia - Verdugo Sanchez - Six Sigma Training - W4 Multiple RegressionJavier Garcia - Verdugo Sanchez - Six Sigma Training - W4 Multiple Regression
Javier Garcia - Verdugo Sanchez - Six Sigma Training - W4 Multiple Regression
 
Enigma of 'six sigma' for foundry sm es in india
Enigma of 'six sigma' for foundry sm es in indiaEnigma of 'six sigma' for foundry sm es in india
Enigma of 'six sigma' for foundry sm es in india
 
Response Surface Regression
Response Surface RegressionResponse Surface Regression
Response Surface Regression
 
Ch20
Ch20Ch20
Ch20
 
Quishpe mireya practica6
Quishpe mireya practica6Quishpe mireya practica6
Quishpe mireya practica6
 
Schedule of Works Cost Summary Report
Schedule of Works Cost Summary ReportSchedule of Works Cost Summary Report
Schedule of Works Cost Summary Report
 
Water Supply Components.ppt
Water Supply Components.pptWater Supply Components.ppt
Water Supply Components.ppt
 

OxygenBottleA3

  • 1. Title: Oxygen Process Yield Improvement CREATED BY: Konrad Hubbard DATE: 8/26/2014 Results: Row LabelsSum of He Leak %Sum of Blow Off %Sum of Analyzer %Sum of Venting %Sum of Underfill %Sum of Other % Sum of No Fill %Sum of Leak (Fill) % Failure Baseline 0.038309115 0.00330251 0.00627477 0.00627477 0.03 0.001651255 0.001321 0.000660502 Current 0.01875 0.000892857 0.00267857 0.00133929 0 0.000892857 0.00044643 0.000892857 Grand Total0.057059115 0.004195367 0.00895334 0.00761405 0.03 0.002544112 0.00176743 0.001553359 Savings 102,000COPQ K. Hubbard 9/12/2014 K. Hubbard 9/12/2014 K. Hubbard 9/12/2014 K. Hubbard 9/12/2014 K. Hubbard 9/12/2014 Control Calculator K. Hubbard 9/1/2014 $44,300 $30,428 90.80% 95.00% 97.00% 0 $57,700 $71,572 1.9% Reduction Baseline Goal Eliminate Gap Tool Maintain Torque Settings Action Item Change to Bright Anneal Update Control Plan Create Re-Torque Guidelines Action Item Control Fill Manifolds Current Condition or Progress-up-to-Date: Control Phase Action Items: Pending Improvements: Actual Process Yield 9/12/2014 Drop in Surface Defects, Sampling Plan CommenceAmetek 2.7% Reduction 0.3% Reduction Maintained 97% Process Yield Maintain He Leak Failure Rate Maintained He Leak Failure Rate Controlled/Reduced Underfills and Analyzer Dummies Decrease Cycle Time and increase Process Yield Maintained Underfill Failure Rate Responsible Due Date Expectation Responsible Due Date Expectation Overcharge 014 Bottles K. Hubbard 8/27/2014 Increase Fill Capability Surface Inspection and Categorization Hypothesis: Surface Defects cause He Leak Failures. Experiment: Inspect 100% cylinders, mark defects, observe failures. Conclusion: 15% of defects fail He Leak, 1% of process yield. W and SD's are most relevant failures. Background: Goal: Improve Process Yield to 95% saving $57,700 per year. Rationale: Oxygen Fill Process Yield Rate was 90.8% resulting in approximately 30 bottles/week in rework and scrap components. Gap: 4.2% process yield consumed by failures, $57,700 annual COPQ 0.00% 1.00% 2.00% 3.00% 4.00% 5.00% 6.00% 7.00% 8.00% 9.00% 10.00% Baseline Current Before/After Failure Distriibution Calculator Hypothesis: Calculator truncates numbers, fails good parts as Under Fill. Temp Sensor Adjustment < 99.5% O2 O2 Purity Analyzer 0.6% Analyzer Dummy Experiment 2 Fills Hypothesis: Engineering samples fail due to worn rupture discs. He Leak Defect Categories: C: OuterChamfer D: Dent IC: InnerChamfer R: Rough S: Scratch SD: Scratch + Dent T: Thread W: Wavy Ametek Inspection Earlier Capping Conclusion: No significant difference in sealing surface condition yet. Expect to observe next month. 42% of failures LEAK RATE (He DETECTOR) 42% UNDER FILL (FILL STATION) 32% ANALYZER DUMMY 7% Baseline Failures Distribution, % of failures 90.8% Baseline Process Yield Under Fill 2.9% Experiment: Analyze 2 fills of 16 Engineering Samples with new Rupture Discs, controlling components. Experiment: Replace Calculator with simple, non truncating calculator. Conclusion: Simplicity of new calculator eliminates truncation. No more cylinders Hypothesis: Temperature Sensor reads colder temperature, does not fill cylinders with enough oxygen. Experiment: Adjust temperature sensor alignment. Use finger to test if correctly adjusted. Conclusion: Temperature Sensor Adjustment reduces underfills and allows for more accurate fill pressures. Re-Torque Manifold to Bottle, Target Range is 2.14E-9 Hypothesis: Re-torque of He Leak Cylinders reduces leak to spec level. Experiment: Re-torque He Leakers in low E-8, E-9 ranges. Conclusion: 63% of re-torqued cylinders pass. Effective method to reduce He Leak Failures. Hypothesis: Capping Cylinders earlier reduces surface defects. Experiment: Cap cylinders right after final inspection rather than during shipping. 98.40% 98.60% 98.80% 99.00% 99.20% 99.40% 99.60% 99.80% 1 2 3 4 5 6 7 8 9 10 11 12 13 14 15 16 Bottle # Analyzer Experiement Results Sum of Fill1 Sum of Fill2 Conclusion: New Rupture Discs do not effect pass/fail of purity test. Inconsistent Purities, but same fill average points towards Fill Manifold 70% 75% 80% 85% 90% 95% 100% Process Yield Total Baseline Current Re-torque Calculator Temp Sensor Ametek 97% 90.8% Average 5 primary counter measures implemented yielding 97% process yield exceeding the goal by 2% Control Phase is now active to maintain these results. 68F 71F > spec Pass Fail Copy of Konrad A3