Keynote technicals currency intraday levels for 231112
•
0 likes•60 views

The document provides daily technical analysis for currency futures contracts traded on the NSE for November 23, 2012. It lists the intraday trend, pivot point, and resistance and support levels for various currency pairs. The pivot point is a trigger for intraday buy/sell decisions, with resistance levels R1-R3 above and support levels S1-S3 below serving as potential price targets and stop loss levels. Maintaining the pivot point as a stop loss is recommended according to this technical analysis tool.

Recommended
Recommended
More Related Content
What's hot
What's hot (20)
Viewers also liked
Viewers also liked (11)
Similar to Keynote technicals currency intraday levels for 231112
Similar to Keynote technicals currency intraday levels for 231112 (13)
More from Keynote Capitals Ltd.
More from Keynote Capitals Ltd. (20)
Recently uploaded
Recently uploaded (20)
Keynote technicals currency intraday levels for 231112
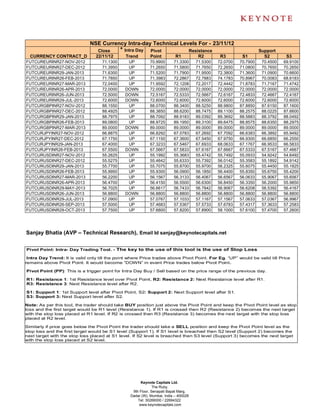
- 1. NSE Currency Intra-day Technical Levels For - 23/11/12 Close * Intra Day Pivot Resistance Support CURRENCY CONTRACT_D 22/11/12 Trend Point R1 R2 R3 S1 S2 S3 FUTCUREURINR27-NOV-2012 71.1300 UP 70.9900 71.3300 71.5300 72.0700 70.7900 70.4500 69.9100 FUTCUREURINR27-DEC-2012 71.3950 UP 71.2650 71.5800 71.7650 72.2650 71.0800 70.7650 70.2650 FUTCUREURINR29-JAN-2013 71.6300 UP 71.5200 71.7900 71.9500 72.3800 71.3600 71.0900 70.6600 FUTCUREURINR26-FEB-2013 71.7850 UP 71.3983 72.2867 72.7883 74.1783 70.8967 70.0083 68.6183 FUTCUREURINR27-MAR-2013 72.0400 UP 71.9592 72.1208 72.2017 72.4442 71.8783 71.7167 71.4742 FUTCUREURINR26-APR-2013 72.0000 DOWN 72.0000 72.0000 72.0000 72.0000 72.0000 72.0000 72.0000 FUTCUREURINR26-JUN-2013 72.5000 DOWN 72.5167 72.5333 72.5667 72.6167 72.4833 72.4667 72.4167 FUTCUREURINR29-JUL-2013 72.6000 DOWN 72.6000 72.6000 72.6000 72.6000 72.6000 72.6000 72.6000 FUTCURGBPINR27-NOV-2012 88.1550 UP 88.0700 88.3400 88.5250 88.9800 87.8850 87.6150 87.1600 FUTCURGBPINR27-DEC-2012 88.4925 UP 88.3850 88.6200 88.7475 89.1100 88.2575 88.0225 87.6600 FUTCURGBPINR29-JAN-2013 88.7975 UP 88.7092 88.9183 89.0392 89.3692 88.5883 88.3792 88.0492 FUTCURGBPINR26-FEB-2013 89.0800 UP 88.9725 89.1950 89.3100 89.6475 88.8575 88.6350 88.2975 FUTCURGBPINR27-MAR-2013 89.0000 DOWN 89.0000 89.0000 89.0000 89.0000 89.0000 89.0000 89.0000 FUTCURJPYINR27-NOV-2012 66.8875 UP 66.8292 67.0783 67.2692 67.7092 66.6383 66.3892 65.9492 FUTCURJPYINR27-DEC-2012 67.1750 UP 67.1150 67.3600 67.5450 67.9750 66.9300 66.6850 66.2550 FUTCURJPYINR29-JAN-2013 67.4000 UP 67.3233 67.5467 67.6933 68.0633 67.1767 66.9533 66.5833 FUTCURJPYINR26-FEB-2013 67.5500 DOWN 67.5667 67.5833 67.6167 67.6667 67.5333 67.5167 67.4667 FUTCURUSDINR27-NOV-2012 55.2625 UP 55.1992 55.3683 55.4742 55.7492 55.0933 54.9242 54.6492 FUTCURUSDINR27-DEC-2012 55.5275 UP 55.4642 55.6333 55.7392 56.0142 55.3583 55.1892 54.9142 FUTCURUSDINR29-JAN-2013 55.7700 UP 55.7075 55.8700 55.9700 56.2325 55.6075 55.4450 55.1825 FUTCURUSDINR26-FEB-2013 55.9950 UP 55.9300 56.0900 56.1850 56.4400 55.8350 55.6750 55.4200 FUTCURUSDINR27-MAR-2013 56.2200 UP 56.1567 56.3133 56.4067 56.6567 56.0633 55.9067 55.6567 FUTCURUSDINR26-APR-2013 56.4700 UP 56.4150 56.5500 56.6300 56.8450 56.3350 56.2000 55.9850 FUTCURUSDINR29-MAY-2013 56.7025 UP 56.6617 56.7433 56.7842 56.9067 56.6208 56.5392 56.4167 FUTCURUSDINR26-JUN-2013 56.8800 DOWN 56.8800 56.8800 56.8800 56.8800 56.8800 56.8800 56.8800 FUTCURUSDINR29-JUL-2013 57.0900 UP 57.0767 57.1033 57.1167 57.1567 57.0633 57.0367 56.9967 FUTCURUSDINR26-SEP-2013 57.5000 UP 57.4683 57.5367 57.5733 57.6783 57.4317 57.3633 57.2583 FUTCURUSDINR29-OCT-2013 57.7500 UP 57.6800 57.8200 57.8900 58.1000 57.6100 57.4700 57.2600 Sanjay Bhatia (AVP – Technical Research), Email Id sanjay@keynotecapitals.net Pivot Point: Intra- Day Trading Tool. - The key to the use of this tool is the use of Stop Loss Intra Day Trend: It is valid only till the point where Price trades above Pivot Point. For Eg. “UP” would be valid till Price remains above Pivot Point. It would become “DOWN” in event Price trades below Pivot Point. Pivot Point (PP): This is a trigger point for Intra Day Buy / Sell based on the price range of the previous day. R1: Resistance 1: 1st Resistance level over Pivot Point, R2: Resistance 2: Next Resistance level after R1. R3: Resistance 3: Next Resistance level after R2. S1: Support 1: 1st Support level after Pivot Point, S2: Support 2: Next Support level after S1. S3: Support 3: Next Support level after S2. Note: As per this tool, the trader should take BUY position just above the Pivot Point and keep the Pivot Point level as stop loss and the first target would be R1 level (Resistance 1). If R1 is crossed then R2 (Resistance 2) becomes the next target with the stop loss placed at R1 level. If R2 is crossed then R3 (Resistance 3) becomes the next target with the stop loss placed at R2 level. Similarly if price goes below the Pivot Point the trader should take a SELL position and keep the Pivot Point level as the stop loss and the first target would be S1 level (Support 1). If S1 level is breached then S2 level (Support 2) becomes the next target with the stop loss placed at S1 level. If S2 level is breached then S3 level (Support 3) becomes the next target with the stop loss placed at S2 level. Keynote Capitals Ltd. The Ruby, 9th Floor, Senapati Bapat Marg, Dadar (W), Mumbai, India – 400028 Tel: 30266000 / 22694322 www.keynotecapitals.com
- 2. Disclaimer: This document is not for public distribution and has been furnished to you solely for your information and must not be reproduced or redistributed to any other person. Persons into whose possession this document may come are required to observe these restrictions. This material is for the personal information of the authorized recipient, and we are not soliciting any action based upon it. This report is not to be construed as an offer to sell or the solicitation of an offer to buy any security in any jurisdiction where such an offer or solicitation would be illegal. It is for the general information of clients of Keynote Capitals Ltd. It does not constitute a personal recommendation or take into account the particular investment objectives, financial situations, or needs of individual clients. We have reviewed the report, and in so far as it includes current or historical information, it is believed to be reliable though its accuracy or completeness cannot be guaranteed. Neither Keynote Capitals Ltd., nor any person connected with it, accepts any liability arising from the use of this document. The recipients of this material should rely on their own investigations and take their own professional advice. Price and value of the investments referred to in this material may go up or down. Past performance is not a guide for future performance. Certain transactions -including those involving futures, options and other derivatives as well as non-investment grade securities - involve substantial risk and are not suitable for all investors. Reports based on technical analysis centers on studying charts of a stock’s price movement and trading volume, as opposed to focusing on a company’s fundamentals and as such, may not match with a report on a company’s fundamentals. Opinions expressed are our current opinions as of the date appearing on this material only. While we endeavor to update on a reasonable basis the information discussed in this material, there may be regulatory, compliance, or other reasons that prevent us from doing so. Prospective investors and others are cautioned that any forward-looking statements are not predictions and may be subject to change without notice. Our proprietary trading and investment businesses may make investment decisions that are inconsistent with the recommendations expressed herein. We and our affiliates, officers, directors, and employees world wide may: (a) from time to time, have long or short positions in, and buy or sell the securities thereof, of company (ies) mentioned herein or (b) be engaged in any other transaction involving such securities and earn brokerage or other compensation or act as a market maker in the financial instruments of the company (ies) discussed herein or act as advisor or lender / borrower to such company (ies) or have other potential conflict of interest with respect to any recommendation and related information and opinions. The analyst for this report certifies that all of the views expressed in this report accurately reflect his or her personal views about the subject company or companies and its or their securities, and no part of his or her compensation was, is or will be, directly or indirectly related to specific recommendations or views expressed in this report. No part of this material may be duplicated in any form and/or redistributed without Keynote Capitals Ltd’s., prior written consent. Keynote Capitals Ltd. The Ruby, 9th Floor, Senapati Bapat Marg, Dadar (W), Mumbai, India – 400028 Tel: 30266000 / 22694322 www.keynotecapitals.com