SlideShare a Scribd company logo
1 of 4
Download to read offline
 
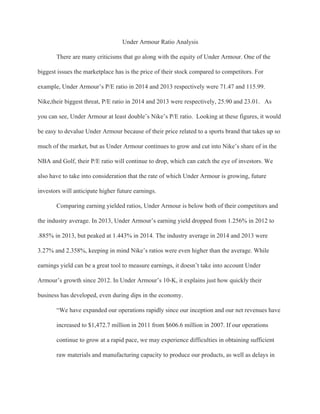
      Under Armour Ratio Analysis  
There are many criticisms that go along with the equity of Under Armour. One of the 
biggest issues the marketplace has is the price of their stock compared to competitors. For 
example, Under Armour’s P/E ratio in 2014 and 2013 respectively were 71.47 and 115.99. 
Nike,their biggest threat, P/E ratio in 2014 and 2013 were respectively, 25.90 and 23.01.   As 
you can see, Under Armour at least double’s Nike’s P/E ratio.  Looking at these figures, it would 
be easy to devalue Under Armour because of their price related to a sports brand that takes up so 
much of the market, but as Under Armour continues to grow and cut into Nike’s share of in the 
NBA and Golf, their P/E ratio will continue to drop, which can catch the eye of investors. We 
also have to take into consideration that the rate of which Under Armour is growing, future 
investors will anticipate higher future earnings.  
            Comparing earning yielded ratios, Under Armour is below both of their competitors and 
the industry average. In 2013, Under Armour’s earning yield dropped from 1.256% in 2012 to 
.885% in 2013, but peaked at 1.443% in 2014. The industry average in 2014 and 2013 were 
3.27% and 2.358%, keeping in mind Nike’s ratios were even higher than the average. While 
earnings yield can be a great tool to measure earnings, it doesn’t take into account Under 
Armour’s growth since 2012. In Under Armour’s 10­K, it explains just how quickly their 
business has developed, even during dips in the economy. 
“We have expanded our operations rapidly since our inception and our net revenues have 
increased to $1,472.7 million in 2011 from $606.6 million in 2007. If our operations 
continue to grow at a rapid pace, we may experience difficulties in obtaining sufficient 
raw materials and manufacturing capacity to produce our products, as well as delays in 
 
production and shipments, as our products are subject to risks associated with overseas 
sourcing and manufacturing.”(10­K)  
 
The asset turnover, which is a measurement of how well a company is using their assets 
to create revenue, for Under Armour’s in 2012, 2013,2014 are as follows, respectively: 
1.47,1.48,and 1.59. The industry average are as follows, respectively: 1.38, 1.32, and 1.41. 
Additionally, Nike’s asset turnover are as follows: 1.50,1.44, and 1.51. As you can see, Under 
Armour is investing in assets at an appropriate rate. A low asset turnover ratio can indicate issues 
with management decision making, which can be from over­investing in property or equipment 
or under­investing by leaving money sitting in the bank. While Under Armour’s profits have rose 
dramatically since 2007, in 2011, they have used their profits to acquire property where their 
corporate headquarters are now located, that includes land, buildings, tenant improvements, and 
third party leases for $65 million. Also in 2015, Under Armour has bought the rights to both 
MyFitnessPal and Endomondo, both fitness apps, in order for them to differentiate themselves 
from Nike and other fitness companies that are trying to claim parts of the fitness markets.   
In 2012 Under Armour’s financial leverage increased from 1.42 in 2012 to 1.50 in 2013 
to 1.55 in 2014.  One of the reasons the financial leverage increased from 2012 to 2013 was due 
to the acquisition of MapMyFitness Inc. on December 6, 2013 for $150,000,000 in cash.   This 
purchase required Under Armour to take $100,000,000 in debt from the revolving credit facility 
and cash on hand.  Then in 2015 Under Armour purchased both Endomondo and  MyFitnessPal 
Inc.  These purchases are estimated to $560,000,000.  These acquisitions will be funded by both 
the increased term loan borrowings and a draw on the increased revolving credit facility and cash 
 
on hand. These acquisitions explain some of the factors that affect the need for long­term debt. 
Therefore, the increase in long­term debt causes Under Armour to have more financial leverage. 
The financial leverage of Under Armour seems comparable to the industry average financial 
leverage.  
Another indicator of financial leverage is the debt­to­asset ratio, which is the percentage 
of the firm's total assets that were financed by creditors, liabilities, and debt. Under Armour’s 
2014, 2013, and 2012 debt­to­asset ratios are as follows: 23.549%, 33.237%, and 29.398%. 
Comparatively, Nike’s debt­to­asset ratios are as follows:  41.788%, 36.556%, and 32.874%. 
The industry average for debt­to­asset are as follows: 33.906%, 30.587%, and 27.445%. As you 
can see, Under Armour follows the industry average pretty closely throughout the years, until 
2014. According to their 2014 10­K, their last substantial loan was taken in through an 
acquisition in 2011, when they turned 400,000 square feet into office space, assuming $60.5 
million dollars in debt. Since then, Under Armour is paying off their debt, since they have had 
stable profits over the past three years. In 2015, Under Armour also acquired two fitness 
programs for smart phones: MyFitnessPal and Endomondo, along with the debt. Since the 2015 
statements haven’t been released, we have not seen the exact effect this will have on Under 
Armour’s financials, though we are expecting their debt­to­asset ratio to increase closer to the 
industry average. While too much debt is a risk for firms, so is having too little. [kh]  


More Related Content

Viewers also liked

Nike Stock Pitch: Analysis and Valuation
Nike Stock Pitch: Analysis and ValuationNike Stock Pitch: Analysis and Valuation
Nike Stock Pitch: Analysis and ValuationAyan Sengupta
 
Financial Accounting Ratio analysis of Indian companies
Financial Accounting Ratio analysis of Indian companiesFinancial Accounting Ratio analysis of Indian companies
Financial Accounting Ratio analysis of Indian companiesKandarp Desai
 
Hiring Hacks: Under Armour’s Formula for Data-Centric & Personalized Recruiting
Hiring Hacks: Under Armour’s Formula for Data-Centric & Personalized RecruitingHiring Hacks: Under Armour’s Formula for Data-Centric & Personalized Recruiting
Hiring Hacks: Under Armour’s Formula for Data-Centric & Personalized RecruitingGreenhouseSoftware
 
Fundamentals of Financial Ratio Analysis
Fundamentals of Financial Ratio AnalysisFundamentals of Financial Ratio Analysis
Fundamentals of Financial Ratio AnalysisB.V. Raghavendra
 
How to Calculate Profit Margin
How to Calculate Profit MarginHow to Calculate Profit Margin
How to Calculate Profit MarginBlaine Bertsch
 
Nike Financial Analysis
Nike Financial AnalysisNike Financial Analysis
Nike Financial AnalysisTyler L. Hough
 
Final ppt under armour
Final ppt under armourFinal ppt under armour
Final ppt under armourAriel Song
 
Corporate Identity
Corporate IdentityCorporate Identity
Corporate Identitytimgay
 
Nike Environmental Analysis
Nike Environmental AnalysisNike Environmental Analysis
Nike Environmental Analysiskelly kusmulyono
 
Strategic Management in a Global Context: Under Armour
Strategic Management in a Global Context: Under ArmourStrategic Management in a Global Context: Under Armour
Strategic Management in a Global Context: Under ArmourRonantonnoel
 
Nike, inc. presentation
Nike, inc. presentationNike, inc. presentation
Nike, inc. presentationjivey
 

Viewers also liked (12)

Ratio analysis
Ratio analysisRatio analysis
Ratio analysis
 
Nike Stock Pitch: Analysis and Valuation
Nike Stock Pitch: Analysis and ValuationNike Stock Pitch: Analysis and Valuation
Nike Stock Pitch: Analysis and Valuation
 
Financial Accounting Ratio analysis of Indian companies
Financial Accounting Ratio analysis of Indian companiesFinancial Accounting Ratio analysis of Indian companies
Financial Accounting Ratio analysis of Indian companies
 
Hiring Hacks: Under Armour’s Formula for Data-Centric & Personalized Recruiting
Hiring Hacks: Under Armour’s Formula for Data-Centric & Personalized RecruitingHiring Hacks: Under Armour’s Formula for Data-Centric & Personalized Recruiting
Hiring Hacks: Under Armour’s Formula for Data-Centric & Personalized Recruiting
 
Fundamentals of Financial Ratio Analysis
Fundamentals of Financial Ratio AnalysisFundamentals of Financial Ratio Analysis
Fundamentals of Financial Ratio Analysis
 
How to Calculate Profit Margin
How to Calculate Profit MarginHow to Calculate Profit Margin
How to Calculate Profit Margin
 
Nike Financial Analysis
Nike Financial AnalysisNike Financial Analysis
Nike Financial Analysis
 
Final ppt under armour
Final ppt under armourFinal ppt under armour
Final ppt under armour
 
Corporate Identity
Corporate IdentityCorporate Identity
Corporate Identity
 
Nike Environmental Analysis
Nike Environmental AnalysisNike Environmental Analysis
Nike Environmental Analysis
 
Strategic Management in a Global Context: Under Armour
Strategic Management in a Global Context: Under ArmourStrategic Management in a Global Context: Under Armour
Strategic Management in a Global Context: Under Armour
 
Nike, inc. presentation
Nike, inc. presentationNike, inc. presentation
Nike, inc. presentation
 

Similar to RatioNotes

English - 5 - Strategic benchmarking in the supply chain triangle.
English - 5 - Strategic benchmarking in the supply chain triangle.English - 5 - Strategic benchmarking in the supply chain triangle.
English - 5 - Strategic benchmarking in the supply chain triangle.Bram Desmet
 
Under armour case analysis by Njinyah Ciro
Under armour case analysis by Njinyah CiroUnder armour case analysis by Njinyah Ciro
Under armour case analysis by Njinyah CiroCiro Njinyah
 
Under armour case analysis by Njinyah Ciro
Under armour case analysis by Njinyah CiroUnder armour case analysis by Njinyah Ciro
Under armour case analysis by Njinyah CiroCiro Njinyah
 
Financial Modeling and Valuation about Nike, Inc
Financial Modeling and Valuation about Nike, IncFinancial Modeling and Valuation about Nike, Inc
Financial Modeling and Valuation about Nike, IncBaozheng (Michael) Ge
 
Strategic Pricing Associates (SPA) Overview Jan-2014
Strategic Pricing Associates (SPA) Overview Jan-2014Strategic Pricing Associates (SPA) Overview Jan-2014
Strategic Pricing Associates (SPA) Overview Jan-2014Strategic Pricing Associates
 
NADA Incentive Analysis
NADA Incentive AnalysisNADA Incentive Analysis
NADA Incentive AnalysisCounselorauto
 

Similar to RatioNotes (10)

Under Armour
Under ArmourUnder Armour
Under Armour
 
Under Armour
Under ArmourUnder Armour
Under Armour
 
Executive Memo
Executive MemoExecutive Memo
Executive Memo
 
English - 5 - Strategic benchmarking in the supply chain triangle.
English - 5 - Strategic benchmarking in the supply chain triangle.English - 5 - Strategic benchmarking in the supply chain triangle.
English - 5 - Strategic benchmarking in the supply chain triangle.
 
Under armour case analysis by Njinyah Ciro
Under armour case analysis by Njinyah CiroUnder armour case analysis by Njinyah Ciro
Under armour case analysis by Njinyah Ciro
 
Under armour case analysis by Njinyah Ciro
Under armour case analysis by Njinyah CiroUnder armour case analysis by Njinyah Ciro
Under armour case analysis by Njinyah Ciro
 
Financial Modeling and Valuation about Nike, Inc
Financial Modeling and Valuation about Nike, IncFinancial Modeling and Valuation about Nike, Inc
Financial Modeling and Valuation about Nike, Inc
 
Strategic Pricing Associates (SPA) Overview Jan-2014
Strategic Pricing Associates (SPA) Overview Jan-2014Strategic Pricing Associates (SPA) Overview Jan-2014
Strategic Pricing Associates (SPA) Overview Jan-2014
 
MOD1ass
MOD1assMOD1ass
MOD1ass
 
NADA Incentive Analysis
NADA Incentive AnalysisNADA Incentive Analysis
NADA Incentive Analysis
 

RatioNotes