SlideShare a Scribd company logo
1 of 13
Download to read offline
NYSE: WMT August 18, 2020 stock.walmart.com
Walmart U.S. Q2 comp sales1
grew 9.3% and Walmart U.S. eCommerce sales grew 97%
Q2 FY21 GAAP EPS of $2.27; Adjusted EPS2
of $1.56
Company incurs incremental costs related to COVID-19 of $1.5 billion
The company’s net sales and operating results were
significantly affected by a continuation of the global health
crisis. Increased demand for products across multiple
categories led to strong top-line and gross margin results.
“I want to give a big thank you to our associates
for their tireless efforts during these
unprecedented times. We also appreciate the
trust and confidence of our customers. We
remain focused on serving them well now and
expanding our set of global capabilities to serve
them well in the future.”
Doug McMillon
President and CEO, Walmart
Total revenue was $137.7 billion, an increase of $7.4 billion,
or 5.6%. Excluding currency2
, total revenue would have
increased 7.5% to reach $140.2 billion.
Walmart U.S. comp sales1
increased 9.3%, led by strength in
general merchandise and food.
Walmart U.S. eCommerce sales grew 97% with strong results across all channels.
Sam’s Club comp sales1
increased 13.3%. eCommerce sales grew 39%. Reduced tobacco sales negatively
affected comp sales by approximately 390 basis points. Growth in membership income was the highest
quarterly increase in more than five years. New member count increased more than 60%.
Walmart International net sales were $27.2 billion, a decrease of 6.8%. Changes in currency rates negatively
affected net sales by approximately $2.4 billion. Excluding currency2
, net sales would have been $29.6 billion,
an increase of 1.6%. Net sales included the effects of the government-mandated closure of the company’s
Flipkart business in India for a portion of the quarter, as well as similar actions in markets in Africa and Central
America.
Consolidated gross profit rate increased 63 basis points primarily as a result of a shift in the mix of sales to
higher-margin general merchandise categories, fewer markdowns and better margins on fuel, partially offset
by the carryover of investments in price from last year. Spending associated with stimulus payments in the U.S.
positively affected sales of general merchandise.
Consolidated operating expenses as a percentage of net sales increased 42 basis points, primarily as a result of
incremental expenses related to COVID-19, a business restructuring in the U.S. and a discrete tax item. In total,
these costs negatively affected expense leverage by about 130 basis points. Underlying productivity in stores
and eCommerce remained strong.
Consolidated operating income was $6.1 billion, an increase of 8.5%. Adjusted operating income in constant
currency2
increased 18.6% led by strength across all operating segments, including significantly lower losses in
Walmart U.S. eCommerce.
Adjusted EPS2
excludes the effects, net of tax, of an unrealized gain of $0.89 on equity investments, a business
restructuring charge in the U.S. of $0.10 and $0.08 for a discrete tax item.
1
Comp sales for the 13-week period ended July 31, 2020 compared to 13-week period ended July 26, 2019, and excludes fuel. See Supplemental Financial
Information for additional information
2
See additional information at the end of this release regarding non-GAAP financial measures.
2
NYSE: WMT August 18, 2020 stock.walmart.com
Key results
(Amounts in billions, except as noted. Dollar and percentage changes may not recalculate due to rounding.)
Q2 FY21 Q2 FY20 Change
Revenue $137.7 $130.4 $7.4 5.6%
Revenue (constant currency)1
$140.2 $130.4 $9.8 7.5%
Operating income $6.1 $5.6 $0.5 8.5%
Operating income (constant currency)1
$6.1 $5.6 $0.6 10.1%
Adjusted operating income (constant currency)1
$6.6 $5.6 $1.0 18.6%
Free Cash Flow1
YTD FY21 $ Change Returns to Shareholders Q2 FY21 % Change
Operating cash flow $19.0 $7.8 Dividends $1.5 0.9%
Capital expenditures $3.6 -$1.3 Share repurchases2
$0.0 -100.0%
Free cash flow1
$15.4 $9.1 Total $1.5 -50.5%
Segment results
(Amounts in billions, except as noted. Dollar and percentage changes may not recalculate due to rounding.)
U.S. Q2 FY21 Q2 FY20 Change
Net sales $93.3 $85.2 $8.1 9.5%
Comp sales (ex. fuel)3
9.3% 2.8% NP NP
Transactions -14.0% 0.6% NP NP
Average ticket 27.0% 2.2% NP NP
eCommerce contribution4
~600 bps ~180 bps NP NP
Operating income $5.1 $4.7 $0.4 8.5%
Adjusted operating income1
$5.4 $4.7 $0.8 16.7%
Q2 FY21 Q2 FY20 Change
Net sales $27.2 $29.1 -$2.0 -6.8%
Net sales (constant currency)1
$29.6 $29.1 $0.5 1.6%
Operating income $0.8 $0.9 -$0.1 -9.1%
Operating income (constant currency)1
$0.9 $0.9 $0.0 0.9%
Adjusted operating income (constant currency)1
$1.0 $0.9 $0.1 11.5%
Q2 FY21 Q2 FY20 Change
Net sales $16.4 $15.0 $1.3 8.8%
Comp sales (ex. fuel)3
13.3% 1.2% NP NP
Transactions 8.7% 5.0% NP NP
Average ticket 4.3% -3.8% NP NP
eCommerce contribution4
~190 bps ~190 bps NP NP
Operating income $0.6 $0.5 $0.1 23.3%
1
See additional information at the end of this release regarding non-GAAP financial measures.
2
$5.0 billion remaining of $20 billion authorization approved in October 2017. The company did not repurchase shares during the second quarter of fiscal 2021.
3
Comp sales for the 13-week period ended July 31, 2020 compared to 13-week period ended July 26, 2019, and excludes fuel. See Supplemental Financial Information
for additional information.
4
Beginning in Q1 FY21, we revised our definition of eCommerce net sales to include certain pharmacy transactions. Accordingly, we revised prior period amounts for
Walmart U.S. and Sam’s Club to be consistent with the current year’s presentation.
NP - Not provided
3
NYSE: WMT August 18, 2020 stock.walmart.com
About Walmart
Walmart Inc. (NYSE: WMT) helps people around the world save money and live better - anytime and anywhere - in
retail stores, online, and through their mobile devices. Each week, over 265 million customers and members visit
approximately 11,500 stores under 56 banners in 27 countries and eCommerce websites. With fiscal year 2020
revenue of $524 billion, Walmart employs over 2.2 million associates worldwide. Walmart continues to be a
leader in sustainability, corporate philanthropy and employment opportunity. Additional information about
Walmart can be found by visiting http://corporate.walmart.com, on Facebook at http://facebook.com/walmart
and on Twitter at http://twitter.com/walmart.
Investor Relations contact
Dan Binder, CFA (479) 258-7172
Media Relations contact
Randy Hargrove (800) 331-0085
4
NYSE: WMT August 18, 2020 stock.walmart.com
Forward-Looking Statements
This release and related management commentary contains statements, including statements that relate to our withdrawal of guidance,
that may be"forward-looking statements" as defined in, and are intended to enjoy the protection of the safe harbor for forward-looking
statements within the meaning of Section 21E of the Securities Exchange Act of 1934, as amended. Assumptions on which such forward-
looking statements are based are also forward-looking statements. Our actual results may differ materially from those expressed in or
implied by any of these forward-looking statements as a result of changes in circumstances, assumptions not being realized or other risks,
uncertainties and factors including: the impact of the COVID-19 pandemic on our business and the global economy; economic, capital
markets and business conditions; trends and events around the world and in the markets in which we operate; currency exchange rate
fluctuations, changes in market interest rates and market levels of wages; changes in the size of various markets, including eCommerce
markets; unemployment levels; inflation or deflation, generally and in particular product categories; consumer confidence, disposable
income, credit availability, spending levels, shopping patterns, debt levels and demand for certain merchandise; the effectiveness of the
implementation and operation of our strategies, plans, programs and initiatives; unexpected changes in our objectives and plans; the impact
of acquisitions, investments, divestitures, store or club closures, and other strategic decisions; our ability to successfully integrate acquired
businesses, including within the eCommerce space; changes in the trading prices of certain equity investments we hold; initiatives of
competitors, competitors' entry into and expansion in our markets, and competitive pressures; customer traffic and average ticket in our
stores and clubs and on our eCommerce websites; the mix of merchandise we sell, the cost of goods we sell and the shrinkage we
experience; trends in consumer shopping habits around the world and in the markets in which we operate; our gross profit margins; the
financial performance of Walmart and each of its segments, including the amounts of our cash flow during various periods; changes in the
credit ratings assigned to our commercial paper and debt securities by credit rating agencies; the amount of our net sales and operating
expenses denominated in the U.S. dollar and various foreign currencies; transportation, energy and utility costs; commodity prices and the
price of gasoline and diesel fuel; supply chain disruptions and disruptions in seasonal buying patterns; the availability of goods from
suppliers and the cost of goods acquired from suppliers; consumer acceptance of and response to our stores, clubs, eCommerce platforms,
programs, merchandise offerings and delivery methods; cyber security events affecting us and related costs and impact to the business;
developments in, outcomes of, and costs incurred in legal or regulatory proceedings to which we are a party or are subject, and the
liabilities, obligations and expenses, if any, that we may incur in connection therewith; casualty and accident-related costs and insurance
costs; the turnover in our workforce and labor costs, including healthcare and other benefit costs; consumer enrollment in health and drug
insurance programs and such programs' reimbursement rates and drug formularies; our effective tax rate and the factors affecting our
effective tax rate, including assessments of certain tax contingencies, valuation allowances, changes in law, administrative audit outcomes,
impact of discrete items and the mix of earnings between the U.S. and Walmart's international operations; changes in existing tax, labor and
other laws and regulations and changes in tax rates including the enactment of laws and the adoption and interpretation of administrative
rules and regulations; the imposition of new taxes on imports, new tariffs and changes in existing tariff rates; the imposition of new trade
restrictions and changes in existing trade restrictions; adoption or creation of new, and modification of existing, governmental policies,
programs, initiatives and actions in the markets in which Walmart operates and elsewhere and actions with respect to such policies,
programs and initiatives; changes in accounting estimates or judgments; the level of public assistance payments; natural disasters, changes
in climate, geopolitical events and catastrophic events; and changes in generally accepted accounting principles in the United States.
Our most recent annual report on Form 10-K and subsequent quarterly report on Form 10-Q filed with the SEC discuss other risks and
factors that could cause actual results to differ materially from those expressed or implied by any forward-looking statement in the release
and related management commentary. We urge you to consider all of the risks, uncertainties and factors identified above or discussed in
such reports carefully in evaluating the forward-looking statements in this release. Walmart cannot assure you that the results reflected in or
implied by any forward-looking statement will be realized or, even if substantially realized, that those results will have the forecasted or
expected consequences and effects for or on our operations or financial performance. The forward-looking statements made today are as of
the date of this release. Walmart undertakes no obligation to update these forward-looking statements to reflect subsequent events or
circumstances.
5
Walmart Inc.
Condensed Consolidated Statements of Income
(Unaudited)
Three Months Ended Six Months Ended
July 31, July 31,
(Amounts in millions, except per share data) 2020 2019
Percent
Change 2020 2019
Percent
Change
Revenues:
Net sales $136,824 $129,388 5.7 % $270,496 $252,337 7.2 %
Membership and other income 918 989 (7.2)% 1,868 1,965 (4.9)%
Total revenues 137,742 130,377 5.6 % 272,364 254,302 7.1 %
Costs and expenses:
Cost of sales 102,689 97,923 4.9 % 204,715 190,957 7.2 %
Operating, selling, general and administrative expenses 28,994 26,871 7.9 % 56,366 52,817 6.7 %
Operating income 6,059 5,583 8.5 % 11,283 10,528 7.2 %
Interest:
Debt 577 558 3.4 % 1,087 1,146 (5.1)%
Finance lease obligations 81 83 (2.4)% 163 168 (3.0)%
Interest income (23) (56) (58.9)% (66) (104) (36.5)%
Interest, net 635 585 8.5 % 1,184 1,210 (2.1)%
Other (gains) and losses (3,222) 85 (3,890
.6
)% (3,943) (752) 424.3 %
Income before income taxes 8,646 4,913 76.0 % 14,042 10,070 39.4 %
Provision for income taxes 2,207 1,233 79.0 % 3,529 2,484 42.1 %
Consolidated net income 6,439 3,680 75.0 % 10,513 7,586 38.6 %
Consolidated net (income) loss attributable to noncontrolling interest 37 (70) (152.9)% (47) (134) (64.9)%
Consolidated net income attributable to Walmart $ 6,476 $ 3,610 79.4 % $ 10,466 $ 7,452 40.4 %
Net income per common share:
Basic net income per common share attributable to Walmart $ 2.29 $ 1.27 80.3 % $ 3.70 $ 2.60 42.3 %
Diluted net income per common share attributable to Walmart $ 2.27 $ 1.26 80.2 % $ 3.67 $ 2.59 41.7 %
Weighted-average common shares outstanding:
Basic 2,832 2,853 2,832 2,861
Diluted 2,848 2,869 2,848 2,878
Dividends declared per common share $ — $ — $ 2.16 $ 2.12
6
Walmart Inc.
Condensed Consolidated Balance Sheets
(Unaudited)
July 31, January 31, July 31,
(Amounts in millions) 2020 2020 2019
ASSETS
Current assets:
Cash and cash equivalents $ 16,906 $ 9,465 $ 9,283
Receivables, net 5,111 6,284 5,382
Inventories 41,084 44,435 44,134
Prepaid expenses and other 1,895 1,622 2,572
Total current assets 64,996 61,806 61,371
Property and equipment, net 101,182 105,208 104,674
Operating lease right-of-use assets 16,869 17,424 17,239
Finance lease right-of-use assets, net 4,843 4,417 3,949
Goodwill 29,542 31,073 31,454
Other long-term assets 19,950 16,567 16,174
Total assets $ 237,382 $ 236,495 $ 234,861
LIABILITIES AND EQUITY
Current liabilities:
Short-term borrowings $ 357 $ 575 $ 3,681
Accounts payable 46,326 46,973 45,871
Dividends payable 3,060 — 3,023
Accrued liabilities 23,768 22,296 20,691
Accrued income taxes 610 280 387
Long-term debt due within one year 5,553 5,362 4,396
Operating lease obligations due within one year 1,734 1,793 1,795
Finance lease obligations due within one year 549 511 439
Total current liabilities 81,957 77,790 80,283
Long-term debt 40,959 43,714 44,404
Long-term operating lease obligations 15,669 16,171 16,079
Long-term finance lease obligations 4,673 4,307 3,915
Deferred income taxes and other 12,927 12,961 13,049
Commitments and contingencies
Equity:
Common stock 283 284 285
Capital in excess of par value 3,197 3,247 2,880
Retained earnings 87,614 83,943 78,432
Accumulated other comprehensive loss (15,784) (12,805) (11,270)
Total Walmart shareholders’ equity 75,310 74,669 70,327
Noncontrolling interest 5,887 6,883 6,804
Total equity 81,197 81,552 77,131
Total liabilities and equity $ 237,382 $ 236,495 $ 234,861
7
Walmart Inc.
Condensed Consolidated Statements of Cash Flows
(Unaudited)
Six Months Ended
July 31,
(Amounts in millions) 2020 2019
Cash flows from operating activities:
Consolidated net income $ 10,513 $ 7,586
Adjustments to reconcile consolidated net income to net cash provided by operating activities:
Depreciation and amortization 5,562 5,436
Unrealized (gains) and losses (4,006) (731)
Loss on disposal of business operations 37 —
Deferred income taxes 472 241
Other operating activities 305 348
Changes in certain assets and liabilities, net of effects of acquisitions and dispositions:
Receivables, net 823 978
Inventories 2,466 220
Accounts payable 1,052 (1,242)
Accrued liabilities 1,428 (1,657)
Accrued income taxes 304 6
Net cash provided by operating activities 18,956 11,185
Cash flows from investing activities:
Payments for property and equipment (3,569) (4,871)
Proceeds from the disposal of property and equipment 83 128
Proceeds from disposal of certain operations — 833
Payments for business acquisitions, net of cash acquired (175) (56)
Other investing activities 27 142
Net cash used in investing activities (3,634) (3,824)
Cash flows from financing activities:
Net change in short-term borrowings (178) (1,564)
Proceeds from issuance of long-term debt — 4,020
Repayments of long-term debt (2,937) (407)
Dividends paid (3,058) (3,036)
Purchase of Company stock (723) (3,707)
Dividends paid to noncontrolling interest (66) (259)
Other financing activities (852) (578)
Net cash used in financing activities (7,814) (5,531)
Effect of exchange rates on cash, cash equivalents and restricted cash (69) (266)
Net increase in cash, cash equivalents and restricted cash 7,439 1,564
Cash, cash equivalents and restricted cash at beginning of year 9,515 7,756
Cash, cash equivalents and restricted cash at end of period $ 16,954 $ 9,320
8
Walmart Inc.
Supplemental Financial Information
(Unaudited)
Net sales and operating income
Net Sales Operating Income
Three Months Ended Three Months Ended
July 31, July 31,
(dollars in millions) 2020 2019
Percent
Change 2020 2019
Percent
Change
Walmart U.S. $ 93,282 $ 85,200 9.5% $ 5,057 $ 4,659 8.5%
Walmart International 27,167 29,139 -6.8% 812 893 -9.1%
Sam’s Club 16,375 15,049 8.8% 592 480 23.3%
Corporate and support — — N/A (402) (449) -10.5%
Consolidated $ 136,824 $ 129,388 5.7% $ 6,059 $ 5,583 8.5%
U.S. comparable sales results
With Fuel Without Fuel Fuel Impact
Thirteen Weeks Ended Thirteen Weeks Ended Thirteen Weeks Ended
7/31/2020 7/26/2019 7/31/2020 7/26/2019 7/31/2020 7/26/2019
Walmart U.S. 9.1% 2.8% 9.3% 2.8% -0.2% 0.0%
Sam’s Club 8.7% 1.8% 13.3% 1.2% -4.6% 0.6%
Total U.S. 9.0% 2.6% 9.9% 2.6% -0.9% 0.0%
Comparable sales is a metric that indicates the performance of our existing stores and clubs and it is important to
review in conjunction with the Company’s financial results reported in accordance with GAAP. Comparable sales
excluding fuel is also an important, separate metric that indicates the performance of our existing stores and clubs
without considering fuel, which is volatile and unpredictable. Other companies in our industry may calculate
comparable sales differently, limiting the comparability of the metric.
9
Walmart Inc.
Reconciliations of and Other Information Regarding Non-GAAP Financial Measures
(Unaudited)
The following information provides reconciliations of certain non-GAAP financial measures presented in the press
release to which this reconciliation is attached to the most directly comparable financial measures calculated and
presented in accordance with generally accepted accounting principles (GAAP). The company has provided the
non-GAAP financial information presented in the press release, which is not calculated or presented in accordance
with GAAP, as information supplemental and in addition to the financial measures presented in the press release
that are calculated and presented in accordance with GAAP. Such non-GAAP financial measures should not be
considered superior to, as a substitute for or alternative to, and should be considered in conjunction with, the GAAP
financial measures presented in the press release. The non-GAAP financial measures in the press release may
differ from similar measures used by other companies.
Constant Currency
In discussing our operating results, the term currency exchange rates refers to the currency exchange rates we use
to convert the operating results for countries where the functional currency is not the U.S. dollar into U.S. dollars or
for countries experiencing hyperinflation. We calculate the effect of changes in currency exchange rates as the
difference between current period activity translated using the current period’s currency exchange rates and the
comparable prior year period’s currency exchange rates. Additionally, no currency exchange rate fluctuations are
calculated for non-USD acquisitions until owned for 12 months.
Throughout our discussion, we refer to the results of this calculation as the impact of currency exchange rate
fluctuations. When we refer to constant currency operating results, this means operating results without the impact
of the currency exchange rate fluctuations. The disclosure of constant currency amounts or results permits
investors to better understand Walmart’s underlying performance without the effects of currency exchange rate
fluctuations.
The table below reflects the calculation of constant currency for total revenues, net sales and operating income for
the three and six months ended July 31, 2020.
Three Months Ended July 31, Six Months Ended July 31,
Walmart
International Consolidated
Walmart
International Consolidated
(Dollars in millions) 2020
Percent
Change1
2020
Percent
Change1
2020
Percent
Change1
2020
Percent
Change1
Total revenues:
As reported $ 27,406 -6.9% $ 137,742 5.6% $ 57,458 -1.8% $ 272,364 7.1%
Currency exchange rate fluctuations 2,432 N/A 2,432 N/A 3,727 N/A 3,727 N/A
Constant currency total revenues $ 29,838 1.3% $ 140,174 7.5% $ 61,185 4.6% $ 276,091 8.6%
Net sales:
As reported $ 27,167 -6.8% $ 136,824 5.7% $ 56,933 -1.7% $ 270,496 7.2%
Currency exchange rate fluctuations 2,445 N/A 2,445 N/A 3,699 N/A 3,699 N/A
Constant currency net sales $ 29,612 1.6% $ 139,269 7.6% $ 60,632 4.7% $ 274,195 8.7%
Operating income:
As reported $ 812 -9.1% $ 6,059 8.5% $ 1,618 -0.8% $ 11,283 7.2%
Currency exchange rate fluctuations 89 N/A 89 N/A 136 N/A 136 N/A
Constant currency operating income $ 901 0.9% $ 6,148 10.1% $ 1,754 7.5% $ 11,419 8.5%
1
Change versus prior year comparable period.
10
Adjusted operating income
Adjusted operating income is considered a non-GAAP financial measure under the SEC’s rules because it excludes
certain charges included in operating income calculated in accordance with GAAP. Management believes that
adjusted operating income is a meaningful measure to share with investors because it best allows comparison of
the performance with that of the comparable period. In addition, adjusted operating income affords investors a view
of what management considers Walmart’s core earnings performance and the ability to make a more informed
assessment of such core earnings performance as compared with that of the prior year.
When we refer to adjusted operating income in constant currency this means adjusted operating results without the
impact of the currency exchange rate fluctuations. The disclosure of constant currency amounts or results permits
investors to better understand Walmart’s underlying performance without the effects of currency exchange rate
fluctuations. The tables below reflect the calculation of adjusted operating income and adjusted operating income in
constant currency for the three and six months ended July 31, 2020.
Three Months Ended July 31,
Walmart US Walmart International Consolidated
(Dollars in millions) 2020
Percent
Change1
2020
Percent
Change1
2020
Percent
Change1
Operating income:
Operating income, as reported $ 5,057 8.5% $ 812 (9.1)% $ 6,059 8.5%
Business restructuring charge 380 N/A N/A N/A 380 N/A
Discrete tax item N/A N/A 77 N/A 77 N/A
Adjusted operating income 5,437 16.7% 889 (0.4)% 6,516 16.7%
Currency exchange rate fluctuations N/A N/A 107 N/A 107 N/A
Adjusted operating income, constant currency $ 5,437 16.7% $ 996 11.5 % $ 6,623 18.6%
Six Months Ended July 31,
Walmart US Walmart International Consolidated
(Dollars in millions) 2020
Percent
Change1
2020
Percent
Change1
2020
Percent
Change1
Operating income:
Operating income, as reported $ 9,359 6.3% $ 1,618 (0.8)% $ 11,283 7.2%
Business restructuring charge 380 N/A N/A N/A 380 N/A
Discrete tax item N/A N/A 77 N/A 77 N/A
Adjusted operating income 9,739 10.7% 1,695 3.9 % 11,740 11.6%
Currency exchange rate fluctuations N/A N/A 154 N/A 154 N/A
Adjusted operating income, constant currency $ 9,739 10.7% $ 1,849 13.4 % $ 11,894 13.0%
1
Change versus prior year comparable period.
11
Free Cash Flow
We define free cash flow as net cash provided by operating activities in a period minus payments for property and
equipment made in that period. We had net cash provided by operating activities of $19.0 billion for the six months
ended July 31, 2020, which increased when compared to $11.2 billion for the six months ended July 31, 2019
primarily due to the impact of the global health crisis which accelerated inventory sell-through, as well as the timing
and payment of inventory purchases, incremental COVID-19 related expenses and certain benefit payments. We
generated free cash flow of $15.4 billion for the six months ended July 31, 2020, which increased when compared
to $6.3 billion for the six months ended July 31, 2019 due to the same reasons as the increase in net cash provided
by operating activities, as well as $1.3 billion in decreased capital expenditures due to impacts from the COVID-19
pandemic which impacted the timing of store remodeling and front-end technology transformation activities in
Walmart U.S.
Free cash flow is considered a non-GAAP financial measure. Management believes, however, that free cash flow,
which measures our ability to generate additional cash from our business operations, is an important financial
measure for use in evaluating the company’s financial performance. Free cash flow should be considered in
addition to, rather than as a substitute for, consolidated net income as a measure of our performance and net cash
provided by operating activities as a measure of our liquidity.
Additionally, Walmart’s definition of free cash flow is limited, in that it does not represent residual cash flows
available for discretionary expenditures, due to the fact that the measure does not deduct the payments required for
debt service and other contractual obligations or payments made for business acquisitions. Therefore, we believe it
is important to view free cash flow as a measure that provides supplemental information to our Consolidated
Statements of Cash Flows.
Although other companies report their free cash flow, numerous methods may exist for calculating a company’s free
cash flow. As a result, the method used by Walmart’s management to calculate our free cash flow may differ from
the methods used by other companies to calculate their free cash flow.
The following table sets forth a reconciliation of free cash flow, a non-GAAP financial measure, to net cash provided
by operating activities, which we believe to be the GAAP financial measure most directly comparable to free cash
flow, as well as information regarding net cash used in investing activities and net cash used in financing activities.
Six Months Ended
July 31,
(Dollars in millions) 2020 2019
Net cash provided by operating activities $ 18,956 $ 11,185
Payments for property and equipment (capital expenditures) (3,569) (4,871)
Free cash flow $ 15,387 $ 6,314
Net cash used in investing activities1
$ (3,634) $ (3,824)
Net cash used in financing activities (7,814) (5,531)
1
“Net cash used in investing activities” includes payments for property and equipment, which is also included in our computation of free cash
flow.
12
Adjusted EPS
Adjusted diluted earnings per share attributable to Walmart (Adjusted EPS) is considered a non-GAAP financial
measure under the SEC’s rules because it excludes certain amounts included in the diluted earnings per share
attributable to Walmart calculated in accordance with GAAP (EPS), the most directly comparable financial measure
calculated in accordance with GAAP. Management believes that Adjusted EPS is a meaningful measure to share
with investors because it best allows comparison of the performance with that of the comparable period. In
addition, Adjusted EPS affords investors a view of what management considers Walmart’s core earnings
performance and the ability to make a more informed assessment of such core earnings performance with that of
the prior year.
We adjust for the unrealized gains and losses on our equity investments (primarily JD.com) each quarter because
although the investments are strategic decisions for the Company’s retail operations, management’s measurement
of each strategy is primarily focused on the respective market’s operational results rather than the fair value of such
investments. Additionally, management does not forecast changes in the fair value of its equity investments.
Accordingly, management adjusts EPS each quarter for the unrealized gains and losses related to those equity
investments.
We have calculated Adjusted EPS for the three and six months ended July 31, 2020 by adjusting EPS for the
following: (1) unrealized gains and losses on the company’s equity investments; (2) a discrete tax item; and (3) a
business restructuring charge resulting from changes to corporate support teams to better support the Walmart U.S.
omnichannel strategy.
Three Months Ended July 31, 2020
Diluted earnings per share:
Reported EPS $ 2.27
Adjustments:
Pre-Tax
Impact
Tax
Impact1, 2
NCI
Impact3
Net
Impact
Unrealized (gains) and losses on equity investments $ (1.13) $ 0.24 $ — $ (0.89)
Business restructuring charge 0.13 (0.03) — 0.10
Discrete tax item 0.06 0.05 (0.03) 0.08
Net adjustments $ (0.71)
Adjusted EPS $ 1.56
Six Months Ended July 31, 20204
Diluted earnings per share:
Reported EPS $ 3.67
Adjustments:
Pre-Tax
Impact
Tax
Impact1,2
NCI
Impact3
Net
Impact
Unrealized (gains) and losses on equity investments $ (1.41) $ 0.30 $ — $ (1.11)
Business restructuring charge 0.13 (0.03) — 0.10
Discrete tax item 0.06 0.05 (0.03) 0.08
Net adjustments $ (0.93)
Adjusted EPS $ 2.74
1
Calculated based on nature of item, including any realizable deductions, and statutory rate in effect for relevant jurisdictions.
2
The reported effective tax rate was 25.5% and 25.1% for the three and six months ended July 31, 2020, respectively. When adjusted for the
above items, the effective tax rate was 24.8% and 24.9% for the three and six months ended July 31, 2020, respectively.
3
Calculated based on the ownership percentages of our noncontrolling interests.
4
Quarterly adjustments or adjusted EPS may not sum to YTD adjustments or YTD adjusted EPS due to rounding.
13
As previously disclosed in our second quarter ended July 31, 2019 press release, we have calculated Adjusted EPS
for the three and six months ended July 31, 2019 by adjusting EPS for the unrealized gains and losses on our
JD.com investment.
Three Months Ended July 31, 2019
Diluted earnings per share:
Reported EPS $ 1.26
Adjustments:
Pre-Tax
Impact
Tax
Impact1
Net
Impact
Unrealized (gains) and losses on JD.com investment $ 0.02 $ (0.01) $ 0.01
Adjusted EPS $ 1.27
Six Months Ended July 31, 2019
Diluted earnings per share:
Reported EPS $ 2.59
Adjustments:
Pre-Tax
Impact
Tax
Impact1
Net
Impact
Unrealized (gains) and losses on JD.com investment $ (0.25) $ 0.06 $ (0.19)
Adjusted EPS $ 2.40
1
Calculated based on nature of item, including any realizable deductions, and statutory rate in effect for relevant jurisdictions.

More Related Content

What's hot

Wal Mart Store Financial ResultsFebruary 03/07/08
Wal Mart Store Financial ResultsFebruary 	03/07/08Wal Mart Store Financial ResultsFebruary 	03/07/08
Wal Mart Store Financial ResultsFebruary 03/07/08finance1
 
williams 3Q 2008
williams 3Q 2008williams 3Q 2008
williams 3Q 2008finance21
 
P&G Reports Strong Sales and EPS Growth -- Increases Fiscal Year Outlook
P&G Reports Strong Sales and EPS Growth -- Increases Fiscal Year Outlook P&G Reports Strong Sales and EPS Growth -- Increases Fiscal Year Outlook
P&G Reports Strong Sales and EPS Growth -- Increases Fiscal Year Outlook finance3
 
P&G Delivers Double-Digit Sales Growth in First Quarter
P&G Delivers Double-Digit Sales Growth in First QuarterP&G Delivers Double-Digit Sales Growth in First Quarter
P&G Delivers Double-Digit Sales Growth in First Quarterfinance3
 
P&G Reports 8% Net Sales and 22% EPS Growth in the Fourth Quarter
P&G Reports 8% Net Sales and 22% EPS Growth in the Fourth Quarter P&G Reports 8% Net Sales and 22% EPS Growth in the Fourth Quarter
P&G Reports 8% Net Sales and 22% EPS Growth in the Fourth Quarter finance3
 
P&G Delivers Second Quarter EPS and Organic Sales in Line with Expectations
P&G Delivers Second Quarter EPS and Organic Sales in Line with Expectations P&G Delivers Second Quarter EPS and Organic Sales in Line with Expectations
P&G Delivers Second Quarter EPS and Organic Sales in Line with Expectations finance3
 
P&G Reports First Quarter EPS of $1.03 Up 12% on 9% Sales Growth
P&G Reports First Quarter EPS of $1.03 Up 12% on 9% Sales GrowthP&G Reports First Quarter EPS of $1.03 Up 12% on 9% Sales Growth
P&G Reports First Quarter EPS of $1.03 Up 12% on 9% Sales Growthfinance3
 
P&G Reports EPS of $0.92, up 16% Behind 8% Sales Growth
P&G Reports EPS of $0.92, up 16% Behind 8% Sales Growth P&G Reports EPS of $0.92, up 16% Behind 8% Sales Growth
P&G Reports EPS of $0.92, up 16% Behind 8% Sales Growth finance3
 
P&G Reports Fourth Quarter EPS of $0.92 and Operating Profit Growth of 13%, b...
P&G Reports Fourth Quarter EPS of $0.92 and Operating Profit Growth of 13%, b...P&G Reports Fourth Quarter EPS of $0.92 and Operating Profit Growth of 13%, b...
P&G Reports Fourth Quarter EPS of $0.92 and Operating Profit Growth of 13%, b...finance3
 
I-Byte Retail and consumer goods Industry
I-Byte Retail and consumer goods IndustryI-Byte Retail and consumer goods Industry
I-Byte Retail and consumer goods IndustryEGBG Services
 
williams 1Q 2008
williams 1Q 2008williams 1Q 2008
williams 1Q 2008finance21
 
P&G Beats First Quarter Earnings Expectations on Record Volume and Sales
P&G Beats First Quarter Earnings Expectations on Record Volume and SalesP&G Beats First Quarter Earnings Expectations on Record Volume and Sales
P&G Beats First Quarter Earnings Expectations on Record Volume and Salesfinance3
 
P&G Delivers at Top End of Increased Earnings Expectations
P&G Delivers at Top End of Increased Earnings ExpectationsP&G Delivers at Top End of Increased Earnings Expectations
P&G Delivers at Top End of Increased Earnings Expectationsfinance3
 
P&G Reports Strong Sales and Earnings Growth, Increases Fiscal Year Outlook
P&G Reports Strong Sales and Earnings Growth, Increases Fiscal Year Outlook P&G Reports Strong Sales and Earnings Growth, Increases Fiscal Year Outlook
P&G Reports Strong Sales and Earnings Growth, Increases Fiscal Year Outlook finance3
 
3m Transcript 2006 1st
3m Transcript 2006 1st3m Transcript 2006 1st
3m Transcript 2006 1stfinance10
 
Procter & Gamble Earnings Per Share Increase 16 Percent For Quarter
Procter & Gamble Earnings Per Share Increase 16 Percent For QuarterProcter & Gamble Earnings Per Share Increase 16 Percent For Quarter
Procter & Gamble Earnings Per Share Increase 16 Percent For Quarterfinance3
 
P&G Delivers 15% EPS Growth - Raises Fiscal Year Guidance
P&G Delivers 15% EPS Growth - Raises Fiscal Year GuidanceP&G Delivers 15% EPS Growth - Raises Fiscal Year Guidance
P&G Delivers 15% EPS Growth - Raises Fiscal Year Guidancefinance3
 

What's hot (19)

Wal Mart Store Financial ResultsFebruary 03/07/08
Wal Mart Store Financial ResultsFebruary 	03/07/08Wal Mart Store Financial ResultsFebruary 	03/07/08
Wal Mart Store Financial ResultsFebruary 03/07/08
 
williams 3Q 2008
williams 3Q 2008williams 3Q 2008
williams 3Q 2008
 
P&G Reports Strong Sales and EPS Growth -- Increases Fiscal Year Outlook
P&G Reports Strong Sales and EPS Growth -- Increases Fiscal Year Outlook P&G Reports Strong Sales and EPS Growth -- Increases Fiscal Year Outlook
P&G Reports Strong Sales and EPS Growth -- Increases Fiscal Year Outlook
 
P&G Delivers Double-Digit Sales Growth in First Quarter
P&G Delivers Double-Digit Sales Growth in First QuarterP&G Delivers Double-Digit Sales Growth in First Quarter
P&G Delivers Double-Digit Sales Growth in First Quarter
 
P&G Reports 8% Net Sales and 22% EPS Growth in the Fourth Quarter
P&G Reports 8% Net Sales and 22% EPS Growth in the Fourth Quarter P&G Reports 8% Net Sales and 22% EPS Growth in the Fourth Quarter
P&G Reports 8% Net Sales and 22% EPS Growth in the Fourth Quarter
 
P&G Delivers Second Quarter EPS and Organic Sales in Line with Expectations
P&G Delivers Second Quarter EPS and Organic Sales in Line with Expectations P&G Delivers Second Quarter EPS and Organic Sales in Line with Expectations
P&G Delivers Second Quarter EPS and Organic Sales in Line with Expectations
 
P&G Reports First Quarter EPS of $1.03 Up 12% on 9% Sales Growth
P&G Reports First Quarter EPS of $1.03 Up 12% on 9% Sales GrowthP&G Reports First Quarter EPS of $1.03 Up 12% on 9% Sales Growth
P&G Reports First Quarter EPS of $1.03 Up 12% on 9% Sales Growth
 
P&G Reports EPS of $0.92, up 16% Behind 8% Sales Growth
P&G Reports EPS of $0.92, up 16% Behind 8% Sales Growth P&G Reports EPS of $0.92, up 16% Behind 8% Sales Growth
P&G Reports EPS of $0.92, up 16% Behind 8% Sales Growth
 
P&G Reports Fourth Quarter EPS of $0.92 and Operating Profit Growth of 13%, b...
P&G Reports Fourth Quarter EPS of $0.92 and Operating Profit Growth of 13%, b...P&G Reports Fourth Quarter EPS of $0.92 and Operating Profit Growth of 13%, b...
P&G Reports Fourth Quarter EPS of $0.92 and Operating Profit Growth of 13%, b...
 
I-Byte Retail and consumer goods Industry
I-Byte Retail and consumer goods IndustryI-Byte Retail and consumer goods Industry
I-Byte Retail and consumer goods Industry
 
williams 1Q 2008
williams 1Q 2008williams 1Q 2008
williams 1Q 2008
 
P&G Beats First Quarter Earnings Expectations on Record Volume and Sales
P&G Beats First Quarter Earnings Expectations on Record Volume and SalesP&G Beats First Quarter Earnings Expectations on Record Volume and Sales
P&G Beats First Quarter Earnings Expectations on Record Volume and Sales
 
Q1 2009 Earning Report of Tupperware Corp.
Q1 2009 Earning Report of Tupperware Corp.Q1 2009 Earning Report of Tupperware Corp.
Q1 2009 Earning Report of Tupperware Corp.
 
yum analyst
yum analystyum analyst
yum analyst
 
P&G Delivers at Top End of Increased Earnings Expectations
P&G Delivers at Top End of Increased Earnings ExpectationsP&G Delivers at Top End of Increased Earnings Expectations
P&G Delivers at Top End of Increased Earnings Expectations
 
P&G Reports Strong Sales and Earnings Growth, Increases Fiscal Year Outlook
P&G Reports Strong Sales and Earnings Growth, Increases Fiscal Year Outlook P&G Reports Strong Sales and Earnings Growth, Increases Fiscal Year Outlook
P&G Reports Strong Sales and Earnings Growth, Increases Fiscal Year Outlook
 
3m Transcript 2006 1st
3m Transcript 2006 1st3m Transcript 2006 1st
3m Transcript 2006 1st
 
Procter & Gamble Earnings Per Share Increase 16 Percent For Quarter
Procter & Gamble Earnings Per Share Increase 16 Percent For QuarterProcter & Gamble Earnings Per Share Increase 16 Percent For Quarter
Procter & Gamble Earnings Per Share Increase 16 Percent For Quarter
 
P&G Delivers 15% EPS Growth - Raises Fiscal Year Guidance
P&G Delivers 15% EPS Growth - Raises Fiscal Year GuidanceP&G Delivers 15% EPS Growth - Raises Fiscal Year Guidance
P&G Delivers 15% EPS Growth - Raises Fiscal Year Guidance
 

Similar to Walmart Q2 Earnings Report Shows Strong Sales Growth

Q1 FY20 Earnings Release
Q1 FY20 Earnings ReleaseQ1 FY20 Earnings Release
Q1 FY20 Earnings ReleaseWalmart
 
Evine earnings presentation f18 q2
Evine earnings presentation f18 q2Evine earnings presentation f18 q2
Evine earnings presentation f18 q2evine2015
 
Q4 2013 conf call slides final
Q4 2013 conf call slides finalQ4 2013 conf call slides final
Q4 2013 conf call slides finalUnited_Stationers
 
Evine earnings presentation f18 q3
Evine earnings presentation f18 q3Evine earnings presentation f18 q3
Evine earnings presentation f18 q3evine2015
 
Evine earnings presentation f18 q1 final
Evine earnings presentation f18 q1 finalEvine earnings presentation f18 q1 final
Evine earnings presentation f18 q1 finalevine2015
 
Visa inc. Q2 2015 financial results conference call presentation
Visa inc. Q2 2015 financial results conference call presentationVisa inc. Q2 2015 financial results conference call presentation
Visa inc. Q2 2015 financial results conference call presentationvisainc
 
Aug 1 2018 q earnings 073118 w waldo compressed
Aug 1 2018   q earnings 073118 w waldo compressedAug 1 2018   q earnings 073118 w waldo compressed
Aug 1 2018 q earnings 073118 w waldo compressedmolsoncoorsir
 
Q4 2020 Earnings Presentation
Q4 2020 Earnings PresentationQ4 2020 Earnings Presentation
Q4 2020 Earnings PresentationQTSDataCenters
 
QTS Q4 2020 Earnings Presentation
QTS Q4 2020 Earnings PresentationQTS Q4 2020 Earnings Presentation
QTS Q4 2020 Earnings PresentationKelly Michael
 
REITWeek 2015
REITWeek 2015REITWeek 2015
REITWeek 2015IronMInc
 
Du pont 4q15 slides final
Du pont 4q15 slides finalDu pont 4q15 slides final
Du pont 4q15 slides finalDupontInv
 
Visa inc. Q3 2014 Financial Results Presentation
Visa inc. Q3 2014 Financial Results PresentationVisa inc. Q3 2014 Financial Results Presentation
Visa inc. Q3 2014 Financial Results Presentationvisainc
 
2Q18 Corporate Presentation
2Q18 Corporate Presentation2Q18 Corporate Presentation
2Q18 Corporate PresentationBBVA
 
Q4 fy17 earnings presentation v f
Q4 fy17 earnings presentation v fQ4 fy17 earnings presentation v f
Q4 fy17 earnings presentation v fir_westrock
 
20180509 sauc q1 2018 teleconference slides final
20180509 sauc q1 2018 teleconference slides final20180509 sauc q1 2018 teleconference slides final
20180509 sauc q1 2018 teleconference slides finaldrhincorporated
 
citigroup October 15, 2002 - Third Quarter Press Release
citigroup October 15, 2002 - Third Quarter Press Releasecitigroup October 15, 2002 - Third Quarter Press Release
citigroup October 15, 2002 - Third Quarter Press ReleaseQuarterlyEarningsReports
 
citigroup Financial Supplement July 2, 2008
citigroup Financial Supplement July 2, 2008citigroup Financial Supplement July 2, 2008
citigroup Financial Supplement July 2, 2008QuarterlyEarningsReports
 

Similar to Walmart Q2 Earnings Report Shows Strong Sales Growth (20)

Q1 FY20 Earnings Release
Q1 FY20 Earnings ReleaseQ1 FY20 Earnings Release
Q1 FY20 Earnings Release
 
Evine earnings presentation f18 q2
Evine earnings presentation f18 q2Evine earnings presentation f18 q2
Evine earnings presentation f18 q2
 
Q4 2013 conf call slides final
Q4 2013 conf call slides finalQ4 2013 conf call slides final
Q4 2013 conf call slides final
 
Q3 2013 Presentation
Q3 2013 PresentationQ3 2013 Presentation
Q3 2013 Presentation
 
Evine earnings presentation f18 q3
Evine earnings presentation f18 q3Evine earnings presentation f18 q3
Evine earnings presentation f18 q3
 
Evine earnings presentation f18 q1 final
Evine earnings presentation f18 q1 finalEvine earnings presentation f18 q1 final
Evine earnings presentation f18 q1 final
 
Visa inc. Q2 2015 financial results conference call presentation
Visa inc. Q2 2015 financial results conference call presentationVisa inc. Q2 2015 financial results conference call presentation
Visa inc. Q2 2015 financial results conference call presentation
 
Aug 1 2018 q earnings 073118 w waldo compressed
Aug 1 2018   q earnings 073118 w waldo compressedAug 1 2018   q earnings 073118 w waldo compressed
Aug 1 2018 q earnings 073118 w waldo compressed
 
Q4 2020 Earnings Presentation
Q4 2020 Earnings PresentationQ4 2020 Earnings Presentation
Q4 2020 Earnings Presentation
 
QTS Q4 2020 Earnings Presentation
QTS Q4 2020 Earnings PresentationQTS Q4 2020 Earnings Presentation
QTS Q4 2020 Earnings Presentation
 
REITWeek 2015
REITWeek 2015REITWeek 2015
REITWeek 2015
 
Du pont 4q15 slides final
Du pont 4q15 slides finalDu pont 4q15 slides final
Du pont 4q15 slides final
 
Sysco 2q 2018
Sysco 2q 2018Sysco 2q 2018
Sysco 2q 2018
 
Visa inc. Q3 2014 Financial Results Presentation
Visa inc. Q3 2014 Financial Results PresentationVisa inc. Q3 2014 Financial Results Presentation
Visa inc. Q3 2014 Financial Results Presentation
 
2Q18 Corporate Presentation
2Q18 Corporate Presentation2Q18 Corporate Presentation
2Q18 Corporate Presentation
 
Q4 fy17 earnings presentation v f
Q4 fy17 earnings presentation v fQ4 fy17 earnings presentation v f
Q4 fy17 earnings presentation v f
 
20180509 sauc q1 2018 teleconference slides final
20180509 sauc q1 2018 teleconference slides final20180509 sauc q1 2018 teleconference slides final
20180509 sauc q1 2018 teleconference slides final
 
citigroup October 15, 2002 - Third Quarter Press Release
citigroup October 15, 2002 - Third Quarter Press Releasecitigroup October 15, 2002 - Third Quarter Press Release
citigroup October 15, 2002 - Third Quarter Press Release
 
citigroup Financial Supplement July 2, 2008
citigroup Financial Supplement July 2, 2008citigroup Financial Supplement July 2, 2008
citigroup Financial Supplement July 2, 2008
 
STZ Investor Overview: Q1 FY19
STZ Investor Overview: Q1 FY19 STZ Investor Overview: Q1 FY19
STZ Investor Overview: Q1 FY19
 

Recently uploaded

Sales & Marketing Alignment: How to Synergize for Success
Sales & Marketing Alignment: How to Synergize for SuccessSales & Marketing Alignment: How to Synergize for Success
Sales & Marketing Alignment: How to Synergize for SuccessAggregage
 
Case study on tata clothing brand zudio in detail
Case study on tata clothing brand zudio in detailCase study on tata clothing brand zudio in detail
Case study on tata clothing brand zudio in detailAriel592675
 
BEST Call Girls In Greater Noida ✨ 9773824855 ✨ Escorts Service In Delhi Ncr,
BEST Call Girls In Greater Noida ✨ 9773824855 ✨ Escorts Service In Delhi Ncr,BEST Call Girls In Greater Noida ✨ 9773824855 ✨ Escorts Service In Delhi Ncr,
BEST Call Girls In Greater Noida ✨ 9773824855 ✨ Escorts Service In Delhi Ncr,noida100girls
 
2024 Numerator Consumer Study of Cannabis Usage
2024 Numerator Consumer Study of Cannabis Usage2024 Numerator Consumer Study of Cannabis Usage
2024 Numerator Consumer Study of Cannabis UsageNeil Kimberley
 
(8264348440) 🔝 Call Girls In Keshav Puram 🔝 Delhi NCR
(8264348440) 🔝 Call Girls In Keshav Puram 🔝 Delhi NCR(8264348440) 🔝 Call Girls In Keshav Puram 🔝 Delhi NCR
(8264348440) 🔝 Call Girls In Keshav Puram 🔝 Delhi NCRsoniya singh
 
Call Girls in Mehrauli Delhi 💯Call Us 🔝8264348440🔝
Call Girls in Mehrauli Delhi 💯Call Us 🔝8264348440🔝Call Girls in Mehrauli Delhi 💯Call Us 🔝8264348440🔝
Call Girls in Mehrauli Delhi 💯Call Us 🔝8264348440🔝soniya singh
 
Lean: From Theory to Practice — One City’s (and Library’s) Lean Story… Abridged
Lean: From Theory to Practice — One City’s (and Library’s) Lean Story… AbridgedLean: From Theory to Practice — One City’s (and Library’s) Lean Story… Abridged
Lean: From Theory to Practice — One City’s (and Library’s) Lean Story… AbridgedKaiNexus
 
Lowrate Call Girls In Sector 18 Noida ❤️8860477959 Escorts 100% Genuine Servi...
Lowrate Call Girls In Sector 18 Noida ❤️8860477959 Escorts 100% Genuine Servi...Lowrate Call Girls In Sector 18 Noida ❤️8860477959 Escorts 100% Genuine Servi...
Lowrate Call Girls In Sector 18 Noida ❤️8860477959 Escorts 100% Genuine Servi...lizamodels9
 
Keppel Ltd. 1Q 2024 Business Update Presentation Slides
Keppel Ltd. 1Q 2024 Business Update  Presentation SlidesKeppel Ltd. 1Q 2024 Business Update  Presentation Slides
Keppel Ltd. 1Q 2024 Business Update Presentation SlidesKeppelCorporation
 
Pitch Deck Teardown: NOQX's $200k Pre-seed deck
Pitch Deck Teardown: NOQX's $200k Pre-seed deckPitch Deck Teardown: NOQX's $200k Pre-seed deck
Pitch Deck Teardown: NOQX's $200k Pre-seed deckHajeJanKamps
 
A.I. Bot Summit 3 Opening Keynote - Perry Belcher
A.I. Bot Summit 3 Opening Keynote - Perry BelcherA.I. Bot Summit 3 Opening Keynote - Perry Belcher
A.I. Bot Summit 3 Opening Keynote - Perry BelcherPerry Belcher
 
Catalogue ONG NƯỚC uPVC - HDPE DE NHAT.pdf
Catalogue ONG NƯỚC uPVC - HDPE DE NHAT.pdfCatalogue ONG NƯỚC uPVC - HDPE DE NHAT.pdf
Catalogue ONG NƯỚC uPVC - HDPE DE NHAT.pdfOrient Homes
 
Non Text Magic Studio Magic Design for Presentations L&P.pptx
Non Text Magic Studio Magic Design for Presentations L&P.pptxNon Text Magic Studio Magic Design for Presentations L&P.pptx
Non Text Magic Studio Magic Design for Presentations L&P.pptxAbhayThakur200703
 
Islamabad Escorts | Call 03274100048 | Escort Service in Islamabad
Islamabad Escorts | Call 03274100048 | Escort Service in IslamabadIslamabad Escorts | Call 03274100048 | Escort Service in Islamabad
Islamabad Escorts | Call 03274100048 | Escort Service in IslamabadAyesha Khan
 
Investment analysis and portfolio management
Investment analysis and portfolio managementInvestment analysis and portfolio management
Investment analysis and portfolio managementJunaidKhan750825
 
RE Capital's Visionary Leadership under Newman Leech
RE Capital's Visionary Leadership under Newman LeechRE Capital's Visionary Leadership under Newman Leech
RE Capital's Visionary Leadership under Newman LeechNewman George Leech
 
Cash Payment 9602870969 Escort Service in Udaipur Call Girls
Cash Payment 9602870969 Escort Service in Udaipur Call GirlsCash Payment 9602870969 Escort Service in Udaipur Call Girls
Cash Payment 9602870969 Escort Service in Udaipur Call GirlsApsara Of India
 
Call Girls In ⇛⇛Chhatarpur⇚⇚. Brings Offer Delhi Contact Us 8377877756
Call Girls In ⇛⇛Chhatarpur⇚⇚. Brings Offer Delhi Contact Us 8377877756Call Girls In ⇛⇛Chhatarpur⇚⇚. Brings Offer Delhi Contact Us 8377877756
Call Girls In ⇛⇛Chhatarpur⇚⇚. Brings Offer Delhi Contact Us 8377877756dollysharma2066
 
Call Girls In Sikandarpur Gurgaon ❤️8860477959_Russian 100% Genuine Escorts I...
Call Girls In Sikandarpur Gurgaon ❤️8860477959_Russian 100% Genuine Escorts I...Call Girls In Sikandarpur Gurgaon ❤️8860477959_Russian 100% Genuine Escorts I...
Call Girls In Sikandarpur Gurgaon ❤️8860477959_Russian 100% Genuine Escorts I...lizamodels9
 

Recently uploaded (20)

Sales & Marketing Alignment: How to Synergize for Success
Sales & Marketing Alignment: How to Synergize for SuccessSales & Marketing Alignment: How to Synergize for Success
Sales & Marketing Alignment: How to Synergize for Success
 
Case study on tata clothing brand zudio in detail
Case study on tata clothing brand zudio in detailCase study on tata clothing brand zudio in detail
Case study on tata clothing brand zudio in detail
 
BEST Call Girls In Greater Noida ✨ 9773824855 ✨ Escorts Service In Delhi Ncr,
BEST Call Girls In Greater Noida ✨ 9773824855 ✨ Escorts Service In Delhi Ncr,BEST Call Girls In Greater Noida ✨ 9773824855 ✨ Escorts Service In Delhi Ncr,
BEST Call Girls In Greater Noida ✨ 9773824855 ✨ Escorts Service In Delhi Ncr,
 
2024 Numerator Consumer Study of Cannabis Usage
2024 Numerator Consumer Study of Cannabis Usage2024 Numerator Consumer Study of Cannabis Usage
2024 Numerator Consumer Study of Cannabis Usage
 
(8264348440) 🔝 Call Girls In Keshav Puram 🔝 Delhi NCR
(8264348440) 🔝 Call Girls In Keshav Puram 🔝 Delhi NCR(8264348440) 🔝 Call Girls In Keshav Puram 🔝 Delhi NCR
(8264348440) 🔝 Call Girls In Keshav Puram 🔝 Delhi NCR
 
Call Girls in Mehrauli Delhi 💯Call Us 🔝8264348440🔝
Call Girls in Mehrauli Delhi 💯Call Us 🔝8264348440🔝Call Girls in Mehrauli Delhi 💯Call Us 🔝8264348440🔝
Call Girls in Mehrauli Delhi 💯Call Us 🔝8264348440🔝
 
Lean: From Theory to Practice — One City’s (and Library’s) Lean Story… Abridged
Lean: From Theory to Practice — One City’s (and Library’s) Lean Story… AbridgedLean: From Theory to Practice — One City’s (and Library’s) Lean Story… Abridged
Lean: From Theory to Practice — One City’s (and Library’s) Lean Story… Abridged
 
Lowrate Call Girls In Sector 18 Noida ❤️8860477959 Escorts 100% Genuine Servi...
Lowrate Call Girls In Sector 18 Noida ❤️8860477959 Escorts 100% Genuine Servi...Lowrate Call Girls In Sector 18 Noida ❤️8860477959 Escorts 100% Genuine Servi...
Lowrate Call Girls In Sector 18 Noida ❤️8860477959 Escorts 100% Genuine Servi...
 
Keppel Ltd. 1Q 2024 Business Update Presentation Slides
Keppel Ltd. 1Q 2024 Business Update  Presentation SlidesKeppel Ltd. 1Q 2024 Business Update  Presentation Slides
Keppel Ltd. 1Q 2024 Business Update Presentation Slides
 
Pitch Deck Teardown: NOQX's $200k Pre-seed deck
Pitch Deck Teardown: NOQX's $200k Pre-seed deckPitch Deck Teardown: NOQX's $200k Pre-seed deck
Pitch Deck Teardown: NOQX's $200k Pre-seed deck
 
A.I. Bot Summit 3 Opening Keynote - Perry Belcher
A.I. Bot Summit 3 Opening Keynote - Perry BelcherA.I. Bot Summit 3 Opening Keynote - Perry Belcher
A.I. Bot Summit 3 Opening Keynote - Perry Belcher
 
Catalogue ONG NƯỚC uPVC - HDPE DE NHAT.pdf
Catalogue ONG NƯỚC uPVC - HDPE DE NHAT.pdfCatalogue ONG NƯỚC uPVC - HDPE DE NHAT.pdf
Catalogue ONG NƯỚC uPVC - HDPE DE NHAT.pdf
 
Non Text Magic Studio Magic Design for Presentations L&P.pptx
Non Text Magic Studio Magic Design for Presentations L&P.pptxNon Text Magic Studio Magic Design for Presentations L&P.pptx
Non Text Magic Studio Magic Design for Presentations L&P.pptx
 
Islamabad Escorts | Call 03274100048 | Escort Service in Islamabad
Islamabad Escorts | Call 03274100048 | Escort Service in IslamabadIslamabad Escorts | Call 03274100048 | Escort Service in Islamabad
Islamabad Escorts | Call 03274100048 | Escort Service in Islamabad
 
Investment analysis and portfolio management
Investment analysis and portfolio managementInvestment analysis and portfolio management
Investment analysis and portfolio management
 
RE Capital's Visionary Leadership under Newman Leech
RE Capital's Visionary Leadership under Newman LeechRE Capital's Visionary Leadership under Newman Leech
RE Capital's Visionary Leadership under Newman Leech
 
Cash Payment 9602870969 Escort Service in Udaipur Call Girls
Cash Payment 9602870969 Escort Service in Udaipur Call GirlsCash Payment 9602870969 Escort Service in Udaipur Call Girls
Cash Payment 9602870969 Escort Service in Udaipur Call Girls
 
Call Girls In ⇛⇛Chhatarpur⇚⇚. Brings Offer Delhi Contact Us 8377877756
Call Girls In ⇛⇛Chhatarpur⇚⇚. Brings Offer Delhi Contact Us 8377877756Call Girls In ⇛⇛Chhatarpur⇚⇚. Brings Offer Delhi Contact Us 8377877756
Call Girls In ⇛⇛Chhatarpur⇚⇚. Brings Offer Delhi Contact Us 8377877756
 
Enjoy ➥8448380779▻ Call Girls In Sector 18 Noida Escorts Delhi NCR
Enjoy ➥8448380779▻ Call Girls In Sector 18 Noida Escorts Delhi NCREnjoy ➥8448380779▻ Call Girls In Sector 18 Noida Escorts Delhi NCR
Enjoy ➥8448380779▻ Call Girls In Sector 18 Noida Escorts Delhi NCR
 
Call Girls In Sikandarpur Gurgaon ❤️8860477959_Russian 100% Genuine Escorts I...
Call Girls In Sikandarpur Gurgaon ❤️8860477959_Russian 100% Genuine Escorts I...Call Girls In Sikandarpur Gurgaon ❤️8860477959_Russian 100% Genuine Escorts I...
Call Girls In Sikandarpur Gurgaon ❤️8860477959_Russian 100% Genuine Escorts I...
 

Walmart Q2 Earnings Report Shows Strong Sales Growth

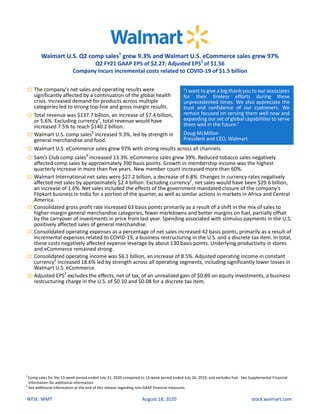
  • 1. NYSE: WMT August 18, 2020 stock.walmart.com Walmart U.S. Q2 comp sales1 grew 9.3% and Walmart U.S. eCommerce sales grew 97% Q2 FY21 GAAP EPS of $2.27; Adjusted EPS2 of $1.56 Company incurs incremental costs related to COVID-19 of $1.5 billion The company’s net sales and operating results were significantly affected by a continuation of the global health crisis. Increased demand for products across multiple categories led to strong top-line and gross margin results. “I want to give a big thank you to our associates for their tireless efforts during these unprecedented times. We also appreciate the trust and confidence of our customers. We remain focused on serving them well now and expanding our set of global capabilities to serve them well in the future.” Doug McMillon President and CEO, Walmart Total revenue was $137.7 billion, an increase of $7.4 billion, or 5.6%. Excluding currency2 , total revenue would have increased 7.5% to reach $140.2 billion. Walmart U.S. comp sales1 increased 9.3%, led by strength in general merchandise and food. Walmart U.S. eCommerce sales grew 97% with strong results across all channels. Sam’s Club comp sales1 increased 13.3%. eCommerce sales grew 39%. Reduced tobacco sales negatively affected comp sales by approximately 390 basis points. Growth in membership income was the highest quarterly increase in more than five years. New member count increased more than 60%. Walmart International net sales were $27.2 billion, a decrease of 6.8%. Changes in currency rates negatively affected net sales by approximately $2.4 billion. Excluding currency2 , net sales would have been $29.6 billion, an increase of 1.6%. Net sales included the effects of the government-mandated closure of the company’s Flipkart business in India for a portion of the quarter, as well as similar actions in markets in Africa and Central America. Consolidated gross profit rate increased 63 basis points primarily as a result of a shift in the mix of sales to higher-margin general merchandise categories, fewer markdowns and better margins on fuel, partially offset by the carryover of investments in price from last year. Spending associated with stimulus payments in the U.S. positively affected sales of general merchandise. Consolidated operating expenses as a percentage of net sales increased 42 basis points, primarily as a result of incremental expenses related to COVID-19, a business restructuring in the U.S. and a discrete tax item. In total, these costs negatively affected expense leverage by about 130 basis points. Underlying productivity in stores and eCommerce remained strong. Consolidated operating income was $6.1 billion, an increase of 8.5%. Adjusted operating income in constant currency2 increased 18.6% led by strength across all operating segments, including significantly lower losses in Walmart U.S. eCommerce. Adjusted EPS2 excludes the effects, net of tax, of an unrealized gain of $0.89 on equity investments, a business restructuring charge in the U.S. of $0.10 and $0.08 for a discrete tax item. 1 Comp sales for the 13-week period ended July 31, 2020 compared to 13-week period ended July 26, 2019, and excludes fuel. See Supplemental Financial Information for additional information 2 See additional information at the end of this release regarding non-GAAP financial measures.
  • 2. 2 NYSE: WMT August 18, 2020 stock.walmart.com Key results (Amounts in billions, except as noted. Dollar and percentage changes may not recalculate due to rounding.) Q2 FY21 Q2 FY20 Change Revenue $137.7 $130.4 $7.4 5.6% Revenue (constant currency)1 $140.2 $130.4 $9.8 7.5% Operating income $6.1 $5.6 $0.5 8.5% Operating income (constant currency)1 $6.1 $5.6 $0.6 10.1% Adjusted operating income (constant currency)1 $6.6 $5.6 $1.0 18.6% Free Cash Flow1 YTD FY21 $ Change Returns to Shareholders Q2 FY21 % Change Operating cash flow $19.0 $7.8 Dividends $1.5 0.9% Capital expenditures $3.6 -$1.3 Share repurchases2 $0.0 -100.0% Free cash flow1 $15.4 $9.1 Total $1.5 -50.5% Segment results (Amounts in billions, except as noted. Dollar and percentage changes may not recalculate due to rounding.) U.S. Q2 FY21 Q2 FY20 Change Net sales $93.3 $85.2 $8.1 9.5% Comp sales (ex. fuel)3 9.3% 2.8% NP NP Transactions -14.0% 0.6% NP NP Average ticket 27.0% 2.2% NP NP eCommerce contribution4 ~600 bps ~180 bps NP NP Operating income $5.1 $4.7 $0.4 8.5% Adjusted operating income1 $5.4 $4.7 $0.8 16.7% Q2 FY21 Q2 FY20 Change Net sales $27.2 $29.1 -$2.0 -6.8% Net sales (constant currency)1 $29.6 $29.1 $0.5 1.6% Operating income $0.8 $0.9 -$0.1 -9.1% Operating income (constant currency)1 $0.9 $0.9 $0.0 0.9% Adjusted operating income (constant currency)1 $1.0 $0.9 $0.1 11.5% Q2 FY21 Q2 FY20 Change Net sales $16.4 $15.0 $1.3 8.8% Comp sales (ex. fuel)3 13.3% 1.2% NP NP Transactions 8.7% 5.0% NP NP Average ticket 4.3% -3.8% NP NP eCommerce contribution4 ~190 bps ~190 bps NP NP Operating income $0.6 $0.5 $0.1 23.3% 1 See additional information at the end of this release regarding non-GAAP financial measures. 2 $5.0 billion remaining of $20 billion authorization approved in October 2017. The company did not repurchase shares during the second quarter of fiscal 2021. 3 Comp sales for the 13-week period ended July 31, 2020 compared to 13-week period ended July 26, 2019, and excludes fuel. See Supplemental Financial Information for additional information. 4 Beginning in Q1 FY21, we revised our definition of eCommerce net sales to include certain pharmacy transactions. Accordingly, we revised prior period amounts for Walmart U.S. and Sam’s Club to be consistent with the current year’s presentation. NP - Not provided
  • 3. 3 NYSE: WMT August 18, 2020 stock.walmart.com About Walmart Walmart Inc. (NYSE: WMT) helps people around the world save money and live better - anytime and anywhere - in retail stores, online, and through their mobile devices. Each week, over 265 million customers and members visit approximately 11,500 stores under 56 banners in 27 countries and eCommerce websites. With fiscal year 2020 revenue of $524 billion, Walmart employs over 2.2 million associates worldwide. Walmart continues to be a leader in sustainability, corporate philanthropy and employment opportunity. Additional information about Walmart can be found by visiting http://corporate.walmart.com, on Facebook at http://facebook.com/walmart and on Twitter at http://twitter.com/walmart. Investor Relations contact Dan Binder, CFA (479) 258-7172 Media Relations contact Randy Hargrove (800) 331-0085
  • 4. 4 NYSE: WMT August 18, 2020 stock.walmart.com Forward-Looking Statements This release and related management commentary contains statements, including statements that relate to our withdrawal of guidance, that may be"forward-looking statements" as defined in, and are intended to enjoy the protection of the safe harbor for forward-looking statements within the meaning of Section 21E of the Securities Exchange Act of 1934, as amended. Assumptions on which such forward- looking statements are based are also forward-looking statements. Our actual results may differ materially from those expressed in or implied by any of these forward-looking statements as a result of changes in circumstances, assumptions not being realized or other risks, uncertainties and factors including: the impact of the COVID-19 pandemic on our business and the global economy; economic, capital markets and business conditions; trends and events around the world and in the markets in which we operate; currency exchange rate fluctuations, changes in market interest rates and market levels of wages; changes in the size of various markets, including eCommerce markets; unemployment levels; inflation or deflation, generally and in particular product categories; consumer confidence, disposable income, credit availability, spending levels, shopping patterns, debt levels and demand for certain merchandise; the effectiveness of the implementation and operation of our strategies, plans, programs and initiatives; unexpected changes in our objectives and plans; the impact of acquisitions, investments, divestitures, store or club closures, and other strategic decisions; our ability to successfully integrate acquired businesses, including within the eCommerce space; changes in the trading prices of certain equity investments we hold; initiatives of competitors, competitors' entry into and expansion in our markets, and competitive pressures; customer traffic and average ticket in our stores and clubs and on our eCommerce websites; the mix of merchandise we sell, the cost of goods we sell and the shrinkage we experience; trends in consumer shopping habits around the world and in the markets in which we operate; our gross profit margins; the financial performance of Walmart and each of its segments, including the amounts of our cash flow during various periods; changes in the credit ratings assigned to our commercial paper and debt securities by credit rating agencies; the amount of our net sales and operating expenses denominated in the U.S. dollar and various foreign currencies; transportation, energy and utility costs; commodity prices and the price of gasoline and diesel fuel; supply chain disruptions and disruptions in seasonal buying patterns; the availability of goods from suppliers and the cost of goods acquired from suppliers; consumer acceptance of and response to our stores, clubs, eCommerce platforms, programs, merchandise offerings and delivery methods; cyber security events affecting us and related costs and impact to the business; developments in, outcomes of, and costs incurred in legal or regulatory proceedings to which we are a party or are subject, and the liabilities, obligations and expenses, if any, that we may incur in connection therewith; casualty and accident-related costs and insurance costs; the turnover in our workforce and labor costs, including healthcare and other benefit costs; consumer enrollment in health and drug insurance programs and such programs' reimbursement rates and drug formularies; our effective tax rate and the factors affecting our effective tax rate, including assessments of certain tax contingencies, valuation allowances, changes in law, administrative audit outcomes, impact of discrete items and the mix of earnings between the U.S. and Walmart's international operations; changes in existing tax, labor and other laws and regulations and changes in tax rates including the enactment of laws and the adoption and interpretation of administrative rules and regulations; the imposition of new taxes on imports, new tariffs and changes in existing tariff rates; the imposition of new trade restrictions and changes in existing trade restrictions; adoption or creation of new, and modification of existing, governmental policies, programs, initiatives and actions in the markets in which Walmart operates and elsewhere and actions with respect to such policies, programs and initiatives; changes in accounting estimates or judgments; the level of public assistance payments; natural disasters, changes in climate, geopolitical events and catastrophic events; and changes in generally accepted accounting principles in the United States. Our most recent annual report on Form 10-K and subsequent quarterly report on Form 10-Q filed with the SEC discuss other risks and factors that could cause actual results to differ materially from those expressed or implied by any forward-looking statement in the release and related management commentary. We urge you to consider all of the risks, uncertainties and factors identified above or discussed in such reports carefully in evaluating the forward-looking statements in this release. Walmart cannot assure you that the results reflected in or implied by any forward-looking statement will be realized or, even if substantially realized, that those results will have the forecasted or expected consequences and effects for or on our operations or financial performance. The forward-looking statements made today are as of the date of this release. Walmart undertakes no obligation to update these forward-looking statements to reflect subsequent events or circumstances.
  • 5. 5 Walmart Inc. Condensed Consolidated Statements of Income (Unaudited) Three Months Ended Six Months Ended July 31, July 31, (Amounts in millions, except per share data) 2020 2019 Percent Change 2020 2019 Percent Change Revenues: Net sales $136,824 $129,388 5.7 % $270,496 $252,337 7.2 % Membership and other income 918 989 (7.2)% 1,868 1,965 (4.9)% Total revenues 137,742 130,377 5.6 % 272,364 254,302 7.1 % Costs and expenses: Cost of sales 102,689 97,923 4.9 % 204,715 190,957 7.2 % Operating, selling, general and administrative expenses 28,994 26,871 7.9 % 56,366 52,817 6.7 % Operating income 6,059 5,583 8.5 % 11,283 10,528 7.2 % Interest: Debt 577 558 3.4 % 1,087 1,146 (5.1)% Finance lease obligations 81 83 (2.4)% 163 168 (3.0)% Interest income (23) (56) (58.9)% (66) (104) (36.5)% Interest, net 635 585 8.5 % 1,184 1,210 (2.1)% Other (gains) and losses (3,222) 85 (3,890 .6 )% (3,943) (752) 424.3 % Income before income taxes 8,646 4,913 76.0 % 14,042 10,070 39.4 % Provision for income taxes 2,207 1,233 79.0 % 3,529 2,484 42.1 % Consolidated net income 6,439 3,680 75.0 % 10,513 7,586 38.6 % Consolidated net (income) loss attributable to noncontrolling interest 37 (70) (152.9)% (47) (134) (64.9)% Consolidated net income attributable to Walmart $ 6,476 $ 3,610 79.4 % $ 10,466 $ 7,452 40.4 % Net income per common share: Basic net income per common share attributable to Walmart $ 2.29 $ 1.27 80.3 % $ 3.70 $ 2.60 42.3 % Diluted net income per common share attributable to Walmart $ 2.27 $ 1.26 80.2 % $ 3.67 $ 2.59 41.7 % Weighted-average common shares outstanding: Basic 2,832 2,853 2,832 2,861 Diluted 2,848 2,869 2,848 2,878 Dividends declared per common share $ — $ — $ 2.16 $ 2.12
  • 6. 6 Walmart Inc. Condensed Consolidated Balance Sheets (Unaudited) July 31, January 31, July 31, (Amounts in millions) 2020 2020 2019 ASSETS Current assets: Cash and cash equivalents $ 16,906 $ 9,465 $ 9,283 Receivables, net 5,111 6,284 5,382 Inventories 41,084 44,435 44,134 Prepaid expenses and other 1,895 1,622 2,572 Total current assets 64,996 61,806 61,371 Property and equipment, net 101,182 105,208 104,674 Operating lease right-of-use assets 16,869 17,424 17,239 Finance lease right-of-use assets, net 4,843 4,417 3,949 Goodwill 29,542 31,073 31,454 Other long-term assets 19,950 16,567 16,174 Total assets $ 237,382 $ 236,495 $ 234,861 LIABILITIES AND EQUITY Current liabilities: Short-term borrowings $ 357 $ 575 $ 3,681 Accounts payable 46,326 46,973 45,871 Dividends payable 3,060 — 3,023 Accrued liabilities 23,768 22,296 20,691 Accrued income taxes 610 280 387 Long-term debt due within one year 5,553 5,362 4,396 Operating lease obligations due within one year 1,734 1,793 1,795 Finance lease obligations due within one year 549 511 439 Total current liabilities 81,957 77,790 80,283 Long-term debt 40,959 43,714 44,404 Long-term operating lease obligations 15,669 16,171 16,079 Long-term finance lease obligations 4,673 4,307 3,915 Deferred income taxes and other 12,927 12,961 13,049 Commitments and contingencies Equity: Common stock 283 284 285 Capital in excess of par value 3,197 3,247 2,880 Retained earnings 87,614 83,943 78,432 Accumulated other comprehensive loss (15,784) (12,805) (11,270) Total Walmart shareholders’ equity 75,310 74,669 70,327 Noncontrolling interest 5,887 6,883 6,804 Total equity 81,197 81,552 77,131 Total liabilities and equity $ 237,382 $ 236,495 $ 234,861
  • 7. 7 Walmart Inc. Condensed Consolidated Statements of Cash Flows (Unaudited) Six Months Ended July 31, (Amounts in millions) 2020 2019 Cash flows from operating activities: Consolidated net income $ 10,513 $ 7,586 Adjustments to reconcile consolidated net income to net cash provided by operating activities: Depreciation and amortization 5,562 5,436 Unrealized (gains) and losses (4,006) (731) Loss on disposal of business operations 37 — Deferred income taxes 472 241 Other operating activities 305 348 Changes in certain assets and liabilities, net of effects of acquisitions and dispositions: Receivables, net 823 978 Inventories 2,466 220 Accounts payable 1,052 (1,242) Accrued liabilities 1,428 (1,657) Accrued income taxes 304 6 Net cash provided by operating activities 18,956 11,185 Cash flows from investing activities: Payments for property and equipment (3,569) (4,871) Proceeds from the disposal of property and equipment 83 128 Proceeds from disposal of certain operations — 833 Payments for business acquisitions, net of cash acquired (175) (56) Other investing activities 27 142 Net cash used in investing activities (3,634) (3,824) Cash flows from financing activities: Net change in short-term borrowings (178) (1,564) Proceeds from issuance of long-term debt — 4,020 Repayments of long-term debt (2,937) (407) Dividends paid (3,058) (3,036) Purchase of Company stock (723) (3,707) Dividends paid to noncontrolling interest (66) (259) Other financing activities (852) (578) Net cash used in financing activities (7,814) (5,531) Effect of exchange rates on cash, cash equivalents and restricted cash (69) (266) Net increase in cash, cash equivalents and restricted cash 7,439 1,564 Cash, cash equivalents and restricted cash at beginning of year 9,515 7,756 Cash, cash equivalents and restricted cash at end of period $ 16,954 $ 9,320
  • 8. 8 Walmart Inc. Supplemental Financial Information (Unaudited) Net sales and operating income Net Sales Operating Income Three Months Ended Three Months Ended July 31, July 31, (dollars in millions) 2020 2019 Percent Change 2020 2019 Percent Change Walmart U.S. $ 93,282 $ 85,200 9.5% $ 5,057 $ 4,659 8.5% Walmart International 27,167 29,139 -6.8% 812 893 -9.1% Sam’s Club 16,375 15,049 8.8% 592 480 23.3% Corporate and support — — N/A (402) (449) -10.5% Consolidated $ 136,824 $ 129,388 5.7% $ 6,059 $ 5,583 8.5% U.S. comparable sales results With Fuel Without Fuel Fuel Impact Thirteen Weeks Ended Thirteen Weeks Ended Thirteen Weeks Ended 7/31/2020 7/26/2019 7/31/2020 7/26/2019 7/31/2020 7/26/2019 Walmart U.S. 9.1% 2.8% 9.3% 2.8% -0.2% 0.0% Sam’s Club 8.7% 1.8% 13.3% 1.2% -4.6% 0.6% Total U.S. 9.0% 2.6% 9.9% 2.6% -0.9% 0.0% Comparable sales is a metric that indicates the performance of our existing stores and clubs and it is important to review in conjunction with the Company’s financial results reported in accordance with GAAP. Comparable sales excluding fuel is also an important, separate metric that indicates the performance of our existing stores and clubs without considering fuel, which is volatile and unpredictable. Other companies in our industry may calculate comparable sales differently, limiting the comparability of the metric.
  • 9. 9 Walmart Inc. Reconciliations of and Other Information Regarding Non-GAAP Financial Measures (Unaudited) The following information provides reconciliations of certain non-GAAP financial measures presented in the press release to which this reconciliation is attached to the most directly comparable financial measures calculated and presented in accordance with generally accepted accounting principles (GAAP). The company has provided the non-GAAP financial information presented in the press release, which is not calculated or presented in accordance with GAAP, as information supplemental and in addition to the financial measures presented in the press release that are calculated and presented in accordance with GAAP. Such non-GAAP financial measures should not be considered superior to, as a substitute for or alternative to, and should be considered in conjunction with, the GAAP financial measures presented in the press release. The non-GAAP financial measures in the press release may differ from similar measures used by other companies. Constant Currency In discussing our operating results, the term currency exchange rates refers to the currency exchange rates we use to convert the operating results for countries where the functional currency is not the U.S. dollar into U.S. dollars or for countries experiencing hyperinflation. We calculate the effect of changes in currency exchange rates as the difference between current period activity translated using the current period’s currency exchange rates and the comparable prior year period’s currency exchange rates. Additionally, no currency exchange rate fluctuations are calculated for non-USD acquisitions until owned for 12 months. Throughout our discussion, we refer to the results of this calculation as the impact of currency exchange rate fluctuations. When we refer to constant currency operating results, this means operating results without the impact of the currency exchange rate fluctuations. The disclosure of constant currency amounts or results permits investors to better understand Walmart’s underlying performance without the effects of currency exchange rate fluctuations. The table below reflects the calculation of constant currency for total revenues, net sales and operating income for the three and six months ended July 31, 2020. Three Months Ended July 31, Six Months Ended July 31, Walmart International Consolidated Walmart International Consolidated (Dollars in millions) 2020 Percent Change1 2020 Percent Change1 2020 Percent Change1 2020 Percent Change1 Total revenues: As reported $ 27,406 -6.9% $ 137,742 5.6% $ 57,458 -1.8% $ 272,364 7.1% Currency exchange rate fluctuations 2,432 N/A 2,432 N/A 3,727 N/A 3,727 N/A Constant currency total revenues $ 29,838 1.3% $ 140,174 7.5% $ 61,185 4.6% $ 276,091 8.6% Net sales: As reported $ 27,167 -6.8% $ 136,824 5.7% $ 56,933 -1.7% $ 270,496 7.2% Currency exchange rate fluctuations 2,445 N/A 2,445 N/A 3,699 N/A 3,699 N/A Constant currency net sales $ 29,612 1.6% $ 139,269 7.6% $ 60,632 4.7% $ 274,195 8.7% Operating income: As reported $ 812 -9.1% $ 6,059 8.5% $ 1,618 -0.8% $ 11,283 7.2% Currency exchange rate fluctuations 89 N/A 89 N/A 136 N/A 136 N/A Constant currency operating income $ 901 0.9% $ 6,148 10.1% $ 1,754 7.5% $ 11,419 8.5% 1 Change versus prior year comparable period.
  • 10. 10 Adjusted operating income Adjusted operating income is considered a non-GAAP financial measure under the SEC’s rules because it excludes certain charges included in operating income calculated in accordance with GAAP. Management believes that adjusted operating income is a meaningful measure to share with investors because it best allows comparison of the performance with that of the comparable period. In addition, adjusted operating income affords investors a view of what management considers Walmart’s core earnings performance and the ability to make a more informed assessment of such core earnings performance as compared with that of the prior year. When we refer to adjusted operating income in constant currency this means adjusted operating results without the impact of the currency exchange rate fluctuations. The disclosure of constant currency amounts or results permits investors to better understand Walmart’s underlying performance without the effects of currency exchange rate fluctuations. The tables below reflect the calculation of adjusted operating income and adjusted operating income in constant currency for the three and six months ended July 31, 2020. Three Months Ended July 31, Walmart US Walmart International Consolidated (Dollars in millions) 2020 Percent Change1 2020 Percent Change1 2020 Percent Change1 Operating income: Operating income, as reported $ 5,057 8.5% $ 812 (9.1)% $ 6,059 8.5% Business restructuring charge 380 N/A N/A N/A 380 N/A Discrete tax item N/A N/A 77 N/A 77 N/A Adjusted operating income 5,437 16.7% 889 (0.4)% 6,516 16.7% Currency exchange rate fluctuations N/A N/A 107 N/A 107 N/A Adjusted operating income, constant currency $ 5,437 16.7% $ 996 11.5 % $ 6,623 18.6% Six Months Ended July 31, Walmart US Walmart International Consolidated (Dollars in millions) 2020 Percent Change1 2020 Percent Change1 2020 Percent Change1 Operating income: Operating income, as reported $ 9,359 6.3% $ 1,618 (0.8)% $ 11,283 7.2% Business restructuring charge 380 N/A N/A N/A 380 N/A Discrete tax item N/A N/A 77 N/A 77 N/A Adjusted operating income 9,739 10.7% 1,695 3.9 % 11,740 11.6% Currency exchange rate fluctuations N/A N/A 154 N/A 154 N/A Adjusted operating income, constant currency $ 9,739 10.7% $ 1,849 13.4 % $ 11,894 13.0% 1 Change versus prior year comparable period.
  • 11. 11 Free Cash Flow We define free cash flow as net cash provided by operating activities in a period minus payments for property and equipment made in that period. We had net cash provided by operating activities of $19.0 billion for the six months ended July 31, 2020, which increased when compared to $11.2 billion for the six months ended July 31, 2019 primarily due to the impact of the global health crisis which accelerated inventory sell-through, as well as the timing and payment of inventory purchases, incremental COVID-19 related expenses and certain benefit payments. We generated free cash flow of $15.4 billion for the six months ended July 31, 2020, which increased when compared to $6.3 billion for the six months ended July 31, 2019 due to the same reasons as the increase in net cash provided by operating activities, as well as $1.3 billion in decreased capital expenditures due to impacts from the COVID-19 pandemic which impacted the timing of store remodeling and front-end technology transformation activities in Walmart U.S. Free cash flow is considered a non-GAAP financial measure. Management believes, however, that free cash flow, which measures our ability to generate additional cash from our business operations, is an important financial measure for use in evaluating the company’s financial performance. Free cash flow should be considered in addition to, rather than as a substitute for, consolidated net income as a measure of our performance and net cash provided by operating activities as a measure of our liquidity. Additionally, Walmart’s definition of free cash flow is limited, in that it does not represent residual cash flows available for discretionary expenditures, due to the fact that the measure does not deduct the payments required for debt service and other contractual obligations or payments made for business acquisitions. Therefore, we believe it is important to view free cash flow as a measure that provides supplemental information to our Consolidated Statements of Cash Flows. Although other companies report their free cash flow, numerous methods may exist for calculating a company’s free cash flow. As a result, the method used by Walmart’s management to calculate our free cash flow may differ from the methods used by other companies to calculate their free cash flow. The following table sets forth a reconciliation of free cash flow, a non-GAAP financial measure, to net cash provided by operating activities, which we believe to be the GAAP financial measure most directly comparable to free cash flow, as well as information regarding net cash used in investing activities and net cash used in financing activities. Six Months Ended July 31, (Dollars in millions) 2020 2019 Net cash provided by operating activities $ 18,956 $ 11,185 Payments for property and equipment (capital expenditures) (3,569) (4,871) Free cash flow $ 15,387 $ 6,314 Net cash used in investing activities1 $ (3,634) $ (3,824) Net cash used in financing activities (7,814) (5,531) 1 “Net cash used in investing activities” includes payments for property and equipment, which is also included in our computation of free cash flow.
  • 12. 12 Adjusted EPS Adjusted diluted earnings per share attributable to Walmart (Adjusted EPS) is considered a non-GAAP financial measure under the SEC’s rules because it excludes certain amounts included in the diluted earnings per share attributable to Walmart calculated in accordance with GAAP (EPS), the most directly comparable financial measure calculated in accordance with GAAP. Management believes that Adjusted EPS is a meaningful measure to share with investors because it best allows comparison of the performance with that of the comparable period. In addition, Adjusted EPS affords investors a view of what management considers Walmart’s core earnings performance and the ability to make a more informed assessment of such core earnings performance with that of the prior year. We adjust for the unrealized gains and losses on our equity investments (primarily JD.com) each quarter because although the investments are strategic decisions for the Company’s retail operations, management’s measurement of each strategy is primarily focused on the respective market’s operational results rather than the fair value of such investments. Additionally, management does not forecast changes in the fair value of its equity investments. Accordingly, management adjusts EPS each quarter for the unrealized gains and losses related to those equity investments. We have calculated Adjusted EPS for the three and six months ended July 31, 2020 by adjusting EPS for the following: (1) unrealized gains and losses on the company’s equity investments; (2) a discrete tax item; and (3) a business restructuring charge resulting from changes to corporate support teams to better support the Walmart U.S. omnichannel strategy. Three Months Ended July 31, 2020 Diluted earnings per share: Reported EPS $ 2.27 Adjustments: Pre-Tax Impact Tax Impact1, 2 NCI Impact3 Net Impact Unrealized (gains) and losses on equity investments $ (1.13) $ 0.24 $ — $ (0.89) Business restructuring charge 0.13 (0.03) — 0.10 Discrete tax item 0.06 0.05 (0.03) 0.08 Net adjustments $ (0.71) Adjusted EPS $ 1.56 Six Months Ended July 31, 20204 Diluted earnings per share: Reported EPS $ 3.67 Adjustments: Pre-Tax Impact Tax Impact1,2 NCI Impact3 Net Impact Unrealized (gains) and losses on equity investments $ (1.41) $ 0.30 $ — $ (1.11) Business restructuring charge 0.13 (0.03) — 0.10 Discrete tax item 0.06 0.05 (0.03) 0.08 Net adjustments $ (0.93) Adjusted EPS $ 2.74 1 Calculated based on nature of item, including any realizable deductions, and statutory rate in effect for relevant jurisdictions. 2 The reported effective tax rate was 25.5% and 25.1% for the three and six months ended July 31, 2020, respectively. When adjusted for the above items, the effective tax rate was 24.8% and 24.9% for the three and six months ended July 31, 2020, respectively. 3 Calculated based on the ownership percentages of our noncontrolling interests. 4 Quarterly adjustments or adjusted EPS may not sum to YTD adjustments or YTD adjusted EPS due to rounding.
  • 13. 13 As previously disclosed in our second quarter ended July 31, 2019 press release, we have calculated Adjusted EPS for the three and six months ended July 31, 2019 by adjusting EPS for the unrealized gains and losses on our JD.com investment. Three Months Ended July 31, 2019 Diluted earnings per share: Reported EPS $ 1.26 Adjustments: Pre-Tax Impact Tax Impact1 Net Impact Unrealized (gains) and losses on JD.com investment $ 0.02 $ (0.01) $ 0.01 Adjusted EPS $ 1.27 Six Months Ended July 31, 2019 Diluted earnings per share: Reported EPS $ 2.59 Adjustments: Pre-Tax Impact Tax Impact1 Net Impact Unrealized (gains) and losses on JD.com investment $ (0.25) $ 0.06 $ (0.19) Adjusted EPS $ 2.40 1 Calculated based on nature of item, including any realizable deductions, and statutory rate in effect for relevant jurisdictions.