![Whatis theInventorymanagement[Video]](data:image/gif;base64,R0lGODlhAQABAIAAAAAAAP///yH5BAEAAAAALAAAAAABAAEAAAIBRAA7)
Recommended
More Related Content
What's hot
What's hot (20)
Similar to Inventory Management Presentation
Similar to Inventory Management Presentation (20)
Recently uploaded
Recently uploaded (20)
Inventory Management Presentation
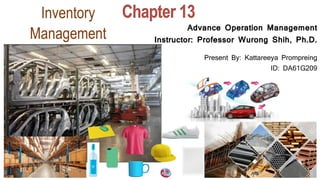
- 1. Inventory Management Advance Operation Management Instructor: Professor Wurong Shih, Ph.D. Present By: Kattareeya Prompreing ID: DA61G209
- 3. Chapter 13: Learning ObjectivesYou should be able to: 1. Define the term inventory, list the major reasons for holding inventories, and list the main requirements for effective inventory management 2. Discuss the nature and importance of service inventories. 3. Explain periodic and perpetual review systems 4. Explain the objectives of inventory management 5. Describe the A-B-C approach and explain how it is useful
- 4. 7. Describe the basic EOQ model and its assumptions and solve typical problems 8. Describe the quantity discount model and solve typical problems 9. Describe reorder point models and solve typical problems 10.Describe situations in which the single-period model would be appropriate, and solve typical problems
- 5. • Inventory A stock or store of goods Inventory Inventories are a vital part of business: (1)necessary for operations (2) contribute to customer satisfaction A “typical” firm has roughly 30% of its current assets and as much as 90% of its working capital invested in inventory Independent demand items Items that are ready to be sold or used
- 6. • Raw materials and purchased parts • Work-in-process (WIP) • Finished goods inventories or merchandise • Tools and supplies • Maintenance and repairs (MRO) inventory • Goods-in-transit to warehouses or customers (pipeline inventory) Types of Inventory Example Product is Wood Furniture
- 7. Objectivesof Inventory Control Inventory management has two main concerns: 1. Level of customer service Having the right goods available in the right quantity in the right place at the right time 1. Costs of ordering and carrying inventories The overall objective of inventory management is to achieve satisfactory levels of customer service while keeping inventory costs within reasonable bounds 1.Measures of performance 2.Customer satisfaction Number and quantity of backorders Customer complaints 3.Inventory turnover
- 8. Example; By initiating a program that utilizes barcodes and scanners, such as this one by Motorola, hospitals can control inventory supply areas, as well as keep track of all equipment in use across the enterprise. Stockroom inventory applications track consumable items such as medication and supplies, while check in/out applications track shared or re-usable items such as X-rays, lab results, diagnostic tools, and other medical equipment.
- 9. The Important of Inventory control.[Video]
- 10. Inventory Management • Management has two basic functions concerning inventory: 1. Establish a system for tracking items in inventory 2. Make decisions about • When to order • How much to order
- 11. Effective Inventory Management • Requires: 1. A system keep track of inventory 2. A reliable forecast of demand 3. Knowledge of lead time and lead time variability 4. Reasonable estimates of • holding costs • ordering costs • shortage costs 5. A classification system for inventory items
- 12. Periodic System Physical count of items in inventory made at periodic intervals Inventory Counting Systems Perpetual Inventory System System that keeps track of removals from inventory continuously, thus monitoring current levels of each item An order is placed when inventory drops to a predetermined minimum level
- 13. Demand Forecasts and Lead Time • Forecasts • Inventories are necessary to satisfy customer demands, so it is important to have a reliable estimates of the amount and timing of demand • Point-of-sale (POS) systems • A system that electronically records actual sales • Such demand information is very useful for enhancing forecasting and inventory management • Lead time • Time interval between ordering and receiving the order
- 14. Inventory Costs Purchase cost The amount paid to buy the inventory Holding (carrying) costs Cost to carry an item in inventory for a length of time, usually a year Ordering costs Costs of ordering and receiving inventory Setup costs The costs involved in preparing equipment for a job Analogous to ordering costs Shortage costs Costs resulting when demand exceeds the supply of inventory; often unrealized profit per unit
- 15. Two-bin system Two containers of inventory; reorder when the first is empty.
- 16. Universal product code (UPC) Bar code printed on a label that has information about the item to which it is attached. Example: The zero on the left of the bar code identifies this as a grocery item, the first five numbers (14800) indicate the manufacturer (Mott’s), and the last five numbers (23208) indicate the specific item (natural-style applesauce). Items in small packages, such as candy and gum, use a six-digit number. Example:
- 17. • Poor inventory accuracy leads to too much inventory or shortages. • Software systems maintain enormous amounts of data and have a great amount of functionality. • Systems can analyze inventory levels, allocate stock plan purchases, and allocate deliveries . • They can identify key suppliers of each stocked item and can give lead times and dock-to-stock times for realistic time-phasing. Bar coding is important for other sectors of business besides retailing. Manufacturing and service industries benefit from the simplified production and inventory control it provides.
- 18. Radio Frequency Identification (RFID) Tags and supply chain management(SCM) Radio frequency identification (RFID) is a promising technology which can potentially assist in enhancing the efficiency of manufacturing by Reorganizing and Optimizing internal operations, such as purchasing, warehousing, management, and distribution of materials in the production, as well as in external supply chain management(SCM). RFID makes it possible to identify individual objects in the production automatically and wirelessly, so it has an increasing potential in various applications which can make manufacturing more efficient and productive. RFID can enable “process freedoms” and real-time visibility into supply chains. RFID tags transmit product information or other data to network connected RFID readers via radio waves.
- 19. Just In Time and Supply Chain Management – 5 Salient Features 1. 3 JIT system principles 2. 6 JIT system Inventory Management Principle 3. Implications of JIT System for logistics interaction. 4. Benefit of Implementing JIT system. 5. Problems Related with the Implementation of a JIT system. History The management technique originated in Japan and is often attributed to Toyota. However, many believe that Japan's shipyards were the first to develop and successful implement this approach. Its origins are seen as three-fold: Japan's post-war lack of cash, lack of space for big factories and inventory and Japan's lack of natural resources. Thus the Japanese "leaned out" their processes. " News about JIT/TPS reached western shores in 1977 with implementations in the US and other developed countries beginning in 1980. • What is JIT• Just-in-time (JIT) manufacturing is a way of managing manufacturing systems that could reduce waste, and lower cost, thus increasing profit• • Today's competitive environment, markets are becoming more international, dynamic, and customer‐driven. Customers are demanding more variety, better quality and service, including both reliability and faster delivery. • Technological developments are occurring at a faster pace, resulting in new product innovations and improvements in manufacturing processes. The resulting competitive environment requires low cost, high quality products in increasing varieties. These changes have instigated changes in business and manufacturing strategies.
- 20. ABC Classification System • A-B-C approach Classifying inventory according to some measure of importance, and allocating control efforts accordingly • A items (very important) 10 to 20 percent of the number of items in inventory and about 60 to 70 percent of the annual dollar value • B items (moderately important) • C items (least important) 50 to 60 percent of the number of items in inventory but only about 10 to 15 percent of the annual dollar value
- 21. Cycle Counting • A physical count of items in inventory Cycle counting management How much accuracy is needed? • A items: ± 0.2 percent • B items: ± 1 percent • C items: ± 5 percent • When should cycle counting be performed? • Who should do it?
- 22. One way to lower inventory holding costs is to improve space utilization through narrow aisle handling equipment, mezzanines, layout, or other appropriate storage modes. Another is an inventory management system that allows companies to maintain tight control over inventory levels. This allows process planners to optimize material and maintain accurate quantities.
- 23. How Much to Order: EOQ Models •Economic order quantity models identify the optimal order quantity by minimizing the sum of annual costs that vary with order size and frequency 1. The basic economic order quantity model( EOQ) 2. The economic production quantity model (EPQ) 3. The quantity discount model
- 24. Basic EOQ Model • The basic EOQ model is used to find a fixed order quantity that will minimize total annual inventory costs • Assumptions: 1. Only one product is involved 2. Annual demand requirements are known 3. Demand is even throughout the year 4. Lead time does not vary 5. Each order is received in a single delivery 6. There are no quantity discounts
- 25. The Inventory Cycle Profile of Inventory Level Over Time Quantity on hand Q Receive order Place order Receive order Place order Receive order Lead time Reorder point Usage rate Time X axis= Time Y axis= Quantityon hand
- 27. Goal: Total Cost Minimization Order Quantity (Q) The Total-Cost Curve is U-Shaped Ordering Costs QO AnnualCost (optimal order quantity) Holding Costs S Q D H Q TC 2 X axis= Order Quantity Y axis= Annual Cost
- 28. Deriving EOQ • Using calculus, we take the derivative of the total cost function and set the derivative (slope) equal to zero and solve for Q. • The total cost curve reaches its minimum where the carrying and ordering costs are equal. costholdingunitperannual cost)derdemand)(orannual(22 O H DS Q Economic Order Quantity is a formula that calculates the number of units your business should be adding to inventory order. This question is aimed at reducing the total costs of inventory management including factors like order costs, holding costs, and shortage costs.
- 29. • The batch mode is widely used in production. In certain instances, the capacity to produce a part exceeds its usage (demand rate) • Assumptions 1. Only one item is involved 2. Annual demand requirements are known 3. Usage rate is constant 4. Usage occurs continually, but production occurs periodically 5. The production rate is constant 6. Lead time does not vary 7. There are no quantity discounts EconomicProduction Quantity (EPQ)
- 30. EPQ: Inventory Profile Q Qp Imax Production and usage Production and usage Production and usage Usage only Usage only Cumulative production Amount on hand Time X axis= Time Y axis= Quantityon hand
- 33. EPQ like limitedfor produce per – day , weeks , month,year etc.. Or limitedfor delivered per - dar, weeks ,moth, year etc...
- 34. • Quantity discount • Price reduction for larger orders offered to customers to induce them to buy in large quantities QuantityDiscountModel priceUnit where 2 CostPurchasingCostOrderingCostCarryingCostTotal P PDS Q D H Q
- 35. Quantity Discounts Adding PD does not change EOQ X axis= Quantity Y axis= Cost
- 36. Quantity Discounts The total-cost curve with quantity discounts is composed of a portion of the total-cost curve for each price X axis= Quantity Y axis= Cost
- 37. Opening backorders offers a way to deal with out-of-stock situations, but there’s a chance your customers will prefer looking elsewhere to find the products that they want. So, you always want to make sure you’ve got stock on hand, which is where your reorder point comes into play. When it comes to calculating your reorder point, you need to account for: •The time it takes to get your items picked •The time it takes to get your items packed •The time it takes to get your items to be shipped (lead time) When to Reorder • Reorder point When the quantity on hand of an item drops to this amount, the item is reordered. Determinants of the reorder point 1. The rate of demand 2. The lead time 3. The extent of demand and/or lead time variability 4. The degree of stockout risk acceptable to management
- 38. )asunitstimesame(intimeLeadLT per week)day,perperiod,per(unitsrateDemand where LTROP d d d Reorder Point: Under Certainty
- 39. • Demand or lead time uncertainty creates the possibility that demand will be greater than available supply • To reduce the likelihood of a stockout, it becomes necessary to carry safety stock • Safety stock • Stock that is held in excess of expected demand due to variable demand and/or lead time Reorder Point: Under Uncertainty StockSafety timeleadduring demandExpected ROP
- 40. Safety Stock X axis= Time Y axis= Quantity
- 41. • As the amount of safety stock carried increases, the risk of stockout decreases. • This improves customer service level • Service level • The probability that demand will not exceed supply during lead time • Service level = 100% - Stockout risk Safety Stock? But wait. What is safety stock and why is it important? Safety stock is the emergency stock you need to endure unexpected occurrences - like seasonal acts of nature like blizzards and typhoons. And if you’re curious about how to calculate your safety stock,
- 42. This safety stock formula aims to cover the difference between extreme situations and the everyday - which should be enough to keep you safe. • The amount of safety stock that is appropriate for a given situation depends upon: 1. The average demand rate and average lead time 2. Demand and lead time variability 3. The desired service level How Much Safety Stock? demandtimeleadofdeviationstandardThe deviationsstandardofNumber where timeleadduring demandExpected ROP LT LT d d z z
- 43. Reorder Point: Demand Uncertainty )asunitstime(sametimeLeadLT )asunitstime(sameperiodperdemandofstdev.The per week)day,(perperiodperdemandAverage deviationsstandardofNumber where LTROP d d d z zLTd d d LTLT dd Note: If only demand is variable, then
- 44. Reorder Point: Lead Time Uncertainty )asunitstime(sametimeleadAverageLT )asunitstime(sametimeleadofstddev.The per week)day,(perperiodperDemand deviationsstandardofNumber where LTROP LT LT d d d z zdd LTLT dd Note: If only lead time is variable, then
- 45. Inventory control system where stock level is reviewed regularly at fixed intervals (not continuously), and whenever it falls below a certain level, an order to replenish it to the required level is placed. Read more: http://www.businessdictionary.com/definition/fixed-interval-inventory-model.html • Fixed-order-interval (FOI) model • Orders are placed at fixed time intervals • Reasons for using the FOI model • Supplier’s policy may encourage its use • Grouping orders from the same supplier can produce savings in shipping costs • Some circumstances do not lend themselves to continuously monitoring inventory position How Much to Order: FOI • Fix Time • Fix order • Fix System
- 46. Fixed-Quantity vs. Fixed-Interval Ordering Fixed Interval Fixed Quantity X axis= Time Y axis= Annual onhand
- 48. A single period inventory model is a business scenario faced by companies that order seasonal or one-time items. There is only one chance to get the quantity right when ordering, as the product has no value after the time it is needed. There are costs to both ordering too much or too little, and the company's managers must try to get the order right the first time to minimize the chance of loss. Single-Period Model • Single-period model • Model for ordering of perishables and other items with limited useful lives • Shortage cost • Generally, the unrealized profit per unit • Cshortage = Cs = Revenue per unit – Cost per unit • Excess cost • Different between purchase cost and salvage value of items left over at the end of the period • Cexcess = Ce = Cost per unit – Salvage value per unit For example likecan order just one time ,when amount less than demand It will have shortage cost or amount have more then demand it willhave Excesscost
- 49. Single-Period Model • The goal of the single-period model is to identify the order quantity that will minimize the long-run excess and shortage costs • Two categories of problem: • Demand can be characterized by a continuous distribution • Demand can be characterized by a discrete distribution while at the same time avoiding costly "overstock" situations. Inventory control poses special challenges for companies that operate on a "single-period" inventory model, in which you get only one chance to set your inventory.
- 50. Stocking Levels Service level So Balance Point Quantity Cs Ce So =Optimum Stocking Quantity unitpercostexcess unitpercostshortage where levelService e s es s C C CC C
- 51. Operations Strategy • Improving inventory processes can offer significant cost reduction and customer satisfaction benefits. • Areas that may lead to improvement: • Record keeping • Records and data must be accurate and up-to-date • Variation reduction • Lead variation • Forecast errors • Lean operations • Supply chain management
- 52. Thank you for your attention. Any Questions.?