1. Banking Sector research March, 2006 1 Deloitte-Corporate Finance
Deloitte.
Corporate Finance Department
Research on the Egyptian Banking Sector
May, 2006
By Karim Bakr: Financial Analyst, Cairo office
Overview:
The Egyptian banking sector has witnessed several difficult years along with the effects of
low credit quality and bad debt crisis all in turn stemming from an economic slowdown
and mismanagement of banks.
In 1997, there was the start of a decline in liquidity caused by shortages in foreign
currency. Mainly these shortages were due to the drop in tourism revenue after the
November 1997 terrorist attack in Luxor, the emerging market crisis, the decline in Suez
Canal receipts and the drop in oil prices, which all came at once.
External factors were also unfavorable: a weakening global economy in 2001 and 2002
combined with uncertainty caused by attacks of 11 September 2001and regional political
instability, which adversely affected foreign-currency inflows.
The reporting of NPLs by banks undermines the real magnitude of bad loans.
Non-performing loans have declined from 30% of total loans in 1992 to 13.4% in 1997
until they reached around 11.7% in 1999. However since 2000 the ratio of NPLs to total
loans has increased, as a result of directed lending to GOE guaranteed loss-making public
enterprises, which were not protected by adequate provisions.
Low economic growth coupled with the rise in inflation following the sharp depreciation
of the Egyptian pound between the beginning of 2000 and mid 2003 harmed Egyptians’
purchasing power. Also it reduced demand for retail banking, hindered banks’ lending
capacity and increased provisioning charges so negatively impacting sector bottom line.
On average throughout 2001-2005, banking sector credit offering growth rate stood at 6%
compared to an average of 9% growth in customer deposits.
This is mainly because of NPL problems that had constrained credit growth to new
clients, causing loan portfolio to remain constant or decline in some cases.
With the upswing in the economy since 2004, the problem of NPLs remains an issue that
is crucial to the sector recovery and growth. The new government led by Dr. Nazif and
the CBE governor Dr. Farouk Al Okda have undertaken several issues relating to
consolidating, reforming and increasing the sector’s efficiency.
2. Banking Sector research March, 2006 2 Deloitte-Corporate Finance
Structure of the Banking Sector in Egypt
Financial services in Egypt accounted for 5.2% of GDP in the fiscal 2005
As of July 2005, the Egyptian banking sector consisted of 46 banks, out of which 39 are
local banks and 7 are branches of foreign banks.
The following chart shows the structure of the banking sector in Egypt:
Figure(1): Structure of the Egyptian banking system (July,2005)
The 39 banks operating in Egypt are divided into:
Seven state-owned banks:
1. Big four commercial banks (National Bank of Egypt, Banque Misr, Banque Du
Caire and Bank of Alexandria).
2. Three specialized banks.
Thirty-two joint venture and private banks (excluding three banks which were
established under private laws and are not registered at the CBE, namely, the Arab
International Bank, National Investment Bank and Nasser Social Bank).
Size and Growth of the Banking Sector
As of March 2005, the total number of branches in Egypt reached 2,826 in addition to 39
branches that are licensed to operate overseas. The following table shows the aggregate
financial position of the banking sector.
Central Bank of
Egypt
Private Banks
(32)
Public Banks
(7)
Foreign Sector
(7)
Commercial
Banks
(4)
(4)
Specialized
Banks
(3)
3. Banking Sector research March, 2006 3 Deloitte-Corporate Finance
Table (1): Aggregate financial position of Banks (Except CBE)
Description in LE million
Jun-
02
%
/Total
Jun-
03
%
/Total
Jun-
04
%
/Total
Jun-
05
%
/Total
Dec-
05
%
/Total
A- Assets
Cash 4,453 1% 5,557 1% 5,412 1% 6,594 1% 6,183 1%
Securities and investments in T-bills
of which*:
87,726 18% 111,337 19% 137,431 22% 172,177 24% 180,826 24%
CBE notes 0% 23,907 3%
Balances with Banks in Egypt 83,244 17% 110,874 19% 116,290 18% 124,986 18% 128,286 17%
Balances with Banks abroad 20,002 4% 29,798 5% 43,290 7% 51,204 7% 63,999 9%
Loans and Discounts 266,100 54% 284,722 49% 296,199 47% 308,195 44% 316,374 42%
Other Assets 33,939 7% 35,650 6% 34,814 5% 41,990 6% 54,482 7%
Total Assets 495,464 100% 577,938 100% 633,436 100% 705,146 100% 750,150 100%
B-Liabilities & Owners' equity
Capital 12,531 3% 18,155 3% 20,346 3% 22,949 3% 24,513 3%
Reserves 11,238 2% 11,805 2% 11,454 2% 12,419 2% 12,127 2%
Provisions 35,869 7% 40,099 7% 44,584 7% 49,541 7% 49,990 7%
Long-Term Loans and Bonds 14,057 3% 14,866 3% 15,012 2% 14,254 2% 18,808 3%
Obligations to Banks in Egypt 35,094 7% 35,579 6% 29,933 5% 22,671 3% 31,406 4%
Obligations to Banks abroad 11,830 2% 16,247 3% 10,332 2% 12,262 2% 9,898 1%
Total Deposits 340,868 69% 403,144 70% 461,697 73% 519,649 74% 540,151 72%
Other Liabilities 33,977 7% 38,043 7% 40,078 6% 51,401 7% 63,257 8%
Total Liabilities & Owners' equity 495,464 100% 577,938 100% 633,436 100% 705,146 100% 750,150 100%
* Including T-bills reverse repos which were replaced with CBE notes as of August 2005
o Source: CBE
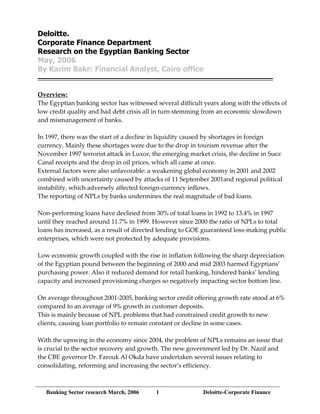
The growth of the banking sector can be measured by the growth of its assets, deposits
and loans. (Although on the international level, the general trend in the banking sector is
contraction, banks in Egypt have experienced growth.)
Growth in 2003 was a result of revaluation of foreign currency denominated assets due to the
devaluation of the Egyptian pound. However due to NPls’ problems since 2003/2004, banks have
been reducing their loans and starting to direct their assets towards minimum risk instruments
which usually yield a low interest income and result in reduced banking sector profitability as a
whole. 1
1
Source AmCham “Egyptian Banking Sector” July 2005
4. Banking Sector research March, 2006 4 Deloitte-Corporate Finance
Figure (2): Banks’ Loans, Deposits and Total Assets
Total Banks' Loans, Deposits and Total Assets
0
100,000
200,000
300,000
400,000
500,000
600,000
700,000
800,000
2002 2003 2004 2005
LEmillion
Loans and Discounts
Total Deposits
Total Assets
Restructuring, Mergers and Acquisitions
Statistics show that state-owned banks continue to dominate the banking sector in Egypt.
These banks have made considerable efforts to restructure their activities, improve
operating system to become more competitive.
The government set an ambitious plan to reform and consolidates the banking sector, and
restructures its core business and reduces the number of operating banks in Egypt to a
target of 30 banks. More stringent capital adequacy regulations were initiated in what
historically was an undercapitalized banking sector. All banks were given a deadline as
of 14th of July 2005 to raise their paid-in capital to a minimum of LE 500 million instead of
LE 100 million. Several banks have not been able to meet this requirement and became a
target for acquisition or merger into one of the large state-owned banks. The merger of
small banks into one large bank does not address their underlying problems, though it
may make those problems easier to deal with.
The worst of NPL problems reside in the four large public sector banks (National Bank of
Egypt, Banque Du Caire, Banque Misr and Bank of Alexandria) which dominate the
sector and hold more than 50% of the system assets, and mainly these problems were due
to poor credit and investment decisions which were often motivated by government
policy rather than commercial realities.
The government announced that it would privatize Bank of Alexandria, and would use
this as a test for possible privatization of other public banks. However the CBE is trying
to improve the management of public sector banks, and in some cases appoint new
management from the private sector.
On September 25th, the Egyptian government made an unexpected announcement with
regard to merging its second and third largest state-owned banks within a period of 6
5. Banking Sector research March, 2006 5 Deloitte-Corporate Finance
months. Banque Misr BOD has been given the authority to manage Banque Du Caire to
align the policies of both banks in preparation for the merger.2
The government ordered the public sector banks to dispose their stakes in joint-venture
banks by end of 2006. NBE has sold its 19% stake in NSGB and in February 2006. It sold
its 18.7% equity stake in CIB to a consortium-led American private-equity giant
Ripplewood holdings in an attempt to regionalize CIB. The deal was worth $230 million.
Banque Misr has sold its 25% stake in MIB, and Bank of Alexandria has sold its 33.8% stake in
EAB, Banque Du Caire sold its 40% stake in Barclays Bank Cairo to Barclays Bank in 2004,
thereby creating the first wholly owned subsidiary foreign bank in the country. 3
There were three banks which failed to increase their capital in 2005 and didn’t announce
their intention to merge (Alexandria and Commercial Maritime Bank, Egyptian Workers
bank and Arab Investment Bank).
More recently CBE has approved the merger of Housing and Development Bank with
Egyptian –Arab Land Bank.
Also American Express Bank has merged into Egyptian American Bank in an $8.8 million
deal.
In March 2005, the CBE and the ministry of investment also have approved the merger
between Credit Agricole Indosuez (Egypt) S.A.E and Credit Lyonnais, Egypt branch, to
form Calyon Bank of Egypt. Further, EAB is in the process of being sold to Calyon Bank.
Market Share:
National Bank of Egypt is considered the largest bank in Egypt in term of assets, loans,
deposits and shareholders’ equity. It holds 19.1% of banking loans and 23.1% of total
deposits, in addition of financing 25% of Egypt’s foreign trade during 2005.
CIB is Egypt’s largest private banks in terms of market capitalization, loans, deposits and
total assets.
The following table indicates the market share of the big four public banks and the
private banks.
2 Source HC Brokerage Al-Watany Bank of Egypt “Update Report” 17 October 2005
3
Source Fitch Ratings “The Egyptian Banking Sector: The Long Road To Reform”
6. Banking Sector research March, 2006 6 Deloitte-Corporate Finance
Table (2) Egyptian Banks’ Market share by Loans and Deposits during 2005
Description in LE billion Loans Deposits
Total Sector LE 306.7 LE 521.8
Public Banks
National Bank of Egypt 19.1% 23.1%
Bank Misr + Banque Du Caire 18.8% 27.0%
Bank of Alexandria 5.0% 7.0%
Private Banks
NSGB 4.5% 5.6%
CIB 4.5% 5.2%
EAB 0.8% 1.8%
WBE 1.3% 1.5%
Others(41 Banks) 46.0% 28.8%
o Source HC brokerage
Outside the 60% controlled by the public sector banks, the banking sector is considered
competitive.
The new entity of Banque Misr after merging with Banque Du Caire is expected to have
27% of total deposits and 22% of total assets in the sector, in addition to a combined
branch network of some 470 branches and bank units.
Commercial banks control about 25% of the banking sector; some investment banks are
more competitive than commercial banks as they apply internationally tested
management techniques and systems.
Basel II Capital Accord
The governors of the G-10 central banks approved the new standard for banks’ capital
adequacy known as the “Basel II Capital Accord” on June 26, 2004. Such standards aim to
ensure high degree of capital adequacy in the face of potential risks in their investments.
These standards are to be implemented in two stages, the first at the end of 2006, and the
second year after the implementation of the first Accord.
The CBE has complied with most of the Basel core principles for effective banking
supervision. The Basel Capital Accord set the Capital Adequacy Ratio at 8%. Recently the
CBE raised it to 10% where all the banks have to abide by this ratio.
Provision Requirements
The CBE has taken extensive measures in monitoring NPL problems in both private and
public sector banks. Provisioning requirements by the CBE have been revised in June
2005 to account for varying degrees of risk within the standard loan category.
Provisioning needs for standard loans now range from 0-5% instead of a previously flat
1%. This is expected to slightly raise provisioning requirements for most banks.
7. Banking Sector research March, 2006 7 Deloitte-Corporate Finance
Table (3): CBE new provisioning requirements
Loan status Category
Inherent risk
level
% of
required
provision
Provisions
type
Performing Standard
Low 0% General
Modest 1% General
Satisfactory 1% General
Adequate 2% General
Acceptable 2% General
Marginally
Acceptable
3% General
A loan can be
classified
under this
category only
for 9 months
after which it
has to be
upgraded or
downgraded
5% General
Non-
Performing
Substandard 20% Specific
Doubtful 50% Specific
Loss 100% Specific
o Source CBE, HC brokerage
8. Banking Sector research March, 2006 8 Deloitte-Corporate Finance
Analysis of a Sample of Banks
The research covers a selected sample of nine banks (six private and three public) from
the Egyptian banking sector. We used the financial statements for the years 2002, 2003,
2004 and 2005 in order to analyze the banks’ performance.
These banks are:
1. Commercial International Bank CIB
2. Misr International Bank MIB
3. National Societe General Bank NSGB
4. Egyptian American Bank EAB
5. Al-Watany Bank of Egypt WBE
6. Export Development Bank of Egypt EDBE
7. Banque Du Caire BDC
8. Housing and Development Bank HDB
9. Egypt Arab Land Bank EALB
Performance Indicators:
1st
Growth
i. Balance sheet Growth:
Growth in total Assets:
Total assets’ increased at an average of 24.15% in 2003, 9.03% in 2004 and 5.20% in 2005.
The slow down in growth is probably due to the increasing NPLs and the banks
refraining from granting new loans.
Export and Development Bank of Egypt has experienced decrease in its total assets with
an average of -6.16% through 2003-2005.
EAB’s total assets declined by -5.31% in 2005 after recording a growth rate of 5.77% in
2004.
Growth in Gross Loans:
Gross loans grew at an average rate of 2.68% in 2005 compared to 3.64% in 2004 and
13.63% in 2003.
Growth in Net Loans:
Growth rates of net loans reached 2.45% in 2005 compared to 1.91% in 2004 and 11.66% in
2003.
Growth in Provisions:
Provisions grew at an average of 1.74% in 2005, compared to 19.24% in 2004 and 36.9% in
2003.
NSGB provisions have declined in 2005 by -0.75%, compared to 2004 due to repayments
of part of NPLs and writing off another part of NPLs, and no general provisions were
formed.
9. Banking Sector research March, 2006 9 Deloitte-Corporate Finance
Growth in Deposits:
Deposits have been growing at a higher rate compared to loans.
According to the selected banks sample, growth rates of deposits averaged 4.14% in 2005,
14.53% in 2004 and 26.3% in 2003.
Customer deposits at Export Development Bank of Egypt has declined at an average of -
10.18% through 2003-2005
In 2004 Housing and Development Bank’s customer deposits have increased from LE
3,222 million to LE 5,012 million recording a growth rate of 55.56%
ii. Income Statement Growth:
The increase in operations of the banking sector has been reflected on the growth of the
selected banks’ revenue, expenses and net income, a continuing increase through 2003-
2005 in income statement items is apparent.
Growth in Interest revenue:
Interest revenue has shown steady growth rates ranging from 5.36% in 2003 to reach
12.9% in 2005.
In general the banks directed a large amount of their funds to minimum risk instruments,
such as T-bills.
Growth in interest expense:
Interest expense has shown high growth rates in 2005 with 13.65% in compared to -5.39%
in 2003, coupled with the increase in deposits.
Growth in G&A:
In the selected bank sample G&A has shown growth rates reflecting the increase in the
overall banking operations ranging from 14.79% in 2005, 15.72% in 2004, and 28.12% in
2003
EDBE showed fluctuations in the change of its G&A expenses, as reporting a decline by -
7.61% in 2005 after realizing a growth rate of 6.98% in 2004
Growth in net interest income:
Net interest income growth was 27.09% in 2003, 18.66% in 2004 and 1.17% in 2005.
EALB’s net interest income declined by -33.16% in 2004 and -45.8% in 2005.
Growth in Net income:
Growth in net income for the banking sample continued to rise through 2001-2005.
Average net income growth rate was 34.88% in 2003, 51.57% in 2004 and it reached
98.27% in 2005, excluding abnormal losses.
EALB has reported net income of LE 2 million in 2004 and a loss of LE 216 million in 2005
10. Banking Sector research March, 2006 10 Deloitte-Corporate Finance
iii. Most Growing Banks
NSGB:
NSGB is considered one of the top performing banks in Egypt. It has taken a leading
position in many banking services, and is continuously expanding its branches in many
regions in Egypt.
NSGB realizing higher growth rates:
The growth of any bank can be measured by the growth of its assets, deposits and loans.
NSGB has realized the highest growth rates in the banking sector through 2003-2005, as
indicated in the following chart.
Figure (3): NSGB’s growth in Loans, Deposits and Total Assets
Societe General (France) raises its stake in NSGB:
In February 2005, Societe Generale raised its stake in NSGB by acquiring an additional
24.1% from National Bank of Egypt to bring its total stake to 78.4%. The acquisition was
complete at a share price of LE 54.
NSGB’s acquisition of MIB:
In August 18th
2005, NSGB submitted an offer to acquire 100% of MIB’s share at a share
price of LE 43.2. The bank managed to acquire around 51 million MIB outstanding shares
0.0%
5.0%
10.0%
15.0%
20.0%
25.0%
30.0%
35.0%
40.0%
45.0%
50.0%
Years
Annual Growth %
Growth in Net Loans
Growth in Customer Deposits
Growth in Total Assets
Growth in Net Loans 9.3% 19.4% 12.3% 14.5%
Growth in Customer Deposits 22.4% 34.6% 10.6% 30.8%
Growth in Total Assets 19.6% 32.0% 10.4% 43.4%
2002 2003 2004 2005
11. Banking Sector research March, 2006 11 Deloitte-Corporate Finance
representing a 90.7% stake of the bank with a P/E ratio of 15.2 and an adjusted P/BV of
3.3. NSGB market share of loan and deposits of the Egyptian market are expected to reach
4.5% and 4.9%, respectively.
NSGB increases its branches:
Through 2005 NSGB has opened 12 new branches throughout many regions in Egypt
totaling all NSGB branches to be 51, also after acquisition of MIB with its branches; NSGB
will be having a total of 85 branches.
2nd
Profitability and Returns:
Net Margin:
Average net margin for the bank sample increased from 8.44% in 2003 to 13.25% in 2005.
EALB averaged a net margin of -4.09% through 2003-2005.
CIB and NSGB realized an average net margin of 22.59% and 25.55% respectively, which
sets them as the top performing banks.
Interest Revenue / Interest Earning Assets
Interest revenue/Interest earning assets reached an average of 8.67% in 2005.
Cairo bank and EALB showed interest revenue over interest earning assets of 11% and
11.08% in 2005 respectively.
EAB’s interest revenue/interest earning assets averaged of 5.77% during 2003-2005.
Figure (4) Interest revenue/interest earning assets ratio for public and private banks
Interest revenue / Interest Bearing Assets
7.7%
7.4%
8.5%
15.1%
9.5% 9.4%
0.0%
2.0%
4.0%
6.0%
8.0%
10.0%
12.0%
14.0%
16.0%
2003 2004 2005
Private
Public
As shown in figure (4), interest revenue/interest earnings assets of public banks had
declined during years 2003-2005 in compared to private bank that had a continued
increase to begin to equate that’s of public banks in 2005.
12. Banking Sector research March, 2006 12 Deloitte-Corporate Finance
Interest. Expense / Interest Bearing Liabilities
Interest expense reached an average of 6.45% in 2005, 6.34% in 2004 and 6.54 in 2003.
In 2005, Cairo bank, HDB and EALB has showed an average of 8%, 12.39% and 10.64%
respectively which greatly differs to interest expense for private banks like CIB, MIB and
NSGB having percentages of 4.71%, 4.18%, 4.97% respectively.
Figure (5) Interest expense/interest bearing Liabilities ratio for public and private banks
Interest Expense / Interest Bearing Liabilities
4.3%
3.8%
4.6%
12.7%
7.4%
9.0%
0.0%
2.0%
4.0%
6.0%
8.0%
10.0%
12.0%
14.0%
2003 2004 2005
Private
Public
Interest Spread
Through 2003-2005 interest spread averaged 2% for the selected sample of banks
CIB and NSGB exceeded the average to reach 4.46% and 4.45% respectively.
Other banks like HDB and EALB have realized negative interest spread amounting to -
1.78% and -0.33% in 2005.
Return on Assets and Return on Equity:
ROA and ROE have showed steady increases for most of the selected banks’ sample,
indicating improvements in the banks’ profitability.
EALB reported negative ROA and ROE in 2005 which stood at -1.08% and -20.49%
respectively.
Table (4): ROA for Banks’ sample during years 2003-2005
ROA
CIB MIB NSGB EAB EDBE WBE BDC HDB EALB
2003 1.88% 0.91% 2.18% 1.13% 0.01% 0.07% 0.25% 0.08% 0.01%
2004 1.94% 0.86% 2.23% 2.33% 0.53% 0.21% 0.12% 0.31% 0.01%
2005 2.09% 0.01% 3.48% 3.07 0.75% N/A 0.62% 0.77% -1.08%
13. Banking Sector research March, 2006 13 Deloitte-Corporate Finance
Table (5): ROE for Banks’ sample during years 2003-2005
ROE
CIB MIB NSGB EAB EDBE WBE BDC HDB EALB
2003 22.77% 12.55% 28.82% 18.53% 0.06% 1.20% 2.28% 1.20% 0.25%
2004 25.09% 12.59% 31.60% 35.47% 5.61% 3.52% 2.04% 6.97% 0.13%
2005 25.15% 0.08% 45.84% 34.42 7.3% N/A 9.25% 18.21% -20.49%
NSGB has showed a ROE of 45.84% in 2005 indicating high profitability during the year
Operating expense/Gross revenue:
The banks’ sample showed an average of 16.22% in 2003, 17.47% in 2004 and 17.64% in
2005.
State-owned banks seemed to be improving their efficiency through 2003-2005 as banks
like Cairo bank, HDB and EALB reported an average of op.exp./gross rev. of 17.15%,
15.21%, and 10.45% during 2003, 2004 and 2005.
CIB, MIB and NSGB had an average of 16.8%, 20.7%, and 14.79% respectively during
2003-2005.
EAB reported the highest op exp/gross rev. ratio which averaged 26.44% though 2003-
2005.
In general the salary differences between public and private banks could be the reason
why public banks have better efficiency ratio.
3rd
Liquidity
Gross loans/Deposits
If we do not take abnormal values into consideration, we can conclude that Gross
loans/Deposits ratio averaged 58% during the years 2003-2005.
Public banks like Cairo bank, HDB and EALB showed higher rates of Gross
loans/Deposits: 73.74%, 68.54% and 159.61% respectively.
Private Banks like NSGB, CIB and MIB showed average rates of 64.67%, 58.17% and
62.46% respectively.
Net Loans/Deposits
Net loans/deposits ratio showed rates of 57.16% in 2005, 58.23% in 2004 and 58.47% in
2003.
Liquid Assets/Total Deposits
Liquid Assets/total deposits showed rates of 56.71% in 2005, 56.16% in 2004 and 51.91% in
2003.
14. Banking Sector research March, 2006 14 Deloitte-Corporate Finance
Funding Breakdown
2004
Borrowings
(including bonds)
6%
Inter-bank
6%
Other Credit (non-
interest bearing)
4%
Shareholder Funds
7%
Customer Deposits
77%
4th
Funding Breakdown:
Funding sources in 2004 and 2005 indicate that the major source of funding is customer
deposits. It decreased in 2005 to reach 74% from 77% in 2004 and offsetting the balance by
more borrowings, bonds and long term loans.
Figure (6): Funding breakdown in 2004 and 2005
EDBE and HDB rely more on borrowing and bonds, as compared to other banks; they
depend less on deposits.
EDBE had 18.72% borrowings of its total financing, while it had 64.7% deposits out of the
total financing.
HDB borrowings reached 26.04%, while customer deposits reached 63.45% of the total
financing.
5th
Assets Breakdown
Break down of assets in the selected sample of banks reveal that net loans constituted
around 51% of the total assets in 2005, up from 48% in 2004.
Most banks increased their investment in T-bills & Bonds in 2004 & 2005 to reach 14% of
total assets compared to 6.83% in 2003. The exempted tax nature of these T-bills according
to article no 17 for year 1991, T-bills income has led banks to increase their portfolios of T-
bills, in addition to the zero risk associated with T-bills.
We conclude also a decrease in inter bank in 2005 and more investing marketable
securities.
Funding Breakdown
2005
Inter-bank
7%
Borrowings
(including bonds)
7%
Other Credit (non-
interest bearing)
5% Shareholder Funds
7%
Customer Deposits
74%
15. Banking Sector research March, 2006 15 Deloitte-Corporate Finance
Figure (7): Assets breakdown in 2004-2005
EALB had the highest percentage of net loans/total assets, with an average of 82.89%
during the years 2003-2005.
6th Assets Quality :
Provisions/Total Loans:
According to selected banks’ sample provisions/total loans averaged 9.74% in 2003,
11.32% in 2004 and 13.5% in 2005.
Earning Assets/Total Assets:
Private banks reported higher earning assets/total assets ratio compared to private banks.
CIB, MIB, NSGB, EAB and EDBE reported earning assets/total assets through 2003-2005
of 80.17%, 86.53%, 88.42%, 87.69% and 83% respectively.
Cairo bank and HDB reported an average of 74.8%, 80.34%.
EALB reported the highest earning assets/total assets ratio for all the banks’ sample with
an average of 89.85% through 2003-2005. This ratio can be misleading as it is due to
granting high percentage of its assets as loans. These loans are mostly non-performing.
NPLs/Gross Loans
NPLs/gross loans showed rates of 12.08% in 2003, 12.58% in 2004 and 15.76% in 2005.
However, the banks’ reporting of NPLs can differ to a great extent from actual NPLs.
Provisions/NPLs
Provisions/NPLs showed rates of 65.55% in 2003, 50.72% in 2004 and 77.46% in 2005.
Assets Breakdown 2005
Ivestment for
trading
7%
T-Bills and T-
Bonds
14%
Due from Banks
11%
Cash and
account held at
CBE
7%
Net Fixed Assets
1%
Investment held
to maturity
5%
Long-Term
Assets
4%
Net Loans
51%
Assets Breakdown 2004
Net Loans
48%
Ivestment for
trading
5%
T-Bills and T-
Bonds
11%
Due from Banks
20%
Cash and
account held at
CBE
7%
Net Fixed Assets
1%
Investment held
to maturity
6%
Long-Term
Assets
2%