ORSRTS16: SRTS Policy 101
•Download as PPTX, PDF•
0 likes•61 views

About the Speakers Kari Schlosshauer Pacific Northwest Regional Policy Manager Safe Routes to School National Partnership Suzanne Hidde School Wellness Policy Coordinator Oregon Department of Education Emma Newman Transportation Planner City of Springfield

Recommended
Recommended
More Related Content
Similar to ORSRTS16: SRTS Policy 101
Similar to ORSRTS16: SRTS Policy 101 (20)
Recently uploaded
Recently uploaded (20)
ORSRTS16: SRTS Policy 101
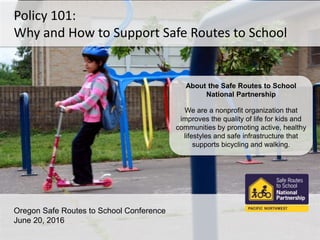
- 1. Policy 101: Why and How to Support Safe Routes to School Oregon Safe Routes to School Conference June 20, 2016 About the Safe Routes to School National Partnership We are a nonprofit organization that improves the quality of life for kids and communities by promoting active, healthy lifestyles and safe infrastructure that supports bicycling and walking.
- 2. Agenda & Outline OUTLINE Why is policy important to Safe Routes to School work? Where can we look and where should we focus? (Kari) How can Safe Routes to School be integrated into state health, wellness, and education policy? (Suzanne) Case study of Safe Routes to School policy work in Springfield, OR – at the district & the city. (Emma) About the Speakers Kari Schlosshauer Pacific Northwest Regional Policy Manager Safe Routes to School National Partnership Suzanne Hidde School Wellness Policy Coordinator Oregon Department of Education Emma Newman Transportation Planner City of Springfield
- 3. WHAT IS SAFE ROUTES TO SCHOOL? The long-term goal of Safe Routes to School programs is to increase the frequency with which students are able to walk, bike, and roll to school.
- 4. WHY WE’RE DOING THIS WORK
- 5. Why we’re doing this work
- 6. RECENT STUDIES: SAFE ROUTES TO SCHOOL WORKS 801 schools in DC, FL, OR, TX • Studied school travel data for five years (2007- 2012) • Control group without Safe Routes programming • Walking & bicycling rates increased: 18% due to engineering improvements + 25% due to education & encouragement programs . = 43% total increase over five years Crash data in NYC • 168,806 pedestrian injuries between 2001-2010 • In census tracts with SRTS programs, pedestrian injury rate decreased 44% between 2009-2010 • No decrease in census tracts without SRTS programs Healthy kids learn better • Physical activity supports academic achievement. • When programs that support transportation are implemented, e.g. Walking School Buses, they can reduce chronic absenteeism rates.
- 7. THE SIX E’S: EQUITY The City of Portland developed a ranking process which considers several criteria to rank schools for Safe Routes to School initiatives. The matrix is used in two distinct classes: programmatic elements (encouragement/education) and capital improvements (engineering). A combination of four basic categories to rank each school: • school demographics • existing conditions • past expenditures • school support Children from low-income families are twice as likely as children from wealthier families to walk to school, but they often face significant traffic and personal safety challenges on the trip to school.
- 8. SAFE ROUTES TO SCHOOL IN OREGON 2001 first time the state directed local government to work with schools to look at safety issues. In 2005, Oregon Legislature established “Safe Routes to School Program”, in preparation for federal funding $1 billion minimum amount of dedicated funding available federally from 2005-12 to state Departments of Transportation across the country $15 million minimum amount allocated for Safe Routes to School infrastructure and non- infrastructure programming between 2005-14 in Oregon 260 number of schools in Oregon that have received some Safe Routes to School funding. (There are more than 1300 schools in Oregon.) 83% of schools in Oregon have not received any Safe Routes to School funding or improvements
- 9. OREGON POLICY & FUNDING CONTEXT • ORS 195.115 – directs local governments to identify barriers to bicycling and walking to schools in their jurisdiction. Reducing barriers for pedestrian and bicycle access to schools. City and county governing bodies shall work with school district personnel to identify barriers and hazards to children walking or bicycling to and from school. The cities, counties and districts may develop a plan for funding of improvements to reduce barriers and hazards identified. • ORS 184.740 & 184.741 / OAR 737-025 – Oregon Legislature established State Safe Routes to School Program and Safe Routes to School Fund Managed by Oregon Department of Transportation (ODOT). No funding has been appropriated by the state. • ODE – School District Transportation Departments (OAR 166-400 Transportation Records) Records document safety hazards and safe routes and monitor student safety when taking school transportation. Records may include but are not limited to safety check records which detail pedestrian routes taken by student to and from school and identify number of traffic lanes, posted speeds, and types of crossings; safe stop reports which identify bus stops with safety hazards; railroad crossing reports which consist of annual reports to the Oregon Public Utility Commission which list location of railroad track crossings on school bus routes, name of railroad, and names of intersecting streets; and related documentation. • ODE Traffic Patrol – Crossing Guard training for adult and student While the primary purpose of traffic patrols is ensuring our students’ safety on their way to and from school, these patrols also provide students with valuable opportunities to develop a sense of responsibility and good citizenship, foster student leadership, and instill important safety lessons. • OSBA – Sample District Wellness Policy and Administrative Regulations
- 10. DISTRICT POLICY WORKBOOK “I wish I’d had a greater understanding of how powerful local school policy could be to advancing the work of Safe Routes to School when I began.” ~ Klamath Falls SRTS Coordinator www.changelabsolutions.org/ safe-routes/welcome Pro-tip: Write this down!
- 12. EVERYTHING IS COMING UP SAFE ROUTES TO SCHOOL
- 13. EVERYTHING IS COMING UP SAFE ROUTES TO SCHOOL Thank You! Kari Schlosshauer Pacific Northwest Regional Policy Manager Safe Routes to School National Partnership kari@saferoutespartnership.org 503-734-0813 saferoutespartnership.org saferoutespacificnorthwest.org Next up: Suzanne Hidde, ODE Then: Emma Newman, Springfield
Editor's Notes
- My work is generously supported by Kaiser Permanente, and my work in the Northwest is primarily focused on some of the more populated areas of Portland Metro, Salem-Keizer, and in SW WA, and in each of these places I work with people in communities, schools, cities and counties and regional and state governments. I also work with a statewide Oregon Safe Routes to School Network – which supports SRTS work that is both ad-hoc as well as grant funded by the state, supporting communities large and small. My main focus and work is to: support schools, youth and families to be able to get around actively and safely Expand Safe Routes to School work Remove barriers for walking and bicycling – through policy change and funding priorities AND Share information and best practices to create positive effects on our youth’s health outcomes
- Starting a Safe Routes to School program is an opportunity to make walking and bicycling to school safer and more accessible for children, including those with disabilities, and to increase the number of children who are able to walk, bike, or roll to and from school and in their community. Every community, often every neighborhood, has a school. Meaning that what helps kids walk to school -- helps everybody access physical activity opportunities in their community. In fact, we partner closely with AARP – because the needs and challenges for older adults are quite similar to those of our youth, and by creating more walkable communities we will benefit everyone. BUT HOW? And WHY?
- A decline that began in the 1970s. (CLICK) take a look at The pink line. Today, just 13% of children ages 5 to 14 walk and bicycle to and from school— a dramatic drop from 1969 when nearly 50% of children walked to school. And, children within a mile of the school, it was close to 90% walking or bicycling. (CLICK) Now, The blue line. As a result, our children aren’t getting the physical activity they need. In addition to the health impacts of inactivity from increased screen time and other modern issues, we see an increase in obesity – that is rising. As we know, physical inactivity is also a key driver of other preventable diseases, such as heart disease, diabetes, breast and colon cancer.
- We now have proof of what many have suspected for years: Active Kids Learn Better.
- In 2014, a study was published in the Journal of the American Planning Association that confirms what we have long known: Safe Routes to School programs are effective at increasing rates of walking and bicycling to and from school. This built on a study from 2013 indicating an enormously reduced pedestrian injury rate in areas with SRTS programs as compared to those without. Importantly, both studies confirmed that comprehensive Safe Routes to School programs that are sustained over time have an ever-increasing impact on rates of walking and bicycling to and from school – that is, to tie the education and encouragement of walking and bicycling to the needed and – hopefully also built infrastructure improvements.
- Every community has a school! But not every community is built the same way, and not everyone has the same opportunities or barriers. *** school demographics (free/reduced lunch rate, communities of color, ESL or newcomer population) – existing conditions (bike & pedestrian network connectivity, bike & pedestrian crash history, active travel history) IN: past expenditures (historical SRTS investment - used for engineering projects only) NI: school support (event participation, school coordinator or principal support - used for programmatic evaluation only)
- HISTORICALLY Program estd in OR >10 years Between 2005-2014 = $1M/year in OR – sometimes for programming, sometimes for engineering, sometimes both. Currently $500K/year dedicated to SRTS for “programming” – i.e. the salary for a local coordinator who would assess a district’s needs, conduct surveys, and implement the plan for education and encouragement, and work with the city or county to get engineering projects on their radar and into the queue for funding. Infrastructure funding – typically occurs through the city or county, which either have a local source of funding (not usually), or would apply for regional or state funding for projects. Not currently a dedicated SRTS funding source for engineering projects. Successful, popular – more-so in the face of declining dedicated funding. But – 83% -- what we’re looking at today is additional levers for institutionalizing SRTS so that it is the standard, not the exception.
- This is a sample of some of the policy context. First item is what set the stage for schools to create a School or District Action Plan The Action Plan gives baseline information about how people are traveling now & what their barriers/opportunities are; and lays out the priorities for education, encouragement, engineering, and so on. As I said before, many schools have action plans. They’re not always up-to-date, so this could be a good place to start a conversation. Similarly, School Transportation Departments are required to document safety hazards, which can include pedestrian routes – but doesn’t always. OPPORTUNITY FOR PH. Crossing Guard – this funding comes from ODE’s Pupil Transportation Department, and is a potential part of every school’s transportation (yellow bus) work. OPPORTUNITY FOR PH. Finally, some wellness policies are including to/from school travel in their physical activity goals. This is a great opportunity to get involved from the school wellness table.
- A long-time SRTS coordinator in Klamath Falls said to me “I wish I’d had a greater understanding of how powerful local school policy could be to advancing the work of SRTS when I began.” There are many ad-hoc things that can and are done, including attending PE teach meetings, providing updates at school board meetings, and connecting with school wellness committees – as we’ll hear more from Suzanne today.
- The District Policy Workbook contains 26 policy provisions. Each policy provision is categorized as "beginner,“ (just getting started), "intermediate,“ (done some SRTS work), or "advanced“ (significant/long-term impact) to assist in navigating the options and finding policy options that are appropriate for each district. The star categorizations are based on each policy's complexity and likely impact on levels of walking and rolling.
- As I said previously, the years of focus on travel to school has created this beloved program. And while there is not a large or dedicated funding source at the moment, we’re seeing the desire for safer routes begin to emerge – here, Oregon DOT is in the process of updating many of its modal plans, and SRTS has come up as a key priority across the state. Many of the strategies in plans such as these call out the need for better partnerships – especially with health. And because of the nature of the program, there are many entry points – education, surveying/evaluation, site assessment and school safety committees. So… what can public health do?
- As I said previously, the years of focus on travel to school has created this beloved program. And while there is not a large or dedicated funding source at the moment, we’re seeing the desire for safer routes begin to emerge – here, Oregon DOT is in the process of updating many of its modal plans, and SRTS has come up as a key priority across the state. Many of the strategies in plans such as these call out the need for better partnerships – especially with health. And because of the nature of the program, there are many entry points – education, surveying/evaluation, site assessment and school safety committees. So… what can public health do?