1. An organization’s culture is critical to its success or failure (Schein, 1992; 1999). Many executives, managers,
employees, and experts intuitively recognize the importance of an organization’s culture for the health of the
organization. However, prior to 1984, there was no hard evidence to prove the relationship between
organizational culture and financial performance results. For over the last twenty-five years, Dr. Daniel Denison
has conducted research to prove the link between organizational culture and financial performance metrics
(Denison 1984; Denison 1990). This Research Note highlights the latest compelling evidence linking
organizational culture to financial performance metrics such as return-on-assets (ROA), sales growth and
market-to-book ratio (MtB), illustrating that a strong and effective organizational culture can provide a
competitive advantage to an organization.
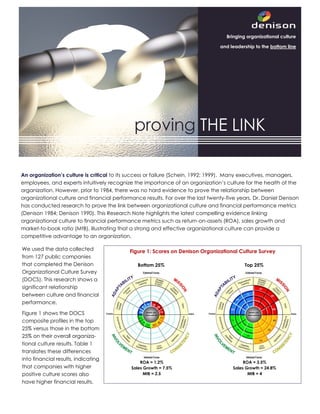
Figure 1: Scores on Denison Organizational Culture Survey
Bottom 25% Top 25%
We used the data collected
from 127 public companies
that completed the Denison
Organizational Culture Survey
(DOCS). This research shows a
significant relationship
between culture and financial
performance.
Figure 1 shows the DOCS
composite profiles in the top
25% versus those in the bottom
25% on their overall organiza-
tional culture results. Table 1
translates these differences
into financial results, indicating
that companies with higher
positive culture scores also
have higher financial results.
ROA = 3.5%
Sales Growth = 24.8%
MtB = 4
ROA = 1.2%
Sales Growth = 7.5%
MtB = 2.5
Bringing organizational culture
and leadership to the bottom line
2. Research Method
To examine the relationship between culture and
performance, we looked at a sample of public
companies surveyed using the Denison
Organizational Culture Survey from 1995 to 2010.
Organizations were removed if there were fewer
than 100 total respondents. Additionally,
organizations were removed if they were a
subdivision of a public company. The result was a
sample of 127 companies in a wide variety of
industries incorporated primarily in the US (86%).
(Research indicates that the DOCS results are
comparable across countries [Denison Consulting,
2012; Denison, Haaland, & Goelzer, 2003]).
Measuring Performance
Once the sample was obtained, the next step was to
measure performance over time. For this study, three
financial metrics were chosen to examine: return-on-
assets, sales growth and market-to-book ratio.
First we took a look at return-on-assets. ROA is the
percentage of profits derived from a company’s
total assets, in other words, ROA tells you how much
profit a company generated for each dollar in assets.
The higher the percentage of ROA, the better the
organization is at using their invested capital, or
assets, to turn a profit. For example, if two companies
independently invest $100,000 in equipment for a
project and one company produces $10,000 in profit
and another produces $15,000, the second
company has a greater ROA.
Second, we took a look at sales growth which is
related to profitability. Sales growth is usually
expressed as the percentage of increased sales from
one year to the next. For example, if we surveyed an
organization in 2000, year 1 was calculated by
subtracting the sales from 1999 from the current sales
year (2000). To get the percentage, we divided the
difference by 1999 sales.
Finally we looked at market-to-book ratio as another
measure of an organization’s financial performance.
The MtB seeks to show the value of a company, by
comparing the book value of a share to the market
value of a share. For example, assume an
organization has $100 Million in assets on the balance
sheet and $75 Million in liabilities. The book value of
that organization is $25 Million. (Assets - Liabilities =
Book Value). If there are 10 million shares
outstanding, each share would represent $2.50 of
book value. If each share sales on the market at $5
(market value), then the MtB would be 2 (because
5/2.5 = 2). Essentially, the market value is the
investment community’s expectations of the worth of
the company.
We predicted that the companies with the higher
scores in the DOCS culture traits of Mission,
Consistency, Adaptability and Involvement would
also have better ROA, sales growth, and MtB ratios
than those with lower scores. To test our hypothesis,
we linked the organizations in our database to
publicly available financial performance data from
Standard & Poor’s COMPUSTAT database.
Performance Measure Bottom 25% Top 25%
Return-on-Assets 1.2% 3.5%
Sales Growth 7.5% 24.8%
Market-to-Book Ratio 2.5 4.0
Table 1: The Results
“Culture matters…
If the organization begins to fail, this implies that
elements of the culture have become
dysfunctional and must change. Failure to
understand culture and take it seriously can
have disastrous consequences for an
organization.”
Edgar H. Schein
The Corporate Culture Survival Guide, 1999, p.3
3. The Results
The results of our analyses show some exciting
findings. As you can see in Table 1, in the year of the
survey, those organizations with the lowest scoring
percentiles for Mission, Consistency, Involvement,
and Adaptability earn $1,200 for every $100,000
spent on assets, while those in the top 25% earned
$3,500. This profitability is also related to how fast
these companies are growing. The sales growth of
the top 25% group was 24.8% versus the bottom
scoring companies at 7.5%. Turning to the MtB ratio,
the investment/ market community is recognizing the
organizations with the higher culture scores are 400%
of book value versus 250% for organizations in the
bottom 25%.
The evidence indicates that the companies with
higher culture scores have better performance in the
year of the survey. But this study also allowed us to
take a look at the longitudinal data and the results
indicate that those high scoring organizations also
perform better in the future. Figures 2, 3, and 4
illustrate how the bottom and top 25% or
organizations rank in their industry (by NAICS code)
over a three year period for each of the three
performance measures.
The graphs indicate that today’s culture affects
tomorrow’s performance. Figure 2 shows that
companies in the top 25% exhibited a slight gain in
industry ROA within a three year period, whereas the
bottom 25% companies displayed an opposite trend.
Figure 3 shows that, as measured by sales growth,
both groups displayed a negative trend but the
bottom 25% experienced a sharper decline than the
top 25% in subsequent years. Figure 4 shows the top
25% remained at a consistent advantage over the
bottom 25% in market value.
Figure 2: Return-on-Assets
Figure 3: Sales Growth
Figure 4: Market-to-Book Ratio
![Research Method
To examine the relationship between culture and
performance, we looked at a sample of public
companies surveyed using the Denison
Organizational Culture Survey from 1995 to 2010.
Organizations were removed if there were fewer
than 100 total respondents. Additionally,
organizations were removed if they were a
subdivision of a public company. The result was a
sample of 127 companies in a wide variety of
industries incorporated primarily in the US (86%).
(Research indicates that the DOCS results are
comparable across countries [Denison Consulting,
2012; Denison, Haaland, & Goelzer, 2003]).
Measuring Performance
Once the sample was obtained, the next step was to
measure performance over time. For this study, three
financial metrics were chosen to examine: return-on-
assets, sales growth and market-to-book ratio.
First we took a look at return-on-assets. ROA is the
percentage of profits derived from a company’s
total assets, in other words, ROA tells you how much
profit a company generated for each dollar in assets.
The higher the percentage of ROA, the better the
organization is at using their invested capital, or
assets, to turn a profit. For example, if two companies
independently invest $100,000 in equipment for a
project and one company produces $10,000 in profit
and another produces $15,000, the second
company has a greater ROA.
Second, we took a look at sales growth which is
related to profitability. Sales growth is usually
expressed as the percentage of increased sales from
one year to the next. For example, if we surveyed an
organization in 2000, year 1 was calculated by
subtracting the sales from 1999 from the current sales
year (2000). To get the percentage, we divided the
difference by 1999 sales.
Finally we looked at market-to-book ratio as another
measure of an organization’s financial performance.
The MtB seeks to show the value of a company, by
comparing the book value of a share to the market
value of a share. For example, assume an
organization has $100 Million in assets on the balance
sheet and $75 Million in liabilities. The book value of
that organization is $25 Million. (Assets - Liabilities =
Book Value). If there are 10 million shares
outstanding, each share would represent $2.50 of
book value. If each share sales on the market at $5
(market value), then the MtB would be 2 (because
5/2.5 = 2). Essentially, the market value is the
investment community’s expectations of the worth of
the company.
We predicted that the companies with the higher
scores in the DOCS culture traits of Mission,
Consistency, Adaptability and Involvement would
also have better ROA, sales growth, and MtB ratios
than those with lower scores. To test our hypothesis,
we linked the organizations in our database to
publicly available financial performance data from
Standard & Poor’s COMPUSTAT database.
Performance Measure Bottom 25% Top 25%
Return-on-Assets 1.2% 3.5%
Sales Growth 7.5% 24.8%
Market-to-Book Ratio 2.5 4.0
Table 1: The Results
“Culture matters…
If the organization begins to fail, this implies that
elements of the culture have become
dysfunctional and must change. Failure to
understand culture and take it seriously can
have disastrous consequences for an
organization.”
Edgar H. Schein
The Corporate Culture Survival Guide, 1999, p.3](data:image/gif;base64,R0lGODlhAQABAIAAAAAAAP///yH5BAEAAAAALAAAAAABAAEAAAIBRAA7)