More Related Content
Similar to Turbidity poster presentation final edit
Similar to Turbidity poster presentation final edit (20)
Turbidity poster presentation final edit
- 1. RESEARCH POSTER PRESENTATION DESIGN © 2015
www.PosterPresentations.com
Turbidity is the cloudiness or haziness of a liquid sample. For this project a
task was given to develop a method to accurately measure turbidity
without the use of the standard equipment, a nephelometer. In order to
accomplish this it was first necessary to understand what causes turbidity
and under what circumstances this measurement would be necessary.
Turbidity is caused by tiny particles suspended in the liquid sample. These
particles scatter incoming light, causing the appearance of cloudiness. The
particles that cause turbidity in water samples are varied and include
organic and inorganic chemical compounds, disinfectant byproducts from
water treatment and microorganisms. Sources for the particles include but
are not limited to agricultural run-off, construction run-off, industrial
discharge both intentional and accidental and municipal water treatment.
With this information it was determined that turbidity would be measured
in two types of circumstances, in a laboratory and in the field. The
methodology developed addresses both of these applications.
Abstract
Introduction
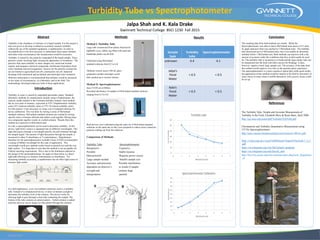
Method I: Turbidity Tube
Large tube constructed from plastic fluorescent
lightbulb cover, rubber cap filled with sand and
handmade plastic secchi disk .
Calibrated using McFarland
standard solutions from 0.5 to 6.0.
Tabletop version used a 100 mL glass
graduated cylinder and paper secchi
disk, pushed up to exterior bottom.
Method II: Spectrophotometer
Jasco V-630 set at 660nm.
Recorded absorbance of samples of McFarland standard solutions
ranging from 0.5 to 6.0
Both devices were calibrated using the same set of McFarland standard
solutions on the same day as they were prepared to reduce errors caused by
particles settling out from the solutions.
Comparison of Methods
Turbidity Tube Spectrophotometer
Inexpensive Expensive
Portable Stable location
Man-powered Requires power source
Large sample needed Smaller sample size
Accuracy and precision Possible interference
dependent on observer’s to results if sample
eyesight and contains large
interpretation particle
Methods
A calibration graph was created from each method. Determination of the
turbidity of the unknown sample was then calculated.
Results Conclusion
The resulting data from both methods are similar. While the
Spectrophotometer was able to detect McFarland units down to 0.5 units,
its upper detection limit was reached at 5 McFarland units. The turbidity
tube functioned up to 6 McFarland units, but it was unable do determine
turbidity below 1 McFarland unit. Both methods can function with a fair
amount of accuracy under the conditions that they would usually be used
for. The turbidity tube is inexpensive to build and the large plastic tube can
be transported into the field with little concern for breakage. It does,
however, require a fairly large sample size. The accuracy of the data from
this method would improve over time as the operator gains experience.
The spectrophotometer is a more expensive option that yields good results,
but application of this method would be limited in the field by proximity of
water source to areas where a mobile laboratory with a power source could
be set up.
References
The Turbidity Tube: Simple and Accurate Measurement of
Turbidity in the Field; Elizabeth Myre & Ryan Shaw, April 2006
http://cas.umn.edu/assets/pdf/Turbidity%20Tube.pdf
Chromaticity and Turbidity Quantitative Measurement using
UV/Vis Spectrophotometer
http://jasco-europe.businesscatalyst.com/assets/uv-0014-e.pdf
https://water.usgs.gov/owq/FieldManual/Chapter6/Section6.7_v2.1
.pdf
https://en.wikipedia.org/wiki/McFarland_standards
https://en.wikipedia.org/wiki/Secchi_disk
http://bcrc.bio.umass.edu/intro/manual/index.php/Gene_Regulation
_II
Turbidity in water is caused by suspended particulate matter. Standard
laboratory methods for measurement include using a Nephelometer, the
Jackson candle method or the Formazin turbidity method. Each method
has its own units of measure, expressed as NTU (Nephelometric turbidity
units) JTU (Jackson turbidity units) or FTU (Formazin turbidity units).
For this project, it was necessary to create a set of standard solutions for
device calibration. This was done by mixing a series of McFarland
standard solutions. McFarland standard solutions are created by mixing
specific ratios of barium chloride and sulfuric acid together. Mixing these
two compounds together results in a turbid solution. ‘Results from this
method are expressed in McFarland units.
In a lab, a spectrophotometer can be used to determine turbidity. In this
device, light from a source is separated into its different wavelengths. This
light then passes through a wavelength specific slit and continues through
the sample liquid. The amount of light that passes through the sample is
measured in either % absorbance or % transmittance. Manufacturer
literature for the spectrophotometer available (Jasco V-630) recommended
a setting of 660nm wavelength for this type of application. This
wavelength would give optimal results based on particle size and the way
light scatters. It is important to note that this method is not acceptable for
Federal reporting requirements. This is due to the limitations inherent to
the design of the spectrophotometer. Its angle of observation is a direct
light path allowing it to measure transmittance or absorbance. For
measuring turbidity accurately, a nephelometer has an offset light sensor to
measure light scatter.
In a field application, a low cost method commonly used is a turbidity
tube. Instead of a computerized device, it relies on human eyesight to
determine the turbidity level of the solution. This device works by
allowing light to pass through a clear tube containing the sample. The
bottom of the tube contains an optical pattern. Turbid solution is added
until the observer can no longer see this pattern through the solution.
Gwinnett Technical College BSCI 1230 Fall 2015
Jalpa Shah and K. Kala Drake
Turbidity Tube vs Spectrophotometer
0
10
20
30
40
50
60
0 1 2 3 4 5 6 7
mLofsample
McFarland Units
Turbidity tube
0
0.1
0.2
0.3
0.4
0.5
0.6
0.7
0.8
0 1 2 3 4 5 6 7
Absorbance
McFarland units
Spectrophotometer Calibration
Sample
type
Turbidity
tube
Spectrophotometer
unknown 4.4 4.1
Jalpa’s
Pond
Water
< 0.5 < 0.5
Kala’s
Pond
Water
< 0.5 < 0.5