1-92
- 1. What Gives SEM Staying Power?
Julia Vetromile, DNV GL
Steve Phoutrides, Northwest Energy Efficiency Alliance
ABSTRACT
Strategic energy management (SEM) programs have been in existence long enough that
we can consider how well SEM management practices persist over time. Companies
participating in such programs are achieving energy and cost savings above business as usual,
yet the goal of maintaining SEM practices remains elusive. What encourages companies to stay
with it?
The purpose of this paper is to identify and demonstrate the links that lead toward or
away from ongoing SEM using results from the evaluation of the Northwest Energy Efficiency
Alliance (NEEA) industrial SEM initiative, which began in 2005 with data collection starting in
2006. As part of this initiative, NEEA supported the development of the Northwest Food
Processors Association (NWFPA) Energy Roadmap program, which was designed to draw
manufacturers to SEM. NEEA developed a series of market progress indicators to assess the
long-term effect of this initiative. The study to assess these indicators, as well as the savings
achieved, provided insight on both how and why organizations are implementing all or some
elements of SEM.
Using the long-term data in the evaluation, we looked at persistence of SEM practices
among the participants of NEEA and Energy Roadmap programs. We were able to compare the
practices of Energy Roadmap participants with the general population of Northwest industrial
food processors who did not participate in a SEM program, which allowed us to analyze the
most frequently adopted SEM elements. For further comparison, we looked at persistence in the
US Department of Energy (DOE) Superior Energy Performance®
program, which also has SEM
elements. This paper explores implications for program design and the value of SEM programs.
Introduction
In the Pacific Northwest, a regional effort to engage industry in SEM began over ten
years ago. The Sixth Power Plan of the Northwest Power and Conservation Council recognized
continual energy improvement measures as an energy efficiency resource (Cadmus 2011). NEEA
began an industrial initiative in 2005, and Energy Trust of Oregon and Bonneville Power had
SEM programs in place by 2010 (Cadmus 2011). This history provides a foundation for
evaluating the effectiveness and longevity of SEM, and to consider ways to improve it. In
particular, NEEA’s Industrial Initiative provides a basis for considering the elements of SEM,
how SEM is adopted, and factors that may indicate long-term acceptance. NEEA continued the
industrial initiative through 2013. At first, the initiative considered the entire industrial sector,
and then selected two industries for a more focused effort: food processing and pulp and paper
mills. After four years, few of the paper mills were responding, and NEEA focused further
efforts on the food processing industry. The program’s longevity, documented and supported by
eight evaluation reports, allows us to examine the persistence and long-term uptake of SEM
practices. DNV GL led the evaluation of the industrial initiative in 2012 and 2013 (DNV KEMA
2014). Findings from this evaluation form the basis for this paper, which considers ways to
improve SEM.
1-1©2015 ACEEE Summer Study on Energy Efficiency in Industry
- 2. In any business, there are many factors, such as management changes, organizational
reorganizations, and marketplace trends that affect how a business is run and its priorities. This
includes whether to maintain SEM activities. How can SEM compete with other priorities and be
incorporated into normal business practice, and not abandoned when priorities shift?
NEEA aimed to encourage companies to adopt SEM by equipping them with the tools
and technical services to improve their energy performance continually. Companies with more
than one facility had the option to participate with some or all facilities in the NEEA program.
Over the life of the program, the facilities across all companies that participated became a cohort,
receiving shared training and support services. The facilities that participated directly with
NEEA as the SEM cohort received the services of expert consultants who assisted in goal setting
and planning, finding opportunities, implementing energy efficiency actions, tracking energy
consumption, training, and reporting progress. By providing much more than financial
incentives, NEEA aimed to transform the market.
To assess whether a company had adopted SEM, NEEA developed four criteria to
identify SEM practices:
• Existence of goal setting in relation to energy use or energy reduction goals
• Existence of executive commitment, showing dedication by senior management of staff
resources such as an energy efficiency manager or champion
• Appropriate training to help achieve the established goals
• Tracking of progress toward the goal, i.e., tracking energy use and regularly reporting
progress to senior management
In addition to the facilities that engaged directly with NEEA, NEEA supported the
NWFPA in the development of their Energy Roadmap program. This program encouraged
member facilities to take on energy management goals, track energy usage, and engage in
practices leading to SEM. The requirements for participation in the Energy Roadmap were not
as demanding and less technical training support was provided to participants. The existence of
these two programs in the same market allowed for assessment of how SEM is affecting the
population of food processors in the Northwest. The population is now composed of businesses
that engaged directly with NEEA as part of a cohort implementing SEM, facilities participating
in the NWFPA Roadmap, and nonparticipants.
This paper describes the persistence of SEM with cohort facilities and with the NWFPA
Roadmap participants. Next, the paper considers persistence of energy management in other
programs, particularly DOE’s Superior Energy Program. Finally, conclusions about persistence
in energy management programs are presented.
Program Engagement in SEM
Engaging firms to participate in energy efficiency is the first challenge for industrial
energy efficiency programs. NEEA set goals to engage 13% of the large food processor market
by the end of 2009 (Cadmus 2009). For its Industrial Initiative, NEEA cast a wide net across
multiple industries targeting facilities with more than 250 employees. In the first few years,
NEEA focused on the food processing sector as it was the most interested. In order to establish
the presence of SEM in a facility, an organization must set goals and make progress toward those
goals as part of their participation in the SEM initiative. Although over 30 facilities engaged
initially, more than half of these facilities did not progress to full participation in SEM as defined
1-2 ©2015 ACEEE Summer Study on Energy Efficiency in Industry
- 3. by the four criteria above. Fifteen food industry processors were identified as reaching the full
level of participation in SEM at some point during the program life. By 2013, 11 facilities were
participating, and two of these clearly were less active by 2013 than they were previously.
However, nine were actively participating in 2012 and 2013, and could logically continue
participation for another two years or more. The formal program ended in 2013.
To assess the level of engagement of the cohort facilities, the evaluation team developed
case studies based on interviews with representatives of the three firms (called A, B and C)
participating in the SEM cohort in 2012 and 2013. Facility energy champions and corporate
energy sponsors were interviewed, as well as one executive corporate sponsor.
In the realm of planning, all three firms agreed to goals of reducing energy consumption
by 25% over 10 years and all reached out to employees to encourage energy efficiency. Two out
of three companies were much more active (Firms A and B), collaborating across facilities about
energy management. Both of these firms had designated an executive as corporate energy
sponsor who regularly attended internal team meetings focused on energy management. Firm C
had a management change, and results of the interview indicated that energy efficiency had
become a lower priority by 2013 than in previous years in the program. For example, the
corporate sponsor rarely attended energy efficiency team meetings after the change.
The pattern of two more active firms engaging more deeply in energy efficiency actions
was also apparent in the execution of SEM. All firms stated that they pursued energy-saving
actions, although firm C completed the fewest energy efficiency retrofit projects. Another
obvious difference between the more active and less active firms was the person who
implemented energy efficiency measures. At firms A and B, employees were empowered to save
energy, and input was sought from staff throughout the organization. These activities were not
occurring at firm C, based on their responses provided in interviews.
The measurement and review activities showed differences between the three firms. All
three organizations reviewed energy key performance indicators regularly, but firm B seemed to
take the most action, employing intensive energy monitoring systems that include real-time
gauges and dashboards for production staff and daily review of energy performance indicators
between corporate and facility level managers. One contact from firm C identified a lack of
training and motivation to take corrective actions following identification of energy management
issues. Firm C linked facility savings to employee bonuses, but their annual savings were less
than other firms. One possible explanation is that team meetings resulted in more activity than
the more passive bonus system.
The SEM program emphasized continual improvement, and all the participants took
actions designed to save energy. At all three firms, staff were engaged in identifying savings
opportunities, although for Firm C this was limited to maintenance staff while the other firms
involved facility energy teams and technical staff across the facility. Energy champions at firms
A and B shared project ideas at quarterly energy meetings, and firm A included energy outcomes
in Six Sigma projects. Firms A and C pursued ENERGY STAR®
recognition. Although
generally less engaged in SEM, firm C apparently valued energy reduction as a customer facing
value option.
Overall, firm C kept SEM practices at the mid-management level, with less executive
involvement, fewer resources allocated, and training aimed at a high level rather than drilling
down to standard operating procedures. Firms A and B demonstrated management commitment,
and engaged more staff in SEM.
1-3©2015 ACEEE Summer Study on Energy Efficiency in Industry
- 4. As the formal program and accompanying technical support was ending, the firms
expressed concerns about being able to sustain SEM practices. Firms A and B were concerned
about the focus on energy efficiency decreasing as opportunities were saturated. They also were
concerned about losing the support of the program implementer who reviewed and updated their
improvement plan. At firm A, staff turnover resulted in a gap in the energy champion role. Firm
B was concerned about tracking savings in the future, especially for smaller projects.
Program savings achieved were significant at 4% of energy consumption for most of the
years in which the program was active. Savings for each facility were estimated using modeled
baseline period energy consumption for that facility without program activity compared to
modeled consumption during the program; program savings were the sum of all of the facility
savings. Savings were achieved through a variety of energy efficiency actions, including capital
and retrofit projects and behavioral and management actions. Savings were separately identified
for capital/retrofits and all other SEM activities. In 2012 and 2013, program savings for
capital/retrofit activities were 3%, with all other SEM savings approximately 1% of baseline.
The fact that some facilities pulled out of the program or reduced their efforts over time
may reflect the difficulty of long-term full implementation of SEM despite its financial
advantages. Even with a high level of support for the NEEA program, other priorities may
overtake priorities associated with SEM.
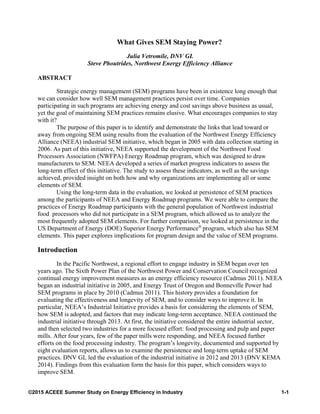
As an indication of the persistence of SEM activity, the NEEA cohort participation over
the program was reviewed over the lifetime of the program. Figure 1 shows the number of years
of participation to date of the three firms, as well as estimates for further engagement in SEM for
the most active facilities. The active facilities with firms A and B were assumed to continue to
engage fully in SEM another two years, while the less active firm C was assumed to cease
engaging in SEM at the end of the program. Considering only the participation from program
inception through 2013, SEM engagement averaged 3.3 years (blue horizontal line in Figure 1).
With the estimated further participation of firms A and B, the overall average increases to 4.5
years (red horizontal line).
Figure 1. Actual and Assumed Likely Future Participation
0
1
2
3
4
5
6
7
1 2 3 4 5 6 7 8 9 10
YearsEngagedinSEM
Firms in the Initiative
Participant Engagement in SEM
Estimated Additional
Years of Participation
Years of Participation to
Date
Average 4.5 years
Average 3.3 years
1-4 ©2015 ACEEE Summer Study on Energy Efficiency in Industry
- 5. The case study results suggest elements of SEM adoption that lead to greater persistence
of SEM activity. First, commitment by executive leadership and integration into core strategies
of the organization improve the likelihood of SEM continuing, as with Firms A and B. This is
consistent with previous findings on best practices for energy efficiency in industry (Prindle
2010). Without management commitment, SEM is vulnerable to the next corporate
reorganization and shifting priorities, as appeared to be the case with Firm C. Second, engaging
the entire plant staff in energy efficiency practices yields more actions to reduce consumption.
When only part of the facility cares about efficiency, it’s much easier for other priorities to
dominate, especially when the production team (typically the most influential on setting
priorities) is left out. At Firms A and B, more actions were identified including operational
changes likely identified by a broader range of staff. Third, facilities used to program support
may find developing new opportunities a challenge without outside assistance. Finally, full
engagement in SEM, beyond a program, requires the facility to adopt the practices as normal
business practice. It’s not enough for companies to take on the aspects of SEM; it needs deeper
integration into the organization to persist.
NWFPA Participants
In an effort to help accelerate the diffusion of SEM practices, NEEA initiated a “cluster
partnership” with the NWFPA prior to 2010 (DNV KEMA 2014). NEEA supported the
development of the NWFPA’s Energy Roadmap program, which provides technical guidance to
its members in reducing energy use and costs. The program challenges participating NWFPA
members to reduce their energy intensity by 25% in 10 years. Participants agree to submit energy
usage data to the NWFPA so that their progress toward the energy reduction goal can be tracked.
According to the NWFPA, the Energy Roadmap “is a strategy to achieve the energy intensity
reduction goals [through] collaboration and input by our partners - federal, states, NEEA, ETO
(Energy Trust of Oregon), utilities, suppliers, and others” (NWFPA 2014). We hypothesize that
being part of an association with a long term goal that can be achieved by SEM is a way to
ensure it will persist long term.
To evaluate the experiences and effectiveness of this program, we surveyed Northwest
food processing facility representatives regarding current SEM practices and whether they
participated in the Energy Roadmap, the influence of the Roadmap on energy management at
their facilities, and, for participants, the likelihood that they would continue participating.
Conducted in mid-2013, the survey also addressed the depth of SEM practices at interviewed
facilities.
Facility, production, and energy managers representing 37 facilities were interviewed.
Respondents from 26 facilities recalled participating in the Energy Roadmap. Firms not self-
identified as participating in the Roadmap or NEEA’s program were considered the “balance of
the market.” The facilities contacted are large plants that nearly all run year round and employ
on average of more than 700 people.
For Roadmap participants, results show that executives and plant managers were
typically the individuals responsible for beginning Roadmap activities at their company. Most
facility representatives planned to continue their participation in the Roadmap at all their
facilities. Over two-thirds indicated they would not have implemented energy management
without the roadmap. The surveys showed that Roadmap participants were more likely to
1-5©2015 ACEEE Summer Study on Energy Efficiency in Industry
- 6. undertake various energy management activities and at a deeper level than those who were not
participating in the Roadmap.
The practices identified as components of SEM were generally more prevalent among the
self-identified Roadmap participants than in the balance of the market. For example, more than
half of Roadmap participants established energy management goals and provided training to
staff, while one-third or less of the balance of market took these actions. More than 40% of
Roadmap participants implemented all four aspects of SEM as discussed in the introduction, but
only 10% of the balance of market reported doing this. Another area where Roadmap
participants significantly differed from the balance of the market was in reporting progress to
management, where more than 75% of Roadmap participants but only 43% of the balance of
market did. The NWFPA Roadmap participants showed significantly larger percentages of
activity in the execution phase, where actions result in improved energy efficiency.
These results suggest that firms are more likely to engage deeper in SEM with the
support of a program like the Energy Roadmap.
Market Progress
NEEA sought to understand how the balance of the food processing market, as well as
NWFPA members, were affected by regional SEM activities. Focusing on facilities with more
than 150 employees in the Pacific Northwest, the evaluation identified a population of 193
facilities (Evergreen Economics 2012). About one-fourth of these facilities (50) had taken part in
the NWFPA Energy Roadmap program.
Approach
The evaluation considered short-, medium-, and long-term market progress indicators to
assess how facilities outside of the industrial initiative cohort were engaging in activities leading
towards SEM.
Short-term market progress indicators include the following:
• awareness of SEM
• the pace of adoption of energy efficiency measures
• implementation of ISO 50001
• committing to the NWFPA Energy Roadmap.
In the medium term, a key market progress indicator was whether Roadmap participants
were increasing the scope of energy management activities. The initiative’s long-term goal is to
transform the standards of practice of large food processor market to include SEM.
Findings
Overall, findings from the short-term market progress indicators showed that while
facility managers and staff engaged in some forms of energy management, they generally are not
aware of SEM in general. Figure 2 shows the short-term results.
1-6 ©2015 ACEEE Summer Study on Energy Efficiency in Industry
- 7. Figure 2: Short-Term Market Progress Indicators and Corresponding Survey Results
Fewer than one in three surveyed energy managers reported being familiar with SEM as a
system of practice that includes setting goals, dedicating resources, and reporting on progress
toward goals. The goals set were as likely to be from DOE as from the company or facility.
DOE’s recommended goal of 25% improvement in 10 years is consistent with the NWFPA
Roadmap goals. The initiative also promoted ISO 50001, which is an international standard for
implementing energy management systems, to the market as a potential model demonstrating the
importance of a systematic approach to energy management. No companies reported adopting
ISO 50001; this is consistent with slow national uptake of this 2011 standard. However, 90% of
companies with corporate-level staff involvement reported that they encouraged and provided
resources for energy management, as well as reviewed progress toward energy goals, which are
key aspects of SEM.
Industrial facilities did report actively choosing equipment-based energy-efficient
options, with 94% indicating they replaced worn out equipment with energy-efficient equipment.
Survey respondents indicated these activities are the result of concern for energy usage.
To assess how many surveyed food-processor facilities were implementing SEM, the
evaluation team asked about four key indicators of SEM:
• Did the facility set energy saving goals?
• Does the facility train staff in efficiency?
• Does the facility have an energy manager?
• Does the facility report energy use to top management?
Figure 3 shows the results of this 2013 survey, indicating how many facilities
participating in the various combinations of these four activities over the previous year.
MPI Description Variable n %
End Users Aware of SEM Aware of SEM as a practice 67 30%
Install EE Equip 67 48%
Capital project just for EE 67 79%
Replace with EE 67 94%
Aware of SEM and Heard of ISO 50001 67 27%
Facility ISO certified 67 0%
Members of NWFPA 67 78%
Participating in Energy Roadmap 67 36%
Recall participating in Roadmap 67 19%
Plan to continue participation in
Roadmap
67 15%
Increased Uptake of
Measures
NWFPA Members
Commit to Energy
Roapmap
End Users Implement ISO
50001
Roadmap
1-7©2015 ACEEE Summer Study on Energy Efficiency in Industry
- 8. Figure 3: Energy Roadmap Participants and Balance of Market
Facility Implementation of Activities Used to Indicate SEM Engagement
Only 27% of participating Energy Roadmap and balance of market facilities were
implementing all four indicators of SEM at some level in 2013. This is consistent with findings
in 2011, indicating persistence at this level. The indicators of SEM are defined as all those
facilities with energy goals, energy efficiency training, a designated energy manager, and
reporting of energy use to top management. The remaining 45% of respondent facilities adopted
between one and three elements of SEM. Approximately 28% of facilities surveyed had no
activities that were an indicator of SEM.
Another indicator of relative strength of energy management at a facility is the level of
responsibility and resources assigned. The market survey found that although 97% of facilities
reported an energy champion, only 36% identified an energy manager. Energy-related
responsibilities for energy managers are likely to be greater than for energy champions. This
finding is consistent with lack of focus on energy management among the sampled facilities,
with less than one-third implementing all four aspects of SEM, as noted earlier.
This market progress assessment indicates that the transformation and persistence of
SEM is supported by program activity such as the NEEA and NWFPA programs. Very little
SEM activity outside of these sources was happening. With a program like the NWFPA
Roadmap, participants increased the depth of participation in SEM activities, although the one-
in-three level of participation was unchanged from the previous two surveys conducted in 2010
and 2011 (Cadmus 2011, ERS 2012). Based on these three surveys, the balance of market was
not moving toward more SEM engagement. This indicates the importance of direct intervention
in moving SEM forward.
Indicators Count Total %
Set energy
reduction
Goals
Training
provided to
staff
Energy
Manager
Designated
Reporting
progress to
top
management
Total 67 100% 43% 52% 36% 61%
Goals, Training, Manager, Reporting 18 27% 27% 27% 27% 27%
Goals, Manager, Reporting 1 2% 2% 2% 2%
Goals, Training, Reporting 4 6% 6% 6% 6%
Goals, Reporting 4 6% 6% 6%
Manager, Reporting 2 3% 3% 3%
Training, Manager 3 5% 5% 5%
Training, Reporting 8 12% 12% 12%
Goals 2 3% 3%
Reporting 4 6% 6%
Training 2 3% 3%
No indicator of SEM 19 28%
SEM Indicators Market Acceptance
1-8 ©2015 ACEEE Summer Study on Energy Efficiency in Industry
- 9. Persistence in Other Energy Management Programs
One of the challenges for considering persistence in strategic energy management is the
relatively new emergence of this type of program. Continual energy improvement is not a new
concept, but programs with an energy management framework are recent market entries, with
NEEA’s as one of the first. BC Hydro, Energy Trust of Oregon, American Electric Power of
Ohio, and Bonneville Power Administration have also begun SEM programs in the last few
years. Generally, there is not enough data yet from these programs to assess how long firms
typically engage in SEM activities. One program with public data available is DOE’s Superior
Energy Performance (SEPTM
) program. The SEP program is a voluntary program designed to
provide an accepted and transparent system for verifying energy management and energy
performance achievements and practices. The program requires participants to implement the
international standard for energy management, ISO 5001. Facilities are certificated by an ANSI-
ANAB accredited third party, for both management practices and energy performance
improvement (DOE 2015a). A significant management and resource commitment is necessary to
become certified. Subsequent re-certification is expected to require less effort once the
management system and improvement processes are in place. Also, the financial value to the
certified facilities is significant; a 2013 study of nine facilities certified found that cost savings
averaged approximately $500,000 per year with less than a two-year payback (Therkelson et al.
2013). Therefore, one would expect to find a high level of persistence of energy management
practices, as demonstrated by re-certification.
Because the program was released in mid-2011, there is limited data on recertification.
DOE began certifying facilities as part of a pilot initiative from 2008 through 2010. A total of
four plants achieved certification through 2011 (Texas Industries of the Future 2011). The DOE
website shows 28 facilities from 17 companies are currently certified (DOE 2015b). One of these
began with the program as part of the pilot program. The certification for the other three
participants in the pilot has apparently lapsed. The fact that only one of the pilots recertified to
date is surprising given the high level of qualitative and quantitative benefits documented
(Therkelson et al. 2013). This suggests that even when the cost benefit ratio is good, the
persistence of energy management engagement is not guaranteed.
Conclusions
Several conclusions and insights can be drawn from this review of persistence of SEM
activities:
• SEM leads to persistent savings over time. With programs and continued engagement,
significant savings can be achieved, as seen in NEEA’s cohort industrial initiative and the
NWFPA Energy Roadmap. Similarly the SEPTM
program found high levels of cost and
energy savings for participants.
• Executive sponsorship yields better results and longer persistence. The firms that
continued executive interaction with facility energy teams had better persistence. When
management interest turned elsewhere, activity around SEM reduced. Possibly board of
directors involvement would improve persistence further.
1-9©2015 ACEEE Summer Study on Energy Efficiency in Industry
- 10. • Participants valued long term technical support. Participants valued support
developing action plans and identifying opportunities. Tracking energy consumption is a
good way to begin the engagement.
• Cost savings are not sufficient for organizations to continue with SEM. Energy costs
alone are simply not large enough to be a high enough priority. Both DOE and NEEA
program participants apparently ceased engaging, despite past savings.
• Programs requiring participants to engage fully with SEM leads to the highest
adoption of energy management components and energy performance
improvements. Less engaged programs that encourage adopting at least some elements
of SEM also result in more SEM activities than the rest of the market.
• Engagement in voluntary programs is subject to shifts in management priorities.
Persistence in voluntary energy management may be limited by the marketplace
perception of its value, regardless of the economic and non-energy benefits.
The long-term challenge for SEM is to move beyond its conceptualization as a new management
strategy instead of a normal business practice. If SEM is seen as a new management focus, it will
only last as long the new focus. The challenge for SEM is for it to become embedded in the
cultural and operational mindset of the company so that when the new “flavor of the month”
management approach is introduced, energy continues to be managed strategically as a
controllable expense, even while management is promoting priorities from the newest business
strategy.
References
Cadmus Group Inc. 2009. Market Progress Evaluation Report #5. Evaluation of the Industrial
Efficiency Alliance. Prepared for NEEA. May 1, 2009.
Cadmus Group Inc. 2011. Market Progress Evaluation Report #6. Evaluation of NEEA’s
Industrial Initiative. Prepared for NEEA. January 28, 2011.
DOE (US Department of Energy). 2015a. Achieving Superior Energy Performance: Qualifying
for Superior Energy Performance 2015 [cited March 2, 2015].
http://www.energy.gov/eere/amo/about-sep
——— . 2015b. Certified Facilities. Superior Energy Performance. [cited May 25, 2015].
http://www.energy.gov/eere/amo/certified-facilities
DNV KEMA Energy and Sustainability and Research into Action. April 29, 2014. Northwest
Energy Efficiency Alliance Industrial Initiatives Market Progress Evaluation Report #8.
http://neea.org/docs/default-source/reports/neea-industrial-initiatives--market-progress-
evaluation-report-8.pdf?sfvrsn=8.
Evergreen Economics 2012. Database of Northwest Manufacturers, Nurseries, and Wineries.
Report to NEEA. July 9, 2012.
1-10 ©2015 ACEEE Summer Study on Energy Efficiency in Industry
- 11. Energy and Resource Solutions 2012. Market Progress Evaluation Report #7. Evaluation of
NEEA’s Industrial Initiative. Prepared for NEEA. August 12, 2012NWFPA (Northwest Food
Processing Association). April 21, 2011. NWFPA Energy Roadmap.
http://www.nwfpa.org/priorities/energy/energy-roadmap
Prindle, William. (Pew Center on Climate Change). 2010. From Shop Floor to Top Floor: Best
Business Practices in Energy Efficiency. April. http://www.pewclimate.org/energy-
efficiency/corporate-energy-efficiency-report.
Therkelsen, P., R. Sabouni, A. McKane, and P.Scheihing. July 2013. Assessing the Costs and
Benefits of the Superior Energy Performance Program. ACEEE Summer Study on Energy
Efficiency in Industry, Niagara Falls, NY.
Texas Industries of the Future. 2011. Superior Energy Performance [cited March 2, 2015].
http://texasiof.ceer.utexas.edu/pilotprogram.htm
1-11©2015 ACEEE Summer Study on Energy Efficiency in Industry