
Recommended
Recommended
More Related Content
What's hot
What's hot (14)
Similar to IDFC Dynamic Equity Fund Quarterly Update
Similar to IDFC Dynamic Equity Fund Quarterly Update (20)
More from JubiIdfcHybrid
More from JubiIdfcHybrid (20)
Recently uploaded
Recently uploaded (20)
IDFC Dynamic Equity Fund Quarterly Update
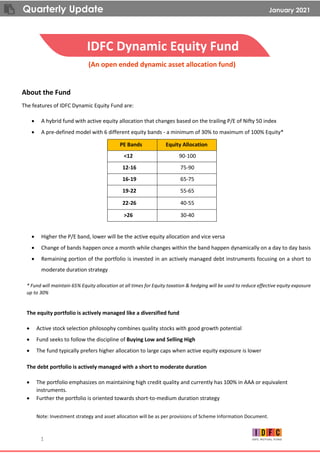
- 1. Quarterly Update January 2021 1 IDFC Dynamic Equity Fund (An open ended dynamic asset allocation fund) About the Fund The features of IDFC Dynamic Equity Fund are: • A hybrid fund with active equity allocation that changes based on the trailing P/E of Nifty 50 index • A pre-defined model with 6 different equity bands - a minimum of 30% to maximum of 100% Equity* PE Bands Equity Allocation <12 90-100 12-16 75-90 16-19 65-75 19-22 55-65 22-26 40-55 >26 30-40 • Higher the P/E band, lower will be the active equity allocation and vice versa • Change of bands happen once a month while changes within the band happen dynamically on a day to day basis • Remaining portion of the portfolio is invested in an actively managed debt instruments focusing on a short to moderate duration strategy * Fund will maintain 65% Equity allocation at all times for Equity taxation & hedging will be used to reduce effective equity exposure up to 30% The equity portfolio is actively managed like a diversified fund • Active stock selection philosophy combines quality stocks with good growth potential • Fund seeks to follow the discipline of Buying Low and Selling High • The fund typically prefers higher allocation to large caps when active equity exposure is lower The debt portfolio is actively managed with a short to moderate duration • The portfolio emphasizes on maintaining high credit quality and currently has 100% in AAA or equivalent instruments. • Further the portfolio is oriented towards short-to-medium duration strategy Note: Investment strategy and asset allocation will be as per provisions of Scheme Information Document.
- 2. Quarterly Update January 2021 2 During the quarter, the fund underperformed the benchmark (50% S&P BSE 200 TRI + 50% NIFTY AAA Short Duration). • Overweight call in IT sector where the migration to digital and cloud is providing a strong tailwind to the entire sector. • Select IPO investments which resulted in disproportionate returns in the quarter. • The fund continued to reduce its active equity weight throughout the quarter, from 40% as of September 30th to 37% at the year end. With all indices reporting double digit returns for the quarter, the reduced active equity weight resulted in lower returns. • Underweight call in Financials which had aided the performance in previous quarters impacted negatively in the current quarter as the sector delivered around 50% return in the Oct-Dec’20 quarter. Sep-20 Sector/Weight Fund Benchmark OW/UW Fund Health Care 11.2% 5.6% 5.6% 14.9% -3.8% Telecommunication Services 5.8% 2.1% 3.7% 5.9% -0.2% Cement / Building Mat 6.2% 2.5% 3.7% 6.1% 0.1% Information Technology 17.2% 13.8% 3.4% 17.8% -0.5% Auto 7.0% 5.8% 1.2% 7.6% -0.6% Commodities 3.8% 4.0% -0.2% 4.5% -0.7% Consumer Discretionary 4.2% 5.6% -1.4% 1.1% 3.1% Consumer Staples 7.7% 9.2% -1.5% 9.0% -1.3% Industrials 2.6% 4.4% -1.8% 3.2% -0.6% Utilities 1.0% 3.3% -2.3% 0.0% 1.0% Energy 6.9% 9.7% -2.8% 8.9% -2.1% Financials 26.5% 34.0% -7.6% 20.8% 5.6% Dec-20 Change during the Qtr During the quarter the fund increased exposure towards Financials, Consumer Discretionary and Utilities primarily, while reducing exposure towards Health Care, Energy and Consumer Staples. % return during the quarter Dec-20 Fund 8.1% Benchmark - 50% S&P BSE 200 TRI + 50% NIFTY AAA Short Duration 14.5% Nifty 50 TRI 24.6% Nifty Mid cap 100 TRI 22.9% Nifty Small cap 100 TRI 21.9% Market cap mix Fund S&P BSE 200 OW/UW Large cap 75% 88% -13% Mid cap 15% 12% 3% Small cap 10% 0% 10% What worked Performance Update Key changes during the quarter What did not work
- 3. Quarterly Update January 2021 3 • We continue to maintain our overweight stance in Health Care sector, although we have selectively reduced our exposure to the sector. The sector is expected to continue to benefit from regulatory tailwinds while complex approvals in US and bottoming of growth in Indian markets will be additional levers. • Information Technology as a sector is another potential beneficiary of Covid related disruption where the trend to digitalization has got accelerated. Indian IT companies have been able to capitalize on this and may continue to benefit in the medium to long term. • There is a rebound in economic activity as Covid cases continue to decline in the country. To play this cyclical recovery, the fund has an overweight stance on cement and automobile sector. • Financials continued to remain an underweight sector although the weight of the sector in the fund increased due to both active weight addition as well as stock price performance. We will continue to remain watchful as Banks/NBFCs may report higher slippage in the coming quarter as moratorium period ends. Portfolio Metrics Fund Benchmark – S&P BSE 200 Commentary PB Ratio 4.9 3.0 P/B ratio appears higher due to exposure to the private sector Financials & Consumer Discretionary. Source: Bloomberg, Based on trailing 12 months data The fund continued to generate healthy returns over 1/2/3 year period ending 31 Dec‘20. During Sep- Dec’20 quarter, the fund underperformed its benchmark and Nifty as markets continued to inch up one way as the fund’s active equity exposure was in the lowest band. The fund continues to stick with its philosophy of “buying low selling high” and will remain disciplined and agile in increasing/decreasing active equity depending on how valuations move. Just to refresh, the fund started the year with 46% active equity, increased equity as markets corrected going all the way to 79% on 03 Apr’20 when Nifty 50 was at 8,084 levels. After capturing the up-move in the month of Apr-May’20, the fund has been reducing equity with the current allocation of 37% as on 31 Dec’20. Below table captures how the Equity Band have changed on YTD basis: Date Nifty Index level Active Equity Band for following month 31-Dec-20 13,982 30% - 40% 28-Nov-20 12,969 30% - 40% 31-Oct-20 11,642 30% - 40% 30-Sep-20 11,248 40% - 55% 31-Jul-20 11,073 40% - 55% 30-Jun-20 10,302 55% - 65% 29-May-20 9,580 65% - 75% Fund Manager Commentary Portfolio stance – Key sectors Fund – Key metrics
- 4. Quarterly Update January 2021 4 30-Apr-20 9,860 65% - 75% 31-Mar-20 8,598 75% - 90% 28-Feb-20 11,202 55% - 65% This active rebalancing helped the fund in limiting the downside by having lower active equity exposure; while participating significantly in the upside due to higher active exposure. Last quarter, the markets saw a significant upmove without much volatility, as a result the fund had only 33% participation. As the chart below indicates, the fund participation in downside was restricted to 63%, 56% and 26% in three phases of correction while upside capture was higher at 74%, 59% and 33% in the consecutive market rebound – leading to higher than 100% (117% for the period) capture ratio. Source: Bloomberg For the quarter/year going forward: • With the current run-up in the market, valuations have again inched up. As against 15x trailing Nifty PE that was observed on 03 Apr’20, current Nifty trailing P/E is inching closer to 33x. • This is also to be seen in context of an earnings de-growth in FY20 and FY21 as well. Although, rebound in earnings have been better than expected, FY21 has seen upgrades while there is an expectation of 25% plus earnings growth in FY22. • Although worst of earnings downgrades are behind and earnings are expected to recover sequentially for the remaining 2 quarters, both forward and trailing valuations are capturing the recovery and are trading at more than 1 standard deviation higher than average. • Thus, the fund has reduced its active equity exposure and is currently running close to 37% active equity in the portfolio. • With an all time low active equity exposure and all time high trailing valuations, the fund aims to provide cushion if there is any correction in the markets. Also, the fund will endeavour to increase equity exposure as and when valuations correct – either by earnings recovery or by price correction. • The fund seeks to stick with its stock selection framework of buying quality companies with superior and consistent cash flow generation. Thus, the fund may consider having opportunistic exposure towards Cement, Auto and select Private Banks to play the theme of domestic cyclical recovery. On the other hand, the fund continues to remain overweight in Information Technology and Healthcare sectors where there is strong earnings growth visibility. -23% 22% -6% 18% -2% 10% 13% -38% 30% -11% 32% -7% 29% 15% -50% -40% -30% -20% -10% 0% 10% 20% 30% 40% Correction 1 (1 Jan to 23 Mar) Upmove 1 (23 Mar to 30 Apr) Correction 2 (30 Apr to 18 May) Upmove 2 (18 May to 28 Aug) Correction 3 (28 Aug to 24 Sep) Upmove 3 (24 Sep to 31 Dec) Total (1 Jan to 31 Dec) DEF Nifty 74% participation 59% participation 33% participation 74% less fall 38% less fall 44% less fall
- 5. Quarterly Update January 2021 5 Stable Sectors: Retail Banks & NBFC’s, IT, Consumer Staple & Discretionary, Auto, HealthCare Cyclical Sectors: Corp Banks & NBFC’s, Energy & Utilities, Industrials, Cement, Commodities, Telecom Fund Performance Performance based on NAV as on 31/12/2020. Past performance may or may not be sustained in future. The performances given are of regular plan growth option. Regular and Direct Plans have different expense structure. Direct Plan shall have a lower expense ratio excluding distribution expenses, commission expenses etc. #Benchmark Returns. ##Alternate Benchmark Returns. The fund has been repositioned from a Nifty linked fund to an open banded fund w.e.f. June 19, 2017. This fund is managed by Mr. Arpit Kapoor & Mr. Sumit Agrawal (w.e.f. 01st March 2017) for Equity Portion, Mr. Arvind Subramanian (w.e.f. 09th November 2015) for Debt Portion. Other Funds Managed by the Fund Managers Performance based on NAV as on 31/12/2020. Past Performance may or may not be sustained in future. The performance details provided herein are of regular plan growth option. Regular and Direct Plans have different expense structure. Direct Plan shall have a lower expense ratio excluding distribution expenses, commission expenses etc. §Current Index performance adjusted for the period from since inception to June 28, 2007 with the performance of S&P BSE 100 price return index (Benchmark). 2The fund has been repositioned from an IPO fund to a large cap fund w.e.f. April 18, 2017. @The benchmark of IDFC Focused Equity Fund has been changed from Nifty 50 TRI Benchmark change to S&P BSE 500 TRI w.e.f. Nov 11,2019 Fund Stable Cyclical Total Large Cap 51% 24% 75% Mid Cap 7% 8% 15% Small Cap 7% 4% 10% Total 65% 35% S&P BSE 200 Stable Cyclical Total Large Cap 56% 32% 88% Mid Cap 6% 6% 12% Small Cap 0% 0% 0% Total 61% 39% Fund positioning – Stable & Cyclical Framework
- 6. Quarterly Update January 2021 6 Performance based on NAV as on 31/12/2020. Past Performance may or may not be sustained in future. The performance details provided herein are of regular plan growth option. Regular and Direct Plans have different expense structure. Direct Plan shall have a lower expense ratio excluding distribution expenses, commission expenses etc. §Current Index performance adjusted for the period from since inception to June 28, 2007 with the performance of S&P BSE 100 price return index (Benchmark). 2The fund has been repositioned from an IPO fund to a large cap fund w.e.f. April 18, 2017. ^Current Index performance adjusted for the period from since inception to May 28, 2018 with the performance of CRISIL Hybrid 85+15 Conservative Index (Benchmark) and CRISIL Hybrid 35+65 - Aggressive Index (Benchmark). 5. The fund has been repositioned w.e.f. May 28, 2018 and since will invest only in the schemes of IDFC Mutual Funds. IDFC Dynamic Equity Fund (An open ended dynamic asset allocation fund) Disclaimer: MUTUAL FUND INVESTMENTS ARE SUBJECT TO MARKET RISKS, READ ALL SCHEME RELATED DOCUMENTS CAREFULLY. The Disclosures of opinions/in house views/strategy incorporated herein is provided solely to enhance the transparency about the investment strategy / theme of the Scheme and should not be treated as endorsement of the views / opinions or as an investment advice. This document should not be construed as a research report or a recommendation to buy or sell any security. This document has been prepared on the basis of information, which is already available in publicly accessible media or developed through analysis of IDFC Mutual Fund. The information/ views / opinions provided is for informative purpose only and may have ceased to be current by the time it may reach the recipient, which should be taken into account before interpreting this document. The recipient should note and understand that the information provided above may not contain all the material aspects relevant for making an investment decision and the security may or may not continue to form part of the scheme’s portfolio in future. Investors are advised to consult their own investment advisor before making any investment decision in light of their risk appetite, investment goals and horizon. The decision of the Investment Manager may not always be profitable; as such decisions are based on the prevailing market conditions and the understanding of the Investment Manager. Actual market movements may vary from the anticipated trends. This information is subject to change without any prior notice. The Company reserves the right to make
- 7. Quarterly Update January 2021 7 modifications and alterations to this statement as may be required from time to time. Neither IDFC Mutual Fund / IDFC AMC Trustee Co. Ltd./ IDFC Asset Management Co. Ltd nor IDFC, its Directors or representatives shall be liable for any damages whether direct or indirect, incidental, punitive special or consequential including lost revenue or lost profits that may arise from or in connection with the use of the information.