1. Hospital Transport System Staffing Optimization
through Simulation
Jonathan Easter
Faculty Advisor: Dr. Joan Burtner
Mercer University - School of Engineering, Macon, GA
Abstract
Process Flow Chart Pareto Analysis
Data Analysis
Acknowledgements
Thank you to Dr. Joan Burtner for her extraordinary guidance in the
project, to Drew Elrod for the opportunity to work with the hospital, and
to Dr. Linda Brennan for her expertise. This work was supported by the
Engineering Honors Program at Mercer University. I would like to thank
Dr. Philip T. McCreanor, Director of the Engineering Honors Program,
for his guidance in pursuing and documenting this project.
Mercer University — Spring 2016 Engineering Expo — April 8, 2016 — Macon, GA
Senior Engineering Honors
Lockheed Martin
is a generous financial
supporter of the Mercer
University Engineering
Honors Program .
In order to test far-reaching changes in complex systems,
it is often useful to construct a simulation to model the
process. In doing so, management can test the effects of
a system-wide change without the enormous risk that
accompanies such a modification in actuality. The
objective of this study was to model the intra-hospital
transport system of a Central Georgia Hospital using a
discrete event simulation. Once the model was
constructed, two different scenarios involving transport
staffing levels were tested: the first, a reduction of total
staffing levels across the board, and the second,
establishment of specialized staff that only work within
certain areas of the hospital. Both of these scenarios
were evaluated according to the original, baseline model.
The reduction of total staffing did increase productivity
but at the expense of wait times, while the area
restriction improved productivity without greatly
affecting wait times. Based on findings from the
simulation, the author recommends establishing the
specialized transport staff, pending additional work
towards exact staffing levels.
The author was given a set of data that encompassed six
months’ worth of transport data, from April 2015
through September 2015, for a total of 134,541
individual transport events. These data were filtered for
completed transport events, as any event that was
cancelled would not give accurate and complete
turnaround durations. This left 72,383 individual events.
In order to increase the integrity of the simulation, the
author sorted the events by both origin and destination to
attempt to capture the varying distances between each
area. Then, using Arena’s Input Analyzer software, the
values for all Request Turnaround durations for each
event were input and the statistical distributions for each
From-To combination were determined. For this, only
those ‘combinations’ with at least 5 transport events
were considered to ensure that there were enough events
for an accurate distribution estimation. After this final
filtering, a total of 66,480 individual transport events
remained.
Request turnaround duration was chosen for this study
as it measures the length of the entire transport from
beginning to end. Because timing variations, i.e. delays
in certain tasks, are often correlated throughout a single
transport, using the total duration of the transport event
captures all of that variation in one number.
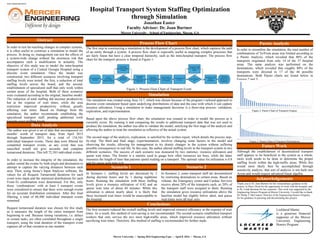
In order to streamline the simulation, the total number of
combinations of To/From areas was limited according to
a Pareto Analysis, which revealed that 80% of the
transports originated from only 14 of the 37 hospital
areas. The same analysis was performed on the
destinations, which revealed that roughly 80% of the
transports were directed to 17 of the 46 possible
destinations. Both Pareto charts are found below in
Figures 2 and 3:
The first step in constructing a simulation is the development of a process flow chart, which captures the path
of an entity through a system. A process flow chart is especially useful in mapping complex processes that
are fairly linear but have a clear temporal hierarchy, such as the intra-hospital transport. The process flow
chart for the transport process is found in Figure 1:
Scenario 2Scenario 1
Simulation
The simulation was created using Area 14.7, which was chosen because of the program’s tailored approach to
discrete event simulation based upon underlying distributions of data and the ease with which it can capture
resource utilization. Using a simulation to make management decisions is a three-step process: validation,
explication, and experimentation.
Based upon the above process flow chart, the simulation was created in order to model the process as it
currently exists. By running it and comparing the results to additional transport data that was not used to
produce the simulation, the author was able to validate the model, satisfying the first stage of the analysis and
allowing the author to treat the simulation as reflective of the actual system.
The second stage of the analysis, explication, is satisfied by the written report, which details the process step-
by-step. The third and final stage, experimentation, involves changing some factors in the model and
observing the results, allowing for management to try drastic changes in the system without suffering
possible consequences in real life. In this case, the author altered staffing levels in the transport system in two
different scenarios. The success of each scenario was measured by two statistics: resource utilization and
queue wait times. The former is a statistic used to guage how often resources are busy, while the latter
measures the length of time that patients spend waiting on a transport. The optimal value for utilization is 0.8
and for queue wait time is 0.
In Scenario 1, staffing levels are decreased by 2
during daytime hours and by 1 during nighttime
hours. Running the simulation with these staffing
levels gives a resource utilization of 0.82 and an
queue wait time of about 44 minutes. While this
utilization is almost nearly ideal, it is likely that
these increased wait times would be unacceptable to
the hospital.
In Scenario 2, some transport staff are decentralized
by restricting destinations to certain areas. Based on
volume, the Emergency center and Cardiac Services
receive about 20% of the transports each, so 20% of
the transport staff were assigned to them. Running
the simulation gives resource utilizations above the
baseline model but slightly below ideal, and queue
wait times were all near zero.
Conclusions
The first scenario reduced the overall staffing levels and improved resource efficiency at the expense of wait
times. As a result, this method of cost-saving is not recommended. The second scenario established transport
workers that only service the two most high-traffic areas, which improved resource utilization without
sacrificing wait times. Therefore, this method of staffing is recommended for further study.
Figure 2. Pareto Chart of Transport Origins
Figure 3. Pareto Chart of Transport Destinations
Figure 1. Process Flow Chart of Transport Event
Future Work
Although the establishment of decentralized transport
staff appears to be beneficial to the system as a whole,
more work needs to be done to determine the proper
staffing levels within the high-traffic areas. While this
would most likely best be accomplished through
sensitivity analysis, that sort of analysis is not built into
Arena and would require advanced linear algebra.