2. http://nscresearchcenter.org 2
REPORT
Degree Earners
Undergraduate
2,500,000
2,000,000
1,000,000
1,500,000
500,000
First-Time
Graduates
(All Age Groups)
Graduates with
Prior Awards
(All Age Groups)
2011-12 2012-13 2013-14 2014-15
2,249,597 2,219,609 2,195,929 2,191,855
544,779 577,276 594,667 612,277
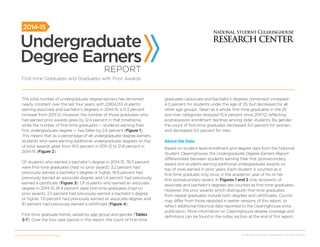
Figure 1: Number of First-Time Graduates and Graduates with Prior Awards
Figure 1 shows counts of students earning undergraduate degrees (bachelor’s and associates combined) in each academic year, disaggregated by
first-time graduate status. The number of first-time graduates has been falling, while the number of graduates with prior awards (which may include
degrees or certificates) has continued a postrecession increase.
3. http://nscresearchcenter.org 3
REPORT
Degree Earners
Undergraduate
Figure 2: Distribution of Undergraduate Degree Earners by Prior Award Status
Figure 2 shows that in 2011-12, 19.5 percent of all bachelor’s and associate degree recipients were students who had already earned a postsecondary
award in a previous year. By 2014-15, students with prior awards accounted for 21.8 percent of all undergraduate degree recipients.
100%
80%
70%
90%
50%
40%
60%
20%
10%
0%
30%
2011-12 2012-13 2013-14 2014-15
Graduates
with prior
awards
First-time
graduates
80.5% 79.4% 78.7% 78.2%
19.5% 20.6% 21.3% 21.8%
4. http://nscresearchcenter.org 4
REPORT
Degree Earners
Undergraduate
Figure 3: Bachelor’s Degree Earners - Distribution of Prior Awards
Figure 3 shows the percentage distribution of prior awards for students who earned a bachelor’s degree in each of the last four academic years. In
2014-15, 76.5 percent were first-time graduates (had no prior award), 3.2 percent had previously earned a bachelor’s degree or higher, 18.9 percent had
previously earned an associate degree, and 1.4 percent had previously earned a certificate.
100%
80%
70%
90%
50%
40%
60%
20%
10%
0%
30%
2011-12 2012-13 2013-14 2014-15
Bachelor’s
or higher
Associate
Certificate
No prior
award
78.2% 77.3% 77.1% 76.5%
1.2% 1.3% 1.4% 1.4%
17.8% 18.4% 18.4% 18.9%
2.8% 3.0% 3.1% 3.2%
5. http://nscresearchcenter.org 5
REPORT
Degree Earners
Undergraduate
100%
80%
70%
90%
50%
40%
60%
20%
10%
0%
30%
2011-12 2012-13 2013-14 2014-15
Bachelor’s
or higher
Associate
Certificate
No prior
award
84.6% 83.2% 81.7% 81.4%
6.6% 7.1% 7.8% 8.1%
5.8% 6.5% 7.0% 7.0%
2.9% 3.2% 3.4% 3.5%
Figure 4: Associate Degree Earners - Distribution of Prior Awards
Figure 4 shows the percentage distribution of prior awards for students who earned an associate degree in each of the last four academic years. In
2014-15, 81.4 percent were first-time graduates (had no prior award), 3.5 percent had previously earned a bachelor’s degree or higher, 7.0 percent had
previously earned an associate degree, and 8.1 percent had previously earned a certificate.
6. http://nscresearchcenter.org 6
REPORT
Degree Earners
Undergraduate
Table 1: Undergraduate Degree Earners by Level of Prior Award
Table 1 provides counts of undergraduate degree earners grouped by the level of their most recent prior award (if any). Students with no prior award are
first-time graduates. Academic years run from July 1 to June 30. In this report, certificate refers to undergraduate and graduate-level certificates, since it
was not possible for institutions to make this distinction in Clearinghouse data submissions prior to 2013-14. Certificate earners with no prior awards are
classified as first-time graduates.
2011-12 2012-13 2013-14 2014-15
Number Percent Number Percent Number Percent Number Percent
BACHELOR’S DEGREE EARNERS
Prior Master’s 2,970 0.2% 3,405 0.2% 3,344 0.2% 3,476 0.2%
Prior Bachelor’s 47,864 2.7% 51,476 2.8% 53,353 2.9% 54,969 3.0%
Prior Associate 318,000 17.8% 335,137 18.4% 336,959 18.4% 349,211 18.9%
Prior Certificate 21,178 1.2% 23,457 1.3% 25,089 1.4% 26,400 1.4%
First-Time Graduates (No Prior Award) 1,396,795 78.2% 1,407,265 77.3% 1,408,334 77.1% 1,411,441 76.5%
Total Bachelor’s Degree Earners 1,786,807 100.0% 1,820,740 100.0% 1,827,079 100.0% 1,845,497 100.0%
ASSOCIATE DEGREE EARNERS
Prior Master’s 2,336 0.2% 2,486 0.3% 2,691 0.3% 2,935 0.3%
Prior Bachelor’s 27,261 2.7% 28,384 2.9% 30,063 3.1% 30,525 3.2%
Prior Associate 58,357 5.8% 63,557 6.5% 67,608 7.0% 66,852 7.0%
Prior Certificate 66,814 6.6% 69,373 7.1% 75,559 7.8% 77,910 8.1%
First-Time Graduates (No Prior Award) 852,801 84.6% 812,344 83.2% 787,595 81.7% 780,414 81.4%
Total Associate Degree Earners 1,007,570 100.0% 976,145 100.0% 963,517 100.0% 958,635 100.0%
CERTIFICATE EARNERS
Prior Master’s 12,028 2.3% 13,103 2.5% 15,517 2.9% 15,686 3.0%
Prior Bachelor’s 34,678 6.6% 38,219 7.2% 41,262 7.6% 40,770 7.7%
Prior Associate 30,517 5.8% 32,932 6.2% 33,890 6.3% 34,306 6.5%
Prior Certificate 40,564 7.7% 42,931 8.1% 48,039 8.9% 49,223 9.3%
First-Time Graduates (No Prior Award) 411,239 77.7% 404,668 76.1% 402,359 74.4% 388,345 73.5%
Total Certificate Degree Earners 529,026 100.0% 531,855 100.0% 541,067 100.0% 528,330 100.0%
7. http://nscresearchcenter.org 7
REPORT
Degree Earners
Undergraduate
Table 2: Count of First-Time Graduates Earning Bachelor’s Degrees by Gender, Age, and Institutional Sector
Table 2 shows the count of bachelor’s degree recipients in each year and category who were first-time graduates. First-time graduates are defined as
students who earned a bachelor’s degree, associate degree, or certificate as their first postsecondary credential. Each student is counted as a first-time
college graduate only once, in the academic year of his or her first postsecondary credential. Academic years run from July 1 to June 30.
Change from Change from Change from Change from
2011-12 Prior Year 2012-13 Prior Year 2013-14 Prior Year 2014-15 Prior Year
OVERALL
First-Time Graduates
Earning Bachelor’s Degrees 1,396,795 3.9% 1,407,265 0.7% 1,408,334 0.1% 1,411,441 0.2%
GENDER
Women 782,531 3.8% 786,734 0.5% 782,689 -0.5% 783,052 0.0%
Men 614,264 4.0% 620,531 1.0% 625,644 0.8% 628,390 0.4%
AGE GROUP
Under 25 1,069,043 3.3% 1,082,713 1.3% 1,104,069 2.0% 1,117,270 1.2%
25-29 141,358 2.4% 140,314 -0.7% 137,002 -2.4% 135,183 -1.3%
30-39 95,273 6.3% 95,403 0.1% 88,242 -7.5% 84,715 -4.0%
40-49 59,275 9.5% 57,506 -3.0% 50,650 -11.9% 46,728 -7.7%
50 and over 28,800 13.4% 29,117 1.1% 26,721 -8.2% 26,197 -2.0%
INSTITUTIONAL SECTOR
4-Year Public 881,126 3.5% 887,763 0.8% 902,504 1.7% 908,386 0.7%
4-Year Private Nonprofit 436,494 2.3% 440,882 1.0% 445,176 1.0% 446,762 0.4%
4-Year Private For-Profit 77,693 17.4% 77,419 -0.4% 60,184 -22.3% 55,024 -8.6%
8. http://nscresearchcenter.org 8
REPORT
Degree Earners
Undergraduate
Table 3: First-Time Graduates Earning Bachelor’s Degrees as Percentage of All Bachelor’s Degree Earners by
Gender, Age, and Sector
Table 3 shows the percentage of bachelor’s degree recipients in each year and category who were first-time graduates. First-time graduates are defined
as students who earned a bachelor’s degree, associate degree, or certificate as their first postsecondary credential. Each student is counted as a first-time
graduate only once, in the academic year of his or her first postsecondary credential. Academic years run from July 1 to June 30.
Change from Change from Change from Change from
2011-12 Prior Year 2012-13 Prior Year 2013-14 Prior Year 2014-15 Prior Year
OVERALL
First-Time Graduates Earning
Bachelor’s Degrees as Percentage 78.2% -0.7 77.3% -0.9 77.1% -0.2 76.5% -0.6
of All Bachelor’s Degree Earners
GENDER
Women 76.3% -1.0 75.3% -1.0 75.1% -0.2 74.4% -0.7
Men 80.6% -0.3 79.9% -0.7 79.7% -0.3 79.3% -0.4
AGE GROUP
Under 25 88.7% 0.3 88.3% -0.4 88.1% -0.2 87.9% -0.2
25-29 57.6% -1.0 56.3% -1.2 55.4% -0.9 54.2% -1.2
30-39 50.5% -2.4 48.6% -1.9 47.0% -1.6 44.8% -2.2
40-49 59.8% -2.0 57.6% -2.3 54.6% -2.9 51.9% -2.7
50 and over 65.2% -1.0 62.5% -2.7 61.6% -0.9 59.9% -1.7
INSTITUTIONAL SECTOR
4-Year Public 78.2% -0.3 77.1% -1.1 76.4% -0.7 75.6% -0.7
4-Year Private Nonprofit 83.4% -0.5 82.6% -0.8 82.0% -0.6 81.4% -0.6
4-Year Private For-Profit 57.9% -1.9 58.1% 0.2 59.2% 1.1 59.7% 0.5
9. http://nscresearchcenter.org 9
REPORT
Degree Earners
Undergraduate
Table 4: Count of First-Time Graduates Earning Associate Degrees by Gender, Age, and Sector
Table 4 shows the percentage of associate degree recipients in each year and category who were first-time graduates. First-time graduates are defined
as students who earned a bachelor’s degree, associate degree, or certificate as their first postsecondary credential. Each student is counted as a first-time
graduate only once, in the academic year of his or her first postsecondary credential. Academic years run from July 1 to June 30.
Change from Change from Change from Change from
2011-12 Prior Year 2012-13 Prior Year 2013-14 Prior Year 2014-15 Prior Year
OVERALL
First-Time Graduates
Earning Associate Degrees 852,801 9.1% 812,344 -4.7% 787,595 -3.0% 780,414 -0.9%
GENDER
Women 517,052 8.9% 490,572 -5.1% 470,975 -4.0% 463,918 -1.5%
Men 335,750 9.4% 321,772 -4.2% 316,620 -1.6% 316,496 0.0%
AGE GROUP
Under 25 403,496 6.4% 397,827 -1.4% 408,528 2.7% 418,389 2.4%
25-29 150,675 9.2% 142,022 -5.7% 135,555 -4.6% 133,679 -1.4%
30-39 162,099 12.1% 149,412 -7.8% 136,559 -8.6% 130,473 -4.5%
40-49 91,485 14.0% 81,512 -10.9% 70,628 -13.4% 64,324 -8.9%
50 and over 42,421 18.5% 38,403 -9.5% 34,242 -10.8% 31,680 -7.5%
INSTITUTIONAL SECTOR
4-Year Public 104,872 15.3% 102,717 -2.1% 105,910 3.1% 112,121 5.9%
4-Year Private Nonprofit 37,748 14.3% 37,301 -1.2% 37,390 0.2% 36,853 -1.4%
4-Year Private For-Profit 126,740 7.1% 106,401 -16.0% 72,500 -31.9% 62,602 -13.7%
2-Year Public 513,555 8.2% 515,540 0.4% 522,880 1.4% 517,045 -1.1%
10. http://nscresearchcenter.org 10
REPORT
Degree Earners
Undergraduate
Table 5 shows the percentage of associate degree recipients in each year and category who were first-time graduates. First-time graduates are defined
as students who earned a bachelor’s degree, associate degree, or certificate as their first postsecondary credential. Each student is counted as a first-time
graduate only once, in the academic year of his or her first postsecondary credential. Academic years run from July 1 to June 30.
Change from Change from Change from Change from
2011-12 Prior Year 2012-13 Prior Year 2013-14 Prior Year 2014-15 Prior Year
OVERALL
First-Time Graduates Earning
Associate Degrees as Percentage 84.6% 0.3 83.2% -1.4 81.7% -1.5 81.4% -0.3
of All Associate Degree Earners
GENDER
Women 83.3% 0.4 81.8% -1.5 80.3% -1.6 80.0% -0.3
Men 86.7% 0.0 85.4% -1.3 84.0% -1.4 83.6% -0.4
AGE GROUP
Under 25 91.0% 0.7 90.1% -0.8 89.6% -0.6 89.6% 0.1
25-29 78.8% 0.6 77.1% -1.7 75.1% -2.0 74.5% -0.6
30-39 78.2% -0.3 75.9% -2.2 73.0% -3.0 71.9% -1.1
40-49 82.6% 0.1 80.3% -2.3 76.9% -3.4 75.0% -1.9
50 and over 82.6% 0.3 80.5% -2.1 77.1% -3.4 75.6% -1.5
INSTITUTIONAL SECTOR
4-Year Public 84.0% -0.1 83.5% -0.5 83.0% -0.5 82.4% -0.6
4-Year Private Nonprofit 85.6% -0.2 85.1% -0.5 84.4% -0.7 84.7% 0.3
4-Year Private For-Profit 94.5% -0.1 93.3% -1.2 91.1% -2.2 89.0% -2.1
2-Year Public 82.7% 0.5 81.3% -1.4 80.6% -0.7 80.1% -0.5
Table 5: First-Time Graduates Earning Associate Degrees as Percentage of All Associate Degree Earners by
Gender, Age, and Sector
11. http://nscresearchcenter.org 11
REPORT
Degree Earners
Undergraduate
Table 6 shows the count of certificate recipients in each year and category who were first-time graduates. First-time graduates are defined as students
who earned a bachelor’s degree, associate degree, or certificate as their first postsecondary credential. Each student is counted as a first-time graduate
only once, in the academic year of his or her first postsecondary credential. Academic years run from July 1 to June 30. In this report, certificate refers to
undergraduate and graduate-level certificates, since it was not possible for institutions to make this distinction in Clearinghouse data submissions prior to
2013-14. Certificate earners with no prior awards are classified as first-time graduates.
Change from Change from Change from Change from
2011-12 Prior Year 2012-13 Prior Year 2013-14 Prior Year 2014-15 Prior Year
OVERALL
First-Time Graduates
Earning Certificates 411,239 -8.8% 404,668 -1.6% 402,359 -0.6% 388,345 -3.5%
GENDER
Women 245,144 -9.4% 234,221 -4.5% 224,930 -4.0% 225,142 0.1%
Men 166,095 -7.8% 170,448 2.6% 177,430 4.1% 163,203 -8.0%
AGE GROUP
Under 25 181,076 -7.2% 185,666 2.5% 187,475 1.0% 188,311 0.4%
25-29 68,283 -8.9% 66,301 -2.9% 65,991 -0.5% 64,293 -2.6%
30-39 76,424 -11.2% 73,457 -3.9% 70,906 -3.5% 66,633 -6.0%
40-49 51,267 -10.6% 47,737 -6.9% 45,223 -5.3% 40,468 -10.5%
50 and over 32,766 -8.9% 30,530 -6.8% 31,883 4.4% 27,841 -12.7%
INSTITUTIONAL SECTOR
4-Year Public 16,497 12.8% 17,470 5.9% 18,536 6.1% 18,743 1.1%
4-Year Private Nonprofit 3,151 -11.2% 2,892 -8.2% 3,642 25.9% 2,755 -24.4%
4-Year Private For-Profit 20,612 -12.4% 22,010 6.8% 21,155 -3.9% 19,947 -5.7%
2-Year Public 248,138 -5.0% 253,013 2.0% 263,034 4.0% 255,455 -2.9%
Table 6: Count of First-Time Graduates Earning Certificates by Gender, Age, and Sector
12. http://nscresearchcenter.org 12
REPORT
Degree Earners
Undergraduate
Table 7: First-Time Graduates Earning Certificates as Percentage of All Certificate Earners by Gender,
Age, and Sector
Table 7 shows the percentage of certificate recipients in each year and category who were first-time graduates. First-time graduates are defined as
students who earned a bachelor’s degree, associate degree, or certificate as their first postsecondary credential. Each student is counted as a first-time
graduate only once, in the academic year of his or her first postsecondary credential. Academic years run from July 1 to June 30. In this report, certificate
refers to undergraduate and graduate-level certificates, since it was not possible for institutions to make this distinction in Clearinghouse data submissions
prior to 2013-14. Certificate earners with no prior awards are classified as first-time graduates.
Change from Change from Change from Change from
2011-12 Prior Year 2012-13 Prior Year 2013-14 Prior Year 2014-15 Prior Year
OVERALL
First-Time Graduates Earning
Certificates as Percentage of 77.7% -2.0 76.1% -1.6 74.4% -1.7 73.5% -0.9
All Certificate Earners
GENDER
Women 79.0% -2.3 76.7% -2.3 74.6% -2.0 74.5% -0.1
Men 76.0% -1.6 75.3% -0.7 74.1% -1.3 72.1% -1.9
AGE GROUP
Under 25 86.5% -1.3 86.6% 0.1 85.7% -0.8 85.6% -0.1
25-29 69.1% -2.7 66.6% -2.5 65.6% -1.0 65.1% -0.5
30-39 69.4% -3.0 66.2% -3.2 63.5% -2.7 61.8% -1.6
40-49 76.5% -2.1 73.6% -2.9 69.6% -4.0 66.9% -2.7
50 and over 78.0% -2.1 75.1% -3.0 72.8% -2.2 69.5% -3.3
INSTITUTIONAL SECTOR
4-Year Public 47.8% -0.7 46.0% -1.8 44.8% -1.1 43.8% -1.0
4-Year Private Nonprofit 34.1% -3.9 32.8% -1.3 32.0% -0.8 27.7% -4.2
4-Year Private For-Profit 78.8% -3.8 78.5% -0.3 76.1% -2.4 69.2% -6.9
2-Year Public 76.1% -0.9 75.3% -0.8 74.3% -1.0 73.6% -0.7
13. http://nscresearchcenter.org 13
REPORT
Degree Earners
Undergraduate
Sponsored in part by the Lumina Foundation,
committed to enrolling and graduating more
students from college.
NOTES ON THE DATA
Definition of First-Time Graduate
The Undergraduate Degree Earners Report, published annually by the
National Student Clearinghouse Research Center, provides counts of
first-time graduates and graduates with prior awards by institutional sector,
award level, age group, and gender. Award recipients are considered to
be first-time graduates if the award received in the report year is their first
postsecondary award from a U.S. Title IV, degree-granting institution. Each
student is counted as a first-time graduate only once, in the academic year
of his or her first postsecondary credential. Academic years run from July 1
to June 30. A student who earned two credentials in the year of his or her
first credential is counted under the highest credential level earned in that
year. For example, if a student whose first award was a certificate received
in December 2014 subsequently received an associate’s degree in May 2015,
he or she would be counted in this report as a first-time graduate at the
associate’s degree level in academic year 2014-15.
In this report, certificate refers to undergraduate and graduate-level
certificates, since it was not possible for institutions to make this distinction
in Clearinghouse data submissions prior to 2013-14. Certificate earners with
no prior awards are classified as first-time graduates.
Degree Coverage and Weighting
The National Student Clearinghouse collects graduation information from
its participating institutions via two data reporting services: Enrollment
Reporting (ER) and DegreeVerify (DV). Enrollment Reporting has higher
data coverage rates, but includes only basic completion information, such
as graduation indicator and the date of graduation. DV includes enhanced
information on completions, including degree title, major, level, and CIP
code, but covered only 91 percent of credentials granted by U.S. Title IV
degree-granting institutions as of fall 2015. The overall set of undergraduate
degree earners for a particular year is based only on awards reported to DV,
but prior award status was assigned using records from both ER and DV. In
cases where the prior award did not appear in a DV record (approximately
2.3% of the 2015 bachelors’ degree earners, 2.4% of associate degree
earners and 2.2% of certificate earners), the level of the prior award was
imputed based on the institution level and related enrollment records. To
adjust for the DV participation rate, weights were applied to each degree
record included in this report. Weights were derived by calculating the
inverse of the rate of degree data coverage for each combination of year,
institution sector, award level (bachelor’s, associate’s, or certificate), and
student gender. To obtain degree data coverage for each combination of
year, sector, and award level, Clearinghouse degree data were compared to
IPEDS Completions data for all U.S. Title IV, degree-granting institutions.
Imputation of Gender
Institutions reported student gender to the Clearinghouse for slightly
less than half of all students included in this report. The genders of the
remaining students were imputed using a table of name-gender pairs
that the Research Center developed using data publicly available from
the Census Bureau and the Social Security Administration as well as the
institution-reported data. The imputation used only those pairs in which
the name had at least two instances and was associated with a single
gender in at least 95 percent of the instances. The imputation is accurate
in 99.6 percent of the cases with known gender. A detailed document
on the development of our approach resides on the National Student
Clearinghouse Research Center’s “Working with Our Data” Web page.
Degree-Granting Status
When referencing IPEDS counts of postsecondary awards, it is important
to distinguish degree-granting institutions from non-degree-granting
institutions. Clearinghouse certificate and degree data, as well as the
IPEDS comparison data used for the weighting calculation in this report,
are limited to degrees and certificates awarded by U.S. Title IV-eligible,
degree-granting institutions.