

Recommended
Recommended
More Related Content
What's hot
What's hot (20)
Similar to Ajc d-16-02353 r1 (2)
Similar to Ajc d-16-02353 r1 (2) (20)
Recently uploaded
Recently uploaded (20)
Ajc d-16-02353 r1 (2)
- 1. Elsevier Editorial System(tm) for American Journal of Cardiology Manuscript Draft Manuscript Number: AJC-D-16-02353R1 Title: Coronary Computed Tomography Angiography-Derived Plaque Quantification in Patients with Acute Coronary Syndrome Article Type: Full Length Article Keywords: Coronary artery disease, coronary computed tomography angiography, plaque characterization, acute coronary syndrome Corresponding Author: Professor. U. Joseph Schoepf, MD Corresponding Author's Institution: MUSC First Author: Christian Tesche Order of Authors: Christian Tesche; Damiano Caruso; Carlo N De Cecco; Darby C Shuler; Jess D Rames; Moritz H Albrecht; Taylor M Duguay; Akos Varga-Szemes; David Jochheim; Moritz Baquet; Richard R Bayer; Ullrich Ebersberger; Sheldon E Litwin; Salvatore A Chiaramida; Ellen Hoffmann; U. Joseph Schoepf, MD Abstract: This study investigated the discriminatory value of quantitative atherosclerotic plaque markers derived from coronary CT angiography (cCTA) in patients with first acute coronary syndrome (ACS) compared to patients with stable coronary artery disease (CAD). 40 patients (56.9±9.3 years, 55% male) admitted with their first ACS and Framingham risk score matched controls with stable CAD were retrospectively analyzed. All patients had undergone cCTA followed by invasive coronary angiography. Total plaque volume, calcified and non- calcified plaque volumes, plaque burden (in %), remodeling index, lesion length, presence of napkin-ring sign, segment involvement score, and segment stenosis score were derived from cCTA and compared between both groups on a per-lesion and per-patient level. Patients with ACS showed a significant higher number of obstructive CAD, and higher values for segment stenosis score, segment involvement score, non-calcified plaque volume, lesion length, and remodeling index compared to the stable angina group (all p<0.05). On a per-lesion level, culprit lesions had significantly higher values for plaque burden, total plaque volume, non- calcified plaque volume, remodeling index, lesion length, and prevalence of napkin-ring sign in comparison to non-culprit lesions (all p<0.05). On Receiver-operating characteristics analysis, a stepwise model demonstrated incremental discriminatory power for identifying ACS both per-patient (AUC 0.92, p<0.0001) as well as per-lesion (AUC 0.88, p<0.0001). cCTA-derived culprit plaque markers show discriminatory value both on a per-patient and per-lesion level. A combination of markers added to the Framingham risk score yields the greatest discriminatory ability.
- 2. November 04, 2016 Dr. William C. Roberts, MD Editor-in-Chief, The American Journal of Cardiology Dear Bill, Thank you for the favorable evaluation of our manuscript entitled “Coronary Computed Tomography Angiography-Derived Plaque Quantification in Patients with Acute Coronary Syndrome” (AJC-D-16-02353). Based on the thoughtful comments our work has received, we have revised the manuscript and are thus resubmitting our contribution for a de-novo evaluation. Please find enclosed our detailed responses to the reviewers. Sincerely yours, Joe Schoepf and Co-Authors U. Joseph Schoepf, MD Prof. (h.c.), FAHA, FSCBT-MR, FNASCI, FSCCT Professor of Radiology, Medicine, and Pediatrics Director of Cardiovascular Imaging Medical University of South Carolina 25 Courtenay Drive, MSC 226 Charleston, SC 29425 (843) 876-7146 Phone (843) 876-3157 Fax Heart & Vascular Center 25 Courtenay Drive; MSC 226 Charleston SC 29425 Cover Letter
- 3. 1) respond to the comments of each of the 2 reviewers by revising your manuscript appropriately; 2) shorten your manuscript during its revision from its present 16.0 to no more than 12.5 text pages (those before the references but including the Title page); 3) incorporate my editorial changes into your revision (See copy marked "WCR" to be found under 'Action Links' 'Manage Review Attachments.'); 4) try not to repeat data in the tables again in the text; 5) correct the technical deficiencies (see below) to avoid having your manuscript returned for further revision. The abbreviation in the title of your manuscript should be spelled out. Your abstract should be shortened to a single page with the keywords at the bottom of that page. Your introduction should be reduced to a 2/3-page single paragraph. Please type your manuscript continuously beginning with the introduction. All portions of your manuscript can be shortened. The discussion of 4 pages should be no longer than 3 pages. The conclusion at the end of your discussion is unnecessary. Your tables in my view can be improved slightly (see copy marked "WCR"): the vertical lines should be eliminated from Table 1; the "N (%)" in the variable column should be eliminated; in the remaining tables the abbreviations in the variable column should be spelled out. We thank the editor for his insightful suggestions. 1) In this letter we responded to the reviewer´s comments; 2) We shortened the manuscript to no more than 12.5 pages; 3) We incorporated all above mentioned editorial changes; 4) We reduced the repetition of our results; 5) We adhered to the technical requirements.
- 4. Reviewer #1: We thank the reviewer for the favorable evaluation of our manuscript and the accompanying detailed comments. 1. The manuscript needs to observe the technical requirements of the journal (formatting, sections, tables). Response: Thank you for this comment. We have corrected the technical deficiencies. 2. „ACS-related culprit lesions on cCTA were identified based on invasive coronary angiography" is not clear. Please change/explain. Response: Thank you for this comment. Based on your valuable comment we have further clarified this point in the manuscript and reported this limitation in the discussion. “The ACS-related culprit lesions were identified on the basis of findings on electrocardiography, wall motion abnormalities presented on echocardiography, or angiographic appearance during ICA as previously reported1,2 .“ 1.) Dey D, Achenbach S, Schuhbaeck A, et al. Comparison of quantitative atherosclerotic plaque burden from coronary CT angiography in patients with first acute coronary syndrome and stable coronary artery disease. J Cardiovasc Comput Tomogr. 2014;8:368- 374. 2.) Pflederer T, Marwan M, Schepis T, et al. Characterization of culprit lesions in acute coronary syndromes using coronary dual-source CT angiography. Atherosclerosis. 2010;211:437-444. 3. What was the aim for heart rate and use of ß-blockers? Response: Thank you for this comment. Beta-blocker administration is actually part of our routine clinical protocol for patients with a resting heart rate > 65 bpm, thus we have added this information to the manuscript *Responses to Reviewers
- 5. 4. Plaque burden (in %) was determined as: plaque burden = [plaque area/vessel area] x100; Please provide a reference for the quantification of plaque burden (in %). Response: Thank you for this comment. According to your suggestions we added a reference. 1.) Versteylen MO, Kietselaer BL, Dagnelie PC, Joosen IA, Dedic A, Raaijmakers RH, Wildberger JE, Nieman K, Crijns HJ, Niessen WJ, Daemen MJ, Hofstra L. Additive value of semiautomated quantification of coronary artery disease using cardiac computed tomographic angiography to predict future acute coronary syndrome. J Am Coll Cardiol 2013;61:2296-2305 5. The culprit lesions were identified by an experienced independent interventional cardiologist based on invasive coronary angiography results as previously reported. Although the authors cite two references, this needs to be explained in more detail. Response: Thank you for this comment. We would like to refer to the second comment where we answered this topic in detail. 6. Follow-up data would augment the impact of the present study. Response: Thank you for this comment. We agree with the reviewer that a follow-up would have strengthen our results. However, this was beyond the scope of the present study. We reported this limitation in the discussion. 7. Some paragraphs in the discussion are redundant (for example first paragraph page 15). Please shorten the discussion. Response: Thank you for this comment. According to your suggestions we shortened and revised the discussion.
- 6. Reviewer #2: We thank the reviewer for the favorable evaluation of our manuscript and the accompanying detailed comments. 1. a) The last sentence of the Limitations section on P.16 raises the possibility of "biased" matching of stable and unstable lesions. To my understanding stable and unstable lesions were not matched at all but only patients for "age, gender, conventional coronary risk factors, and for their Framingham risk scores". b) Furthermore it is stated in this section that "the selection of the non-culprit control plaques was arbitrarily driven by size criteria". It is not stated in the Methods section that any selection of non- culprit plaques was performed but rather leads the reader to assume that all non-culprit plaques in patients with and without ACS were included. Response: Thank you for this comment. a) The observation is correct, a matching of "age, gender, conventional coronary risk factors, and for their Framingham risk scores" rather than culprit vs. non-culprit plaques was performed. We agree, the sentence “The matching of culprit to non-culprit plaques may be biased” might be confusing. The ACS-related culprit lesions were carefully identified on the basis of findings on electrocardiography, wall motion abnormalities presented on echocardiography, or angiographic appearance during ICA. However, this could represent a bias for the accurate identification of culprit plaques in case that culprit plaques were misleadingly classified as non-culprit plaques and vice versa. To clarify this point we rephrased the section in the limitations. b) Beside the ACS-related culprit lesions, all non-culprit lesions with ≥25% stenosis on cCTA were included for plaque quantification and characterization and served as control lesions (Method section, page 6). 2. Several of the plaque characteristics examined relate to plaque volumes (total, calcified and non- calcified). It does not seem surprising that the absolute volumes of the culprit plaque are larger than the mean of the non-culprit plaques, which presumably include many clearly more minor non- obstructive plaques (again how were these "selected"). If non-calcified plaque was examined as a percentage of total plaque in the culprit vs the non-culprit plaque this would not appear to be different. Response: Thank you for this comment. We agree with the reviewer that plaque volumes in culprit plaques may be per se larger compared to non-culprit plaques as culprit plaques in general have a larger plaque burden causing an acute obstructive stenosis. Thus, it is important to combine different markers (morphological and anatomical) and add them to established risk scores to get appropriate discriminatory power. However, we agree that percentage plaque burden (calcified, non-calcified) may be a more appropriate marker.
- 7. 3. In Table 3 the sum of calcified and non-calcified plaque is not equal to the total plaque volume. Please explain. Response: Thank you for this comment. The sum of calcified and non-calcified is not equal to the total plaque volume in Table 2 as well. This is due to the fact that the results are presented as medians with 25th and 75th percentile in parentheses due to the high skewness of the data. In this context the median does not allow for arithmetical correlation as it is just value or quantity lying at the midpoint of a frequency distribution of observed values or quantities. 4. The definition of the remodeling index given on page 8 should refer to the arterial rather than luminal area. Response: Thank you for this comment. We agree with the reviewer and revised according to your suggestions. “The remodeling index was calculated as the ratio of the vessel area of the lesion over the proximal arterial reference area”.
- 8. 1 Coronary Computed Tomography Angiography-Derived Plaque Quantification in Patients with Acute Coronary Syndrome Running Head: Plaque Quantification in Patients with ACS Christian Tesche, MDa,b ; Damiano Caruso, MDa,c ; Carlo N. De Cecco, MD, PhDa ; Darby C. Shuler, MSa ; Jess D. Rames, BS Can.a ; Moritz H. Albrecht, MDa,d ; Taylor M. Duguay, BSa ; Akos Varga-Szemes, MD, PhDa ; David Jochheim, MDe ; Moritz Baquet, MDe ; Richard R. Bayer 2nd , MDf,a ; Ullrich Ebersberger, MDa,b ; Sheldon E. Litwin, MDf,a ; Salvatore A. Chiaramida, MDf ; Ellen Hoffmann, MDb ; U. Joseph Schoepf, MDa,f a Division of Cardiovascular Imaging, Medical University of South Carolina, Charleston, SC b Department of Cardiology and Intensive Care Medicine, Heart Center Munich- Bogenhausen, Munich, Germany c Department of Radiological Sciences, Oncology and Pathology, University of Rome “Sapienza”, Rome, Italy d Department of Diagnostic and Interventional Radiology, University Hospital Frankfurt, Frankfurt, Germany e Department of Cardiology, Hospital of the Ludwig-Maximilians-University, Munich, Germany f Division of Cardiology, Medical University of South Carolina, Charleston, SC Corresponding author: U. Joseph Schoepf, MD Heart & Vascular Center Medical University of South Carolina Ashley River Tower 25 Courtenay Drive Charleston, SC 29425-2260, USA Phone: +1-843-876-7146 Fax: +1-843-876-3157 E-Mail: schoepf@musc.edu Disclosures: Dr. Schoepf is a consultant for and/or receives research support from Astellas, Bayer, Bracco, GE, Guerbet, Medrad, and Siemens Healthcare. Dr. De Cecco is a consultant for and/or receives research support from Guerbet and Siemens Healthcare. The other authors have no conflict of interest to disclose. Christian Tesche is an exchange visiting scholar supported by a grant from the Fulbright Visiting Scholar Program of the U.S. Department of State, Bureau of Educational and Cultural Affairs (ECA). *Manuscript Click here to view linked References
- 9. 2 Abstract This study investigated the discriminatory value of quantitative atherosclerotic plaque markers derived from coronary CT angiography (cCTA) in patients with first acute coronary syndrome (ACS) compared to patients with stable coronary artery disease (CAD). 40 patients (56.9±9.3 years, 55% male) admitted with their first ACS and Framingham risk score matched controls with stable CAD were retrospectively analyzed. All patients had undergone cCTA followed by invasive coronary angiography. Total plaque volume, calcified and non-calcified plaque volumes, plaque burden (in %), remodeling index, lesion length, presence of napkin-ring sign, segment involvement score, and segment stenosis score were derived from cCTA and compared between both groups on a per-lesion and per-patient level. Patients with ACS showed a significant higher number of obstructive CAD, and higher values for segment stenosis score, segment involvement score, non-calcified plaque volume, lesion length, and remodeling index compared to the stable angina group (all p<0.05). On a per-lesion level, culprit lesions had significantly higher values for plaque burden, total plaque volume, non-calcified plaque volume, remodeling index, lesion length, and prevalence of napkin-ring sign in comparison to non- culprit lesions (all p<0.05). On Receiver-operating characteristics analysis, a stepwise model demonstrated incremental discriminatory power for identifying ACS both per-patient (AUC 0.92, p<0.0001) as well as per-lesion (AUC 0.88, p<0.0001). cCTA-derived culprit plaque markers show discriminatory value both on a per-patient and per-lesion level. A combination of markers added to the Framingham risk score yields the greatest discriminatory ability. Keywords: Coronary artery disease, coronary computed tomography angiography, plaque characterization, acute coronary syndrome
- 10. 3 Coronary CT angiography (cCTA) has emerged as a useful and robust modality in the evaluation of patients with suspected coronary artery disease (CAD) 1,2 . cCTA safely rules out obstructive CAD and allows for direct non-invasive plaque quantification and characterization 3-5 . The validation of cCTA derived plaque analysis compared to intracoronary imaging modalities like intravascular ultrasound or optical coherence tomography has been established 6,7 . Various scores derived from routine cCTA, such as the traditional Agatston coronary artery calcium score along with the more novel segment stenosis score, and segment involvement score have been developed for cardiovascular risk stratification and surveillance of CAD 8,9 . In addition, recent studies focusing on plaque characterization identified several high-risk morphological plaque features in patients with stable CAD 10-12 , adverse cardiac outcome 8,13 , and acute coronary syndrome (ACS) 14-16 . However, these plaque markers are not routinely obtained and detailed plaque quantification typically requires a semiautomatic approach with dedicated software and user input. Additionally, data on the predictive value of plaque quantification in patients with ACS and the ACS-related culprit lesion, is limited. In the present study we sought to assess the discriminatory value of quantitative atherosclerotic plaque markers derived from cCTA in patients with first ACS compared to patients with stable CAD. Methods The research study protocols were approved by the institutional review board and the need for written informed consent was waived due to the retrospective nature of this investigation. The study was performed in HIPAA compliance. For this single-center retrospective investigation, we reviewed data collected between March 2009 and February 2013 from a patient population presenting to our acute chest pain center. We identified 40
- 11. 4 patients with a discharge diagnosis of first ACS (unstable angina pectoris or non-ST segment elevation myocardial infarction [NSTEMI]) who had undergone clinically driven evaluation for acute chest pain including cCTA followed by invasive coronary angiography. The patients’ Framingham risk scores were calculated to reflect 10 year risk for cardiovascular events 17 . The study population was compared with a control group with stable CAD who had undergone elective cCTA and invasive coronary angiography within 4 weeks. Controls were matched for age, gender, conventional coronary risk factors, and for their Framingham risk scores. NSTEMI and unstable angina pectoris were defined according to societal guidelines 18 . The ACS-related culprit lesions were identified on the basis of findings on electrocardiography, wall motion abnormalities presented on echocardiography, or angiographic appearance during ICA as previously reported 3,15 . Stable CAD was defined as stable exercise-induced symptoms without evidence of ACS at the time of cCTA. Patients were excluded from the study if they had had prior episodes of ACS, a history of myocardial infarction, previous coronary revascularization (percutaneous coronary intervention with stent placement or coronary artery bypass grafting), or with more than 4 weeks between cCTA and invasive coronary angiography in the control group. Patient risk factors and baseline characteristics were obtained from medical records. cCTA acquisition was achieved using 1st or 2nd generation dual-source CT systems (Somatom Definition or Somatom Definition Flash, Siemens Healthineers, Forchheim, Germany). First, patients underwent a non-contrast enhanced calcium scoring scan. The scan parameters for the subsequent contrast-enhanced cCTA comprised a retrospectively ECG-gated protocol with the 1st generation dual-source CT scanner and a prospectively ECG-triggered sequential scan protocol for the 2nd generation dual-source CT scanner; tube voltage of 100-120
- 12. 5 kV, tube current of 320-412 mA, temporal resolution of 83 or 75 ms, and 2 x 32 x 0.6mm or 2 x 64 x 0.6mm collimation with z-flying focal spot. 50–80 mL iopromide (Ultravist 370mgI/mL, Bayer, Wayne, NJ) was injected at 4-6 mL/sec along with a 30 mL saline bolus chaser to provide contrast enhancement. The attending radiologist determined the use of beta-blockers (heart rate >65 beats per minute) and nitroglycerine. During the cardiac phase with the least motion, weighted filtered back projection image reconstruction was performed with the following specifications: section thickness of 0.75 mm, reconstruction increment of 0.5 mm and a smooth convolution kernel (B26f). The cCTA data were analyzed on a post-processing workstation (syngo.via VA30, Siemens). Two observers who were blinded to the patients’ history analyzed the lesion characteristics separately with consensus interpretation in case of disagreement. Transverse sections and automatically generated curved multi-planar reformations were used for assessment. The average dimensions of non-affected vessel segments immediately proximal and distal to the lesion were measured to serve as a reference for diameter and area stenosis determination. Coronary plaque was assessed using the 16-segment AHA coronary model 19 . The degree of coronary artery stenosis was determined according to societal guidelines using the CAD-RADS™ system: 1. no (0%), minimal (1-24%), 2. mild (25-49% stenosis), 3. moderate (50-69% stenosis), 4. severe (70-99% stenosis), 5. total occlusion (100%) 20,21 . Obstructive CAD was defined as >50% stenosis. Beside the ACS-related culprit lesions, all non-culprit lesions with ≥25% stenosis on cCTA were included for plaque quantification and characterization and served as control lesions. Segment involvement score and segment stenosis score were determined as previously reported 13 . A dedicated semi-automatic software prototype (Coronary Plaque
- 13. 6 Analysis 2.0.3 syngo.via FRONTIER, Siemens) was used for plaque quantification and analysis of plaque markers. Using automated segmentation, the software provides a comprehensive array of quantitative atherosclerosis lesion descriptors by determining attenuation values within user-defined boundaries. The boundaries of the lesion were defined as the proximal and distal non-diseased section with absence of atherosclerotic changes. The software automatically determined the lesion length, total plaque volume, calcified plaque volume, and non-calcified plaque volume. The following cut-off values (in Hounsfield units - HU) were used: lipid-rich (17- 70HU), fibrotic (71-124HU), vessel lumen (125-511HU), and calcified (>511HU)6 . Plaque burden (in %) was determined as: plaque burden = [plaque area/vessel area] x100 4 . On vessel cross-sections, the presence of a napkin-ring sign was assessed as a low attenuation plaque core surrounded by a circumferential area of higher attenuation 22 . The remodeling index was calculated as the ratio of the vessel area of the lesion over the proximal arterial reference area 23 . For the statistical analysis, MedCalc (MedCalc Software, version 15, Ostend, Belgium) and SPSS (SPSS 23.0, IBM, Chicago, USA) were used. Continuous variables were presented as mean standard deviation or median with interquartile range when not normally distributed. Student t-test and Mann-Whitney U-test were employed to evaluate parametric or non- parametric data. Receiver-operating characteristics (ROC) analysis was used on a per-patient and per-lesion level to identify predictors for ACS. The area under the ROC curve (AUC) with corresponding 95% confidence interval, measured with the method of DeLong 24 , was used for the evaluation of discriminatory power. On the per patient level, a stepwise multivariable
- 14. 7 model of ROC curves was performed including Framingham risk score, SSS and SIS derived from cCTA and subsequent addition of plaque markers to evaluate the predictive value of these parameters. A combined model of cCTA-derived plaque markers including Framingham risk score was used on a per-lesion level to evaluate the incremental value. Statistical significance was assumed with a p-value 0.05. Results A total of 40 patients (56.9±9.3 years, 55% male) admitted with their first ACS who had undergone cCTA as part of their clinical work up followed by ICA were included together with 40 Framingham risk score matched controls (57.9±8.8 years, 60% male) with stable CAD, who also had undergone cCTA and ICA. Of the 40 patients with ACS, 29 had presented with NSTEMI, whereas 11 patients were diagnosed with unstable angina pectoris. Further patient demographics and baseline characteristics for both groups are illustrated in Table 1. cCTA analysis showed obstructive CAD in 32 patients (80%) with ACS and 20 patients (50%) with stable CAD (p=0.006). Patients with ACS showed significantly higher median segment stenosis score and segment involvement score (11.0 and 5.0) compared to patients with stable CAD (6.0 and 4.0; p=0.0004 and p=0.039). Median Agatston scores yielded no significant differences between patients with ACS (129.0) and control patients (183.0; p=0.79) (Table 2). For the plaque quantification and characterization, a total of 157 lesions were evaluated (40 ACS-related culprit lesions and 117 non-culprit lesions). Patients presenting with ACS showed a significantly higher median non-calcified plaque volume (36.0) in comparison to patients with stable CAD (21.5; p=0.037). Furthermore, patients with ACS showed higher prevalence of positive remodeling with a median remodeling index of 1.2 compared to the
- 15. 8 stable CAD group (1.0; p<0.0001). Additionally, patients with ACS had longer median lesion lengths (35.7) than patients with stable CAD (28.5; p=0.031). A trend towards higher median total plaque volume was observed in the ACS group (44.6) when compared to the control cohort (32.6), but this was not statistically significant (p=0.087). No differences were observed for calcified plaque volume (median 1.1 vs. 1.0; p=0.87). A detailed comparison of cardiac risk scores and plaque characteristics derived from cCTA in patients with ACS compared to the control group with stable CAD is shown in Table 2. Plaque quantification and characterization on a per-lesion level showed significantly higher median total plaque volume in culprit lesions in ACS patients (57.2) when compared to non-culprit control lesions (32.6; p=0.025). Furthermore, culprit lesions were characterized by higher non-calcified plaque volume, plaque burden, vessel remodeling and atheromatous plaque length when compared to control lesions (Table 3). According to the per-patient analysis, median calcified plaque volume revealed no statistical difference in culprit lesions vs. control lesions with a trend towards lower calcified plaque volume in culprit lesions (0.95 vs. 1.4, p=0.94). The results of quantitative plaque analysis in culprit vs. non-culprit control lesions are shown in Table 3. A representative example of the plaque quantification is illustrated in Figure 1. Receiver-operating characteristics analysis was performed for cCTA-derived markers showing statistically significant differences between patients with ACS and stable CAD, and ACS- related culprit lesions compared to control lesions to evaluate discriminatory power. Receiver- operating characteristics analysis on a per-patient level showed an area under the curve (AUC) of 0.64 (95%CI 0.54-0.73, p=0.004) for non-calcified plaque volume, 0.64 (95%CI 0.54-0.74,
- 16. 9 p=0.006) for lesion length, and 0.83 (95%CI 0.76-0.91, p<0.0001) for remodeling index. AUCs for segment stenosis score and segment involvement score were as follows: 0.73 (95%CI 0.62-0.84, p<0.0001), and 0.63 (95%CI 0.51-0.76, p=0.032) respectively. A stepwise model of Receiver- operating characteristics curves was created. Framingham risk score as a clinical marker of cardiovascular risk resulted in an AUC of 0.62 (95%CI 0.52-0.72, p=0.018). The addition of cCTA- derived risk scores segment stenosis score and segment involvement score to Framingham risk scores showed an AUC of 0.73 (95%CI 0.62-0.84, p=0.004). The inclusion of plaque markers to the risk score model yielded the highest discriminatory value (AUC 0.92, p<0.0001) (Figure 2). On a per-lesion level, the Receiver-operating characteristics analysis for the individual plaque markers showing significant differences in ACS-related culprit lesion vs. non-culprit control lesions were as follows: Plaque burden (AUC 0.63 [95%CI 0.49-0.77, p=0.048]), non- calcified plaque volume (AUC 0.63 [95%CI 0.53-0.73, p=0.012]), total plaque volume (AUC 0.62 [95%CI 0.52-0.72, p=0.021]), remodeling index (AUC 0.81 [95%CI 0.74-0.88, p<0.0001]), lesion length (AUC 0.68 [95%CI 0.59-0.78, p=0.0002]), napkin-ring sign (AUC 0.65 [95%CI 0.57-0.74, p=0.003]). For these markers, a combined model was produced, showing incremental discriminatory power with an AUC of 0.88 (95%CI 0.83-0.93, p<0.0001) (Figure 3). Discussion Our results demonstrate that cCTA-derived quantitative plaque markers show significant differences in patients with ACS compared to patients with stable CAD both on a per-patient and per-lesion level; moreover, various markers show discriminatory power for the identification of ACS with the highest discriminatory ability by a combination of these markers.
- 17. 10 We demonstrate that, on a per-patient level, non-calcified plaque volume (AUC 0.64), lesion length (AUC 0.64) and remodeling index (AUC 0.83) as plaque markers yielded significant discriminatory power to identify ACS. This is consistent with previous studies by Pflederer et al. and Dey et al. showing higher non-calcified plaque volume and positive vessel remodeling in patients with ACS compared to a control group with stable CAD 3,15 . Furthermore, lesion length has been demonstrated as being significantly different in patients with ACS compared to controls. Our conclusions appear to affirm these results 25 . In addition, a recent study by Min et al. showed that segment involvement score and segment stenosis score, as markers of coronary plaque extent, are higher in patients with ACS, demonstrating predictive power for adverse outcomes 26 . In our study, both parameters yielded discriminatory power (segment stenosis score AUC 0.72, segment involvement score AUC 0.63), which further strengthens the hypothesis that overall plaque extent plays a major role in adverse cardiac events. Framingham risk scores were used to assess clinical risk for cardiovascular events of the study population resulting in an AUC of 0.62. Using a stepwise model of Receiver-operating characteristics curves of these factors on a per-patient level, we found the highest discriminatory ability to emerge from the combination of risk scores with the supplemental addition of plaque markers (AUC 0.92). More importantly, our findings on the comparison of culprit lesions against non-culprit control lesions showed significantly higher total plaque volume, non-calcified plaque volume, and plaque burden. Moreover, total plaque volume (AUC 0.62), non-calcified plaque volume (AUC 0.63), and plaque burden (AUC 0.63) showed discriminatory power to detect ACS on the per-lesion analysis. The discriminatory power of these markers has been demonstrated in a
- 18. 11 recent study by Versteylen et al., showing the incremental value of total plaque volume (AUC 0.71) and non-calcified plaque volume (AUC 0.68) for the identification of ACS 4 . Furthermore, culprit lesions were characterized by higher vessel remodeling indices, lesion length, and the presence of napkin-ring sign when compared to non-culprit lesions. Additionally, a strong trend was observed for less calcified plaque volume in ACS lesions compared to control lesions, but this difference was not statistically significant. Similar results were found in recent studies showing higher proportions of calcified-plaque volume in patients with stable CAD 3,15,27 , thus supporting the assumption that calcification may have an important impact on plaque stabilization. The validity of remodeling index and lesion length measurements for outcome prediction has been recently evaluated 28 . Motoyama et al have shown that positive vessel remodeling was highly associated with ACS 16 . In our study, these markers demonstrated additional value with the remodeling index (AUC 0.81) showing the highest discriminatory power among all culprit lesion-related markers. A combined approach including all significant markers yielded incremental discriminatory value (AUC 0.88). cCTA has become an important non-invasive modality for the evaluation of CAD, cardiovascular risk stratification, and adverse outcome prediction 26 . Using semi-automated plaque quantification derived from cCTA allows for an increase in prognostic and predictive power 4,8,16 , accentuating the important clinical impact of plaque characterization for risk stratification. Unfortunately, plaque analysis is not routinely performed in clinical practice due to its time-consuming nature, limiting its integration into the clinical work-flow. However,
- 19. 12 technological improvements significantly reduce the analysis time required for such techniques and can improve decision making based on cCTA data in the future, if effectively implemented. In a previous study, Motwani et al. demonstrated the incremental value for predicting all-cause mortality and patient outcome based on machine learning incorporating cCTA data and clinical parameters 29 . In a similar vein, the appliance of machine learning may support the application of plaque quantification in clinical practice for risk stratification and decision-making when caring for patients at risk for developing ACS. Some limitations of this study need to be addressed. We present a retrospective single- center study with a relatively small number of patients. Therefore, larger studies will be necessary to validate our findings. We compared ACS patients against a randomly selected Framingham risk score matched control group with stable CAD to reflect and adjust for the clinical cardiovascular risk. However, due to potential selection bias, generalization of our results may be limited. Additionally, plaque quantification was not performed in patients with ACS caused by ST-elevation myocardial infarction, as these patients directly ordinarily undergo invasive coronary angiography without prior cCTA. Two different scanner systems were used for the plaque quantification, however, distribution of patients of both groups were equal on both scanner systems. We did not evaluate the impact of spotty calcification, which is known to be higher in patients with ACS 3 . Furthermore, we did not correlate our findings on cCTA with an invasive reference standard for intracoronary plaque assessment such as intravascular ultrasound; however, the potential of cCTA-derived plaque quantification compared to intravascular ultrasound has been previously established 6 . The identification of the culprit plaque in cCTA studies was carefully performed based on invasive coronary angiography
- 20. 13 findings; however, this could represent a bias for the accurate identification of culprit plaques. Finally, the selection of the non-culprit control plaques was arbitrarily driven by size criteria. We know from prior studies that the culprit plaque is usually not flow-limiting, but a smaller plaque which ruptures. Thus, the correct categorization to culprit or non-culprit plaques may be biased. Furthermore, we did not perform a follow-up on our patient population.
- 21. 14 1. De Cecco CN, Varga-Szemes A, Meinel FG, Renker M, Schoepf UJ. Beyond stenosis detection: computed tomography approaches for determining the functional relevance of coronary artery disease. Radiol Clin North Am 2015;53:317-334. 2. Ohnesorge BM, Hofmann LK, Flohr TG, Schoepf UJ. CT for imaging coronary artery disease: defining the paradigm for its application. Int J Cardiovasc Imaging 2005;21:85-104. 3. Pflederer T, Marwan M, Schepis T, Ropers D, Seltmann M, Muschiol G, Daniel WG, Achenbach S. Characterization of culprit lesions in acute coronary syndromes using coronary dual-source CT angiography. Atherosclerosis 2010;211:437-444. 4. Versteylen MO, Kietselaer BL, Dagnelie PC, Joosen IA, Dedic A, Raaijmakers RH, Wildberger JE, Nieman K, Crijns HJ, Niessen WJ, Daemen MJ, Hofstra L. Additive value of semiautomated quantification of coronary artery disease using cardiac computed tomographic angiography to predict future acute coronary syndrome. J Am Coll Cardiol 2013;61:2296-2305. 5. Bauer RW, Thilo C, Chiaramida SA, Vogl TJ, Costello P, Schoepf UJ. Noncalcified atherosclerotic plaque burden at coronary CT angiography: a better predictor of ischemia at stress myocardial perfusion imaging than calcium score and stenosis severity. AJR Am J Roentgenol 2009;193:410-418. 6. Voros S, Rinehart S, Qian Z, Joshi P, Vazquez G, Fischer C, Belur P, Hulten E, Villines TC. Coronary atherosclerosis imaging by coronary CT angiography: current status, correlation with intravascular interrogation and meta-analysis. JACC Cardiovasc Imaging 2011;4:537-548. 7. Pundziute G, Schuijf JD, Jukema JW, Decramer I, Sarno G, Vanhoenacker PK, Reiber JH, Schalij MJ, Wijns W, Bax JJ. Head-to-head comparison of coronary plaque evaluation between multislice computed tomography and intravascular ultrasound radiofrequency data analysis. JACC Cardiovasc Interv 2008;1:176-182.
- 22. 15 8. Nadjiri J, Hausleiter J, Jahnichen C, Will A, Hendrich E, Martinoff S, Hadamitzky M. Incremental prognostic value of quantitative plaque assessment in coronary CT angiography during 5 years of follow up. J Cardiovasc Comput Tomogr 2016;10:97-104. 9. Kristensen TS, Kofoed KF, Kuhl JT, Nielsen WB, Nielsen MB, Kelbaek H. Prognostic implications of nonobstructive coronary plaques in patients with non-ST-segment elevation myocardial infarction: a multidetector computed tomography study. J Am Coll Cardiol 2011;58:502-509. 10. Chow BJ, Wells GA, Chen L, Yam Y, Galiwango P, Abraham A, Sheth T, Dennie C, Beanlands RS, Ruddy TD. Prognostic value of 64-slice cardiac computed tomography severity of coronary artery disease, coronary atherosclerosis, and left ventricular ejection fraction. J Am Coll Cardiol 2010;55:1017-1028. 11. Schlett CL, Banerji D, Siegel E, Bamberg F, Lehman SJ, Ferencik M, Brady TJ, Nagurney JT, Hoffmann U, Truong QA. Prognostic value of CT angiography for major adverse cardiac events in patients with acute chest pain from the emergency department: 2-year outcomes of the ROMICAT trial. JACC Cardiovasc Imaging 2011;4:481-491. 12. Genders TS, Steyerberg EW, Hunink MG, Nieman K, Galema TW, Mollet NR, de Feyter PJ, Krestin GP, Alkadhi H, Leschka S, Desbiolles L, Meijs MF, Cramer MJ, Knuuti J, Kajander S, Bogaert J, Goetschalckx K, Cademartiri F, Maffei E, Martini C, Seitun S, Aldrovandi A, Wildermuth S, Stinn B, Fornaro J, Feuchtner G, De Zordo T, Auer T, Plank F, Friedrich G, Pugliese F, Petersen SE, Davies LC, Schoepf UJ, Rowe GW, van Mieghem CA, van Driessche L, Sinitsyn V, Gopalan D, Nikolaou K, Bamberg F, Cury RC, Battle J, Maurovich-Horvat P, Bartykowszki A, Merkely B, Becker D, Hadamitzky M, Hausleiter J, Dewey M, Zimmermann E, Laule M. Prediction model to estimate presence of coronary artery disease: retrospective pooled analysis of existing cohorts. BMJ 2012;344:e3485. 13. Min JK, Feignoux J, Treutenaere J, Laperche T, Sablayrolles J. The prognostic value of multidetector coronary CT angiography for the prediction of major adverse cardiovascular events: a multicenter observational cohort study. Int J Cardiovasc Imaging 2010;26:721-728.
- 23. 16 14. Dedic A, Kurata A, Lubbers M, Meijboom WB, van Dalen BM, Snelder S, Korbee R, Moelker A, Ouhlous M, van Domburg R, de Feijter PJ, Nieman K. Prognostic implications of non-culprit plaques in acute coronary syndrome: non-invasive assessment with coronary CT angiography. Eur Heart J Cardiovasc Imaging 2014;15:1231-1237. 15. Dey D, Achenbach S, Schuhbaeck A, Pflederer T, Nakazato R, Slomka PJ, Berman DS, Marwan M. Comparison of quantitative atherosclerotic plaque burden from coronary CT angiography in patients with first acute coronary syndrome and stable coronary artery disease. J Cardiovasc Comput Tomogr 2014;8:368-374. 16. Motoyama S, Kondo T, Sarai M, Sugiura A, Harigaya H, Sato T, Inoue K, Okumura M, Ishii J, Anno H, Virmani R, Ozaki Y, Hishida H, Narula J. Multislice computed tomographic characteristics of coronary lesions in acute coronary syndromes. J Am Coll Cardiol 2007;50:319-326. 17. D'Agostino RB, Sr., Vasan RS, Pencina MJ, Wolf PA, Cobain M, Massaro JM, Kannel WB. General cardiovascular risk profile for use in primary care: the Framingham Heart Study. Circulation 2008;117:743-753. 18. Amsterdam EA, Wenger NK, Brindis RG, Casey DE, Jr., Ganiats TG, Holmes DR, Jr., Jaffe AS, Jneid H, Kelly RF, Kontos MC, Levine GN, Liebson PR, Mukherjee D, Peterson ED, Sabatine MS, Smalling RW, Zieman SJ, Members AATF, Society for Cardiovascular A, Interventions, the Society of Thoracic S. 2014 AHA/ACC guideline for the management of patients with non-ST-elevation acute coronary syndromes: executive summary: a report of the American College of Cardiology/American Heart Association Task Force on Practice Guidelines. Circulation 2014;130:2354-2394. 19. Austen WG, Edwards JE, Frye RL, Gensini GG, Gott VL, Griffith LS, McGoon DC, Murphy ML, Roe BB. A reporting system on patients evaluated for coronary artery disease. Report of the Ad Hoc Committee for Grading of Coronary Artery Disease, Council on Cardiovascular Surgery, American Heart Association. Circulation 1975;51:5-40.
- 24. 17 20. Cury RC, Abbara S, Achenbach S, Agatston A, Berman DS, Budoff MJ, Dill KE, Jacobs JE, Maroules CD, Rubin GD, Rybicki FJ, Schoepf UJ, Shaw LJ, Stillman AE, White CS, Woodard PK, Leipsic JA. CAD-RADSTM Coronary Artery Disease - Reporting and Data System. An expert consensus document of the Society of Cardiovascular Computed Tomography (SCCT), the American College of Radiology (ACR) and the North American Society for Cardiovascular Imaging (NASCI). Endorsed by the American College of Cardiology. J Cardiovasc Comput Tomogr 2016. 21. Jacobs JE, Boxt LM, Desjardins B, Fishman EK, Larson PA, Schoepf J, American College of R. ACR practice guideline for the performance and interpretation of cardiac computed tomography (CT). J Am Coll Radiol 2006;3:677-685. 22. Maurovich-Horvat P, Schlett CL, Alkadhi H, Nakano M, Otsuka F, Stolzmann P, Scheffel H, Ferencik M, Kriegel MF, Seifarth H, Virmani R, Hoffmann U. The napkin-ring sign indicates advanced atherosclerotic lesions in coronary CT angiography. JACC Cardiovasc Imaging 2012;5:1243-1252. 23. Achenbach S, Ropers D, Hoffmann U, MacNeill B, Baum U, Pohle K, Brady TJ, Pomerantsev E, Ludwig J, Flachskampf FA, Wicky S, Jang IK, Daniel WG. Assessment of coronary remodeling in stenotic and nonstenotic coronary atherosclerotic lesions by multidetector spiral computed tomography. J Am Coll Cardiol 2004;43:842-847. 24. DeLong ER, DeLong DM, Clarke-Pearson DL. Comparing the areas under two or more correlated receiver operating characteristic curves: a nonparametric approach. Biometrics 1988;44:837-845. 25. Hoffmann U, Moselewski F, Nieman K, Jang IK, Ferencik M, Rahman AM, Cury RC, Abbara S, Joneidi- Jafari H, Achenbach S, Brady TJ. Noninvasive assessment of plaque morphology and composition in culprit and stable lesions in acute coronary syndrome and stable lesions in stable angina by multidetector computed tomography. J Am Coll Cardiol 2006;47:1655-1662.
- 25. 18 26. Min JK, Shaw LJ, Devereux RB, Okin PM, Weinsaft JW, Russo DJ, Lippolis NJ, Berman DS, Callister TQ. Prognostic value of multidetector coronary computed tomographic angiography for prediction of all- cause mortality. J Am Coll Cardiol 2007;50:1161-1170. 27. Sato A, Ohigashi H, Nozato T, Hikita H, Tamura M, Miyazaki S, Takahashi Y, Kuwahara T, Takahashi A, Hiroe M, Aonuma K. Coronary artery spatial distribution, morphology, and composition of nonculprit coronary plaques by 64-slice computed tomographic angiography in patients with acute myocardial infarction. Am J Cardiol 2010;105:930-935. 28. Munnur RK, Cameron JD, Ko BS, Meredith IT, Wong DT. Cardiac CT: atherosclerosis to acute coronary syndrome. Cardiovasc Diagn Ther 2014;4:430-448. 29. Motwani M, Dey D, Berman DS, Germano G, Achenbach S, Al-Mallah MH, Andreini D, Budoff MJ, Cademartiri F, Callister TQ, Chang HJ, Chinnaiyan K, Chow BJ, Cury RC, Delago A, Gomez M, Gransar H, Hadamitzky M, Hausleiter J, Hindoyan N, Feuchtner G, Kaufmann PA, Kim YJ, Leipsic J, Lin FY, Maffei E, Marques H, Pontone G, Raff G, Rubinshtein R, Shaw LJ, Stehli J, Villines TC, Dunning A, Min JK, Slomka PJ. Machine learning for prediction of all-cause mortality in patients with suspected coronary artery disease: a 5-year multicentre prospective registry analysis. Eur Heart J 2016.
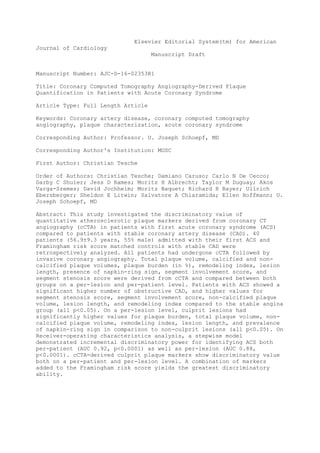
- 26. 19 Figure Legends Figure 1 57-year old man presenting with non-ST-segment elevation myocardial infarction (troponin 1.2ng/ml). (A) cCTA study displayed as automatically generated curved multiplanar reformations along the vessel centerline demonstrates severe stenosis of the left anterior descending artery (arrow). (B-D) Color-coded semi-automated plaque quantification of the target lesion. Invasive coronary angiography confirms severe filiform stenosis of the left anterior descending artery (E, arrow) which was subsequently treated with stent placement. Figure 2 Stepwise model of Receiver-operating characteristic curves on a per-patient level (patients with ACS with stable CAD). Receiver-operating characteristic curves are shown for Framingham risk score alone (FRS) (blue line: AUC 0.62, p=0.018) and in combination with segment stenosis score (SSS) and segment involvement score (SIS) (yellow line: AUC 0.73, p=0.004). The addition of plaque markers to risk scores shows highest discriminatory ability (red line: AUC 0.92, p<0.0001) (NCPV=non-calcified plaque volume; LL=lesion length; RI=remodeling index). Figure 3
- 27. 20 Receiver-operating characteristic curve is illustrated for the discriminatory model (combined approach) of plaque markers showing significant differences in ACS-related lesions compared to control lesions. This model demonstrating incremental discriminatory value (AUC 0.88, p<0.0001) includes plaque burden, non-calcified plaque volume, remodeling index, total plaque volume, lesion length and presence of napkin-ring sign.
- 28. Table 1 Patient demographics. Total patient cohort (n=80). Parameter All patients (n=80) ACS (n=40) Stable CAD (n=40) p value Age (years) 57.4±9.0 56.9±9.3 57.9±8.8 0.31 Men 46 (58%) 22 (55%) 24 (60%) 0.66 Body-mass-index (kg/m2 ) 30.5±9.5 31.6±11.3 29.5±7.5 0.39 Framingham risk score 25.9±11.2 26.7±10.6 25.1±11.8 0.69 Hypertension 44 (55%) 22 (55%) 22 (55%) 1.00 Diabetes mellitus 19 (24%) 12 (30%) 7 (18%) 0.20 Dyslipidemia 35 (44%) 19 (48%) 16 (40%) 0.51 Tobacco abuse 38 (48%) 18 (45%) 20 (50%) 0.66 Table 1
- 31. Figure 1 Click here to download high resolution image