More Related Content
Similar to Chapter15.pdf (16)
More from Jean-Philippe Turcotte (7)
Chapter15.pdf
- 1. Stock/Watson - Introduction to Econometrics – 4th
Edition - Answers to Empirical Exercises
_____________________________________________________________________________________________________
©2018 Pearson Education, Inc.
1
Empirical Exercise 15.1
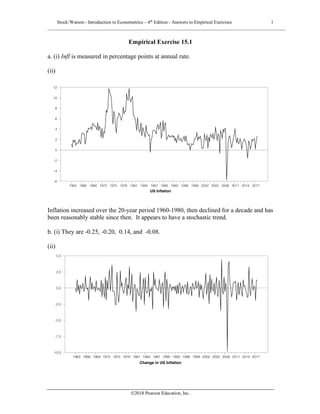
a. (i) Infl is measured in percentage points at annual rate.
(ii)
Inflation increased over the 20-year period 1960-1980, then declined for a decade and has
been reasonably stable since then. It appears to have a stochastic trend.
b. (i) They are -0.25, -0.20, 0.14, and -0.08.
(ii)
US Inflation
1963 1966 1969 1972 1975 1978 1981 1984 1987 1990 1993 1996 1999 2002 2005 2008 2011 2014 2017
-6
-4
-2
0
2
4
6
8
10
12
Change in US Inflation
1963 1966 1969 1972 1975 1978 1981 1984 1987 1990 1993 1996 1999 2002 2005 2008 2011 2014 2017
-10.0
-7.5
-5.0
-2.5
0.0
2.5
5.0
- 2. Stock/Watson - Introduction to Econometrics – 4th
Edition - Answers to Empirical Exercises
_____________________________________________________________________________________________________
©2018 Pearson Education, Inc.
2
The change in inflation is slightly negatively serially correlated (the first autocorrelation
is = -0.25) so that values above the mean tend to be followed by values below the
mean.
c. (i) The AR(1) model is
= 0.007 4 - 0.247 DInflt-1, = 0.06
(0.0965) (0.068)
The coefficient on lagged inflation is statistically significant, so that lagged inflation
helps predict current inflation.
(ii) The AR(2) model is
= 0.0061 - 0.318 DInflt-1 - 0.284 DInflt-2, = 0.13
(0.0926) (0.064) (0.076)
The estimated coefficient on DInflt-2 is statistically significant, so the AR(2) model is
preferred to the AR(1) model. (Note also that the increased from 0.06 in the AR(1)
model to 0.13 in the AR(2) model.)
(iii) AIC and BIC values are shown in the table
p BIC(p) AIC(p)
0 0.8049 0.7895
1 0.7669 0.7360
2 0.7077 0.6614
3 0.7322 0.6705
4 0.7437 0.6665
5 0.7533 0.6608
6 0.7689 0.6609
7 0.7931 0.6697
8 0.8163 0.6774
Both AIC and BIC select p = 2 lags.
(iv) The predicted change in inflation is -0.72
(v) The predicted level of inflation is 1.96
ρ̂1
ΔInfl
!
t R
2
ΔInfl
!
t R
2
R
2
- 3. Stock/Watson - Introduction to Econometrics – 4th
Edition - Answers to Empirical Exercises
_____________________________________________________________________________________________________
©2018 Pearson Education, Inc.
3
d. (i) The ADF t statistic is -2.74. The 10% critical vale is -2.57 and the 5% critical value
of -2.86; thus the unit root null hypothesis can be rejected at the 10% but not the 5%
significance level.
(ii) Yes, the inflation rate does not exhibit a linear trend, so that the specification that
includes an intercept, but no time trend is appropriate.
(iii) Both AIC and BIC choose two lags.
(iv) Inflation is highly persistent. It has a largest autoregressive root that is close to 1.0;
the null hypothesis that the value is 1.0 cannot be rejected at the 5% significance level,
and given the precision of the estimate, this suggests that the true value is close to 1.0.
Ideally, the range of reasonable values could be determined by forming a confidence
interval for the largest root, although this is somewhat tricky when autoregressive roots
are close to 1.0. Methods for construction for confidence intervals in this case go beyond
the material covered in the Stock-Watson textbook.
e. The QLR statistics is 5.12 and occurs in 2009:Q1. The 5% critical value is 4.71, so the
null of stability is rejected at the 5% significance level. Note that the rejection occurs just
following the large change in inflation in the fourth quarter of 2008. (See the discussion
below.) This suggests that, absent this single outlier, the model may be stable. You
should investigate this conjecture.
F-Statistics for a Break in AR(2) model for d_infl at Different Dates
1971 1973 1975 1977 1979 1981 1983 1985 1987 1989 1991 1993 1995 1997 1999 2001 2003 2005 2007 2009
0
1
2
3
4
5
5% Critical Value
10% Critical Value
- 4. Stock/Watson - Introduction to Econometrics – 4th
Edition - Answers to Empirical Exercises
_____________________________________________________________________________________________________
©2018 Pearson Education, Inc.
4
f. (i) Black is actual and blue is POOS forecast
(ii) The sample mean of the forecast errors is 0.00 (to two decimal places) with a standard
error of 0.23. There is no significant bias.
(iii) The RMSFE is 1.80. The in-sample regression estimated from 1963:Q1 – 2002:Q4
has a standard error of 1.20, so the RMSFE is larger than would be expected based on the
in-sample regression. As (iv) suggests, much of this is associated with the outlier in
2008:Q4 which produced a forecast error of -9.7%. Excluding this single observation
reduces the RMSFE to 1.29, which is much close to the in-sample SER.
(iv) Oil prices plummeted during the end of 2008. Have a look at the data.
Change in inflation Pseudo Out-of-Sample Forecasts
2003 2004 2005 2006 2007 2008 2009 2010 2011 2012 2013 2014 2015 2016 2017
-10.0
-7.5
-5.0
-2.5
0.0
2.5
5.0