1. 1
Nitrogen in Coastal Waters:
Prepared by Janna Shub for The Nature Conservancy, January 2015
Executive Summary
Abstract: Nutrient pollution in water bodies is a topic of concern and debate to citizens and lawmakers.
To retrieve reliable and up to date knowledge of this topic, this paper summarizes recent peer-reviewed
scientific literature while focusing on nitrogen. This paper describes how human-derived nitrogen affects
habitats and habitants of coastal ecosystems in Southern New England (NY, CT, RI and Cape Cod in MA).
Major coastal habitats of concern include tidal marshes, seagrass meadows and shellfish riffs. Special
attention is given to shellfish, as this is a major commercial commodity in the region. Special attention is
also given to onsite wastewater treatment systems as those contribute significant nitrogen
concentrations to adjacent coastal ecosystems. This paper also briefly summarizes the progress that has
been made in the US to regulate nitrogen in order to diminish nitrogen adverse effects on aquatic
coastal environments. Major adverse effects covered here include local acidification, low dissolved
oxygen concentrations, elimination of seagrass meadows and conversion of tidal marshes into mudflats.
This paper also touches on different nitrogen chemical forms and nitrogen coupling with carbon and
phosphorus. The overall goal of this paper is to deepen our understanding of nitrogen driven changes,
direct and indirect, in coastal environments. Hopefully this literature survey will stimulate discussion and
effective action to reduce and ultimately eliminate detrimental nitrogen effects on coastal habitats.
Key research findings: Loading coastal waters with excessive nitrogen causes the following major
detrimental effects on coastal ecosystems:
• Increased plant and bacteria biomass that release CO2 into water during their
decomposition, resulting in local increase in acidification. Local acidification reduces
survival rates for many organisms, especially young ones. Shellfish is particularly
vulnerable to ocean acidification because it needs to extract calcium from seawater.
• Blooming of algae, resulting in reduced light and elimination of seagrass meadows.
Seagrass meadows are the habitat for scallops, and provide nutrients for various fish
and wildlife.
• Excessive nitrogen stimulates growth of toxic algae and toxic cyanobacteria, resulting in
release of toxins into the water column.
• Increased plant and bacteria biomass, which consume dissolved oxygen during
respiration and decomposition, resulting in decreased dissolved oxygen levels. Low
dissolved oxygen conditions may kill oxygen dependent organisms, especially immobile
bottom organisms and young organisms.
• In tidal marshes, excessive nitrogen affects vegetation, eventually causing collapse of
creek banks and thereby formation of mudflats.
Healthy and robust tidal marshes, seagrass meadows, shellfish cliffs and benthic communities support
wildlife, fisheries, protect the coast from storm surges and inspire humans. Degradation of coastal
habitats undermines these basic environmental (food, shelter and spirituality) services that nature offers
the human society.
2. 2
Table of Content
Executive Summary.......................................................................................................................................1
Table of Content ...........................................................................................................................................2
List of Figures ................................................................................................................................................3
List of Tables .................................................................................................................................................3
Introduction ..................................................................................................................................................4
Overview of Nitrogen Effects........................................................................................................................7
Monitoring and Regulating Nitrogen............................................................................................................8
Sampling nitrogen...................................................................................................................................10
Coupling with Phosphorus..........................................................................................................................11
In the Water Column...................................................................................................................................11
Organic nitrogen .....................................................................................................................................12
Particulate nitrogen ................................................................................................................................13
Hypoxia .......................................................................................................................................................14
Acidification ................................................................................................................................................16
Acidification effects on aquatic organisms.............................................................................................16
Coastal acidification – Northeastern US.................................................................................................18
Tidal Marshes..............................................................................................................................................19
Seagrass Meadows......................................................................................................................................21
Shellfish.......................................................................................................................................................23
Oyster reefs.............................................................................................................................................23
Scallops ...................................................................................................................................................24
Bacterial World ...........................................................................................................................................25
Trawling and muddy coastal seafloor.....................................................................................................26
Toxic cyanobacteria ................................................................................................................................29
Onsite Wastewater Treatment (OWT) Systems..........................................................................................31
Spotlight on nutrient pollution in coastal groundwater.........................................................................32
Innovative nitrogen removal systems.....................................................................................................33
Permeability, redox and nutrient transport in groundwater..................................................................35
Closing Comments ......................................................................................................................................36
Bibliography ................................................................................................................................................37
3. 3
List of Figures
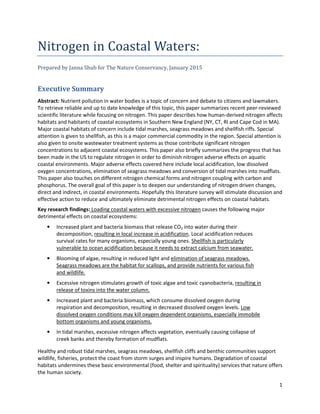
Figure 1: Historic trends in nitrogen concentrations in northeast estuaries (Roman et al., 2000)..............5
Figure 2: Nitrogen delivery to the estuary (Hauxwell and Valiela, 2004).....................................................7
Figure 3: Decomposition and respiration process......................................................................................15
Figure 4: Ocean acidification.......................................................................................................................16
Figure 5: Nutrient and light limitations for primary producers (Burkholder et al., 2007)..........................22
Figure 6: Lifecycle of Ballot’s scallop and acidification effects (Richards et al., 2015)...............................24
Figure 7: Nitrogen cycle in the ocean . ....................................................................................................25
Figure 8: Trawling effects22
. ........................................................................................................................27
Figure 9: Sediment oxygenation. ................................................................................................................28
Figure 10: Effluent total nitrogen concentrations in field trials (Oakley et al., 2010)................................34
Figure 11: Nitrogen removal by OWT innovative technologies (Heufelder et al., 2007). ..........................35
List of Tables
Table 1: EPA approved nitrogen numeric criteria in estuarine water bodies.............................................10
4. 4
Introduction
Nutrients tend to be limiting resources in big water bodies. In coastal ecosystems such as bays, lagoons
and estuaries nitrogen is usually the primary limiting element of phytoplankton and macroalgae growth
as it is in New York, Connecticut, Rhode Island and Massachusetts (Howarth and Marino, 2006). The
quantities of biologically available nutrients such as nitrogen and phosphorus define the water body’s
trophic state as oligotrophic (low nutrient levels), mesotrophic (medium nutrient levels) or eutrophic
(high nutrient levels). Interestingly, coastal water bodies that share similar geomorphological and
climatological characteristics may differ in trophic levels due to different freshwater/seawater balances
and different hydrologic residence times (Bianchi, 2007). Trophic levels of coastal water bodies may also
change as a result of land use alterations on the watershed. It is important to emphasize that nitrogen in
the environment doesn't stand alone. It is linked to other elements, especially to oxygen, phosphorus
and carbon.
Under natural conditions, estuaries of the northeastern US are mesotrophic. Mesotrophic coastal
ecosystems have intermediate levels of productivity and relatively high water clarity. Their bottoms are
usually covered with beds of submerged aquatic plants that supply oxygen, food and shelter to many
marine organisms. From the Hudson River and northward, the main estuary type is the drowned-river
valley, with greater tidal range than the southern US Atlantic coast (Roman et al., 2000). Main habitat
types include tidal marshes, seagrass meadows, intertidal mudflats and rocky shores that support
nekton1
and benthos2
, and coastal bird communities, while also linking to deeper estuarine habitats
through detritus based pathways (Roman et al., 2000). Roman and colleagues (2000) reconstructed
historic nutrient concentrations that enter northeast estuaries as a result of anthropogenic activities on
the watershed (did not include tidal dilution or dispersion). They found that over the 19th
century, there
was a three-fold increase in nitrogen concentrations in eight northeast estuaries (Figure 1).
Eutrophic conditions in the estuary describe a condition with excessive dissolved inorganic nutrients,
abundant dissolved organic substances and their excreted or lysed materials3
, together with abundant
particulate living material such as bacteria, small phytoplankton, and protozoans4
, whose growth is
stimulated by nutrient loads (Mallin, 2013). All these prey items benefit mixotrophic algal species (some
of which are toxic) that use photosynthesis and heterotrophy (predation) simultaneously to obtain
metabolic energy and building materials for their cells (Burkholder et al., 2008, Davidson et al., 2014).
Research shows that abundant reactive nitrogen adversely affects coastal habitats. Results of bioassay5
experiments showed that additions of as little as 50-100 μg/L (3.5-7 μM) of nitrate can cause significant
1
Nekton includes aquatic animals that are able to swim and move independently of water currents.
2
Benthos includes animals and plants that live on the bottom or in the sediment of a water body.
3
Lysed materials are contents of an organism cell that disperse in water as a result of bursting.
4
Protozoans are single celled microscopic animals.
5
Bioassay is a scientific standardized experiment to assess effects of drugs, contaminants and nutrients on living
organisms.
5. 5
chlorophyll a increases over controls in diverse coastal ecosystems (Mallin, 2013). Mesocosm6
experiments showed that nitrate concentrations as low as 100 μg/L (7μM) can cause direct toxicity to
the seagrass Zostera marina, known commonly as eelgrass (Burkholder et al., 2007). Oceanographic
literature suggest that 1 μM of inorganic nitrogen can produce 1 μg/L chlorophyll a and 20 μg/L
chlorophyll a in surface waters is already considered to be high for estuarine environments (Rose et al.,
2014).
Figure 1: Historic trends in nitrogen concentrations in northeast estuaries (Roman et al., 2000).
How much nitrogen is coming from human wastewater systems for example? In centralized wastewater
treatment plants that have tertiary treatment for nitrogen removal, total nitrogen concentrations in
effluent after biological nitrogen removal are typically 8 mg/L and after enhanced nitrogen removal can
be as low as 3 mg/L (Grady et al., 2011 p.1200). A concentration of 3 mg/L of total nitrogen is equivalent
to 200 μM of total nitrogen (Rose et al., 2014), which is potentially able to produce 200 μg/L chlorophyll
a, 100 fold higher than earlier mentioned high levels (20 μg/L chlorophyll a).
In onsite wastewater treatment (OWT) systems that are designed to remove nitrogen, total nitrogen
concentrations in effluent vary a lot and can range anywhere between 3 mg/L and 100 mg/L, depending
on the system design, weather, hydraulics, influent regime, etc. In OWT, it is not straightforward to
reach reliability and stability of a centralized wastewater treatment system because field conditions vary
and even similar systems perform quite differently in the field (Oakley et al., 2010).
6
A mesocosm maintains a natural community under close to natural conditions. A mesocosm experiment is
somewhere between a highly controlled experiment in a biology lab and field observations of real, complex
ecosystems.
6. 6
A minimal increase in nutrients delivered to coastal ecosystems stimulates primary production and
provides better quality food particles (larger quantities, of different species composition and higher in
nitrogen content) to grazers and filterers resulting in increased harvests of finfish and shellfish (Valiela,
2006). However, any addition of nutrients, in particular nitrogen above optimal concentrations in coastal
waters may result in multiple negative cascading effects including toxic algal blooms, low dissolved
oxygen levels, fish kills, acidification, and habitat loss (Bricker et al., 2008). It is important to note that
there is no consensus yet on what optimal nitrogen concentrations should be. Some scientists believe
any addition of nitrogen beyond the background concentrations is excessive and harmful. Background
nitrogen concentrations are also hard to define because these are unique to every estuary, bay and
coastal lagoon and depend on a handful of local factors that are hard to define themselves.
Reactive nitrogen includes all nitrogen forms except for nonreactive gaseous dinitrogen (N2). Reactive
nitrogen includes major inorganic forms such as ammonium (NH4
+
), nitrite (NO2
-
) and nitrate (NO3
-
).
Reactive nitrogen also includes chemical forms of nitrogen oxide (NO) – an important byproduct in cell
chemistry, nitric oxide (N2O2) – that forms when NO is cooled down and nitrous acid (HNO2) – when NO
reacts with water. NO will also react with fluorine, chlorine and bromine in water. Reactive nitrogen also
includes gaseous nitrogen forms such as ammonia (NH3), nitrous oxide (N2O greenhouse gas) and
nitrogen dioxide (NO2 toxic gas). Reactive nitrogen includes also organic nitrogen which is nitrogen
bounded to live or dead organisms’ cells and residue.
Most chemical forms of reactive nitrogen, including the forms listed above are biologically useful,
biologically available (bioavailable) and biologically reactive (bioreactive) – all names practically describe
the same thing.
Major anthropogenic nitrogen sources are derived from fertilizers, wastewater and fuel combustion.
Nitrogen (NO3
-
, NH4
+
and organic) from these sources is deposited on land or discharged to subsurfaces,
and then transported by storm water runoff directly to coastal systems via rivers and groundwater flows
(Figure 2). Offshore major pathways for nitrogen delivery are tides (mostly NO3
-
) and direct atmospheric
deposition (N2O). There is also in situ nitrogen regeneration from the sediments (NO3
-
and NH4
+
) back
into the water column (‘legacy’ sequestered nutrients).
Both inorganic and organic nitrogen reach coastal habitats and are of concern. Inorganic nitrogen,
mostly in the form of ammonium (NH4
+
) and nitrate (NO3
-
), is quickly taken up by aquatic plants such as
phytoplankton and macroalgae. Organic nitrogen arrives in the form of biomass (alive and dead
organisms), then, is eaten, broken, digested and reduced by microbes to ammonium. Some of the
nitrogen is recycled within the water column as ammonium and nitrate to be consumed by fish, wildlife
and eventually humans. Some of the nitrogen is buried in the sediment or exported to the deep ocean in
the form of dead organisms. Some of the nitrogen is converted to the gaseous dinitrogen form (N2) and
released back into the atmosphere.
Estuaries can be overwhelmed by excess nitrogen loading resulting in changes to species and habitat
composition and overall ecosystem functioning. This paper tries to summarize our understanding of
excess nitrogen dynamics in coastal habitats and organisms.
7. 7
What exactly happens to the nitrogen as it reaches the coastal waters?
Figure 2: Nitrogen delivery to the estuary (Hauxwell and Valiela, 2004).
Top of the Document
Overview of Nitrogen Effects
In both fresh and marine surface waters, there are microbial communities that nitrify ammonium,
denitrify nitrate and eventually release non-reactive gaseous dinitrogen (N2) to the atmosphere (which is
naturally rich in N2). Unfortunately, at medium and high nitrogen loads, microbes cannot process all the
nitrogen before it reaches aquatic plants in coastal estuaries.
Aquatic plants are fertilized by the nutrient-rich freshwater inflow and bloom, similarly to fertilized
plants on land in agriculture. Major species of aquatic plants that benefit from nitrogen enrichment are
microscopic aquatic plants such as phytoplankton and attached multicellular macroalgae such as sea
lettuce (Ulva). When these plants bloom they overgrow the grazing pressure on them and can have four
major detrimental effects on the coastal aquatic ecosystem: toxins, hypoxia7
, acidification and loss of
habitat.
Toxins: Some phytoplankton and cyanobacteria blooms are toxic to humans and to other aquatic
organisms, eventually resulting in fishery closures. Hypoxia and anoxia8
can also contribute to release of
toxins into the water column, eventually increasing toxin incorporation into the food web through
filtration and predation.
7
Hypoxia describes conditions of low dissolved oxygen, usually less than 3 milligrams O2 per liter sea water.
8
Anoxia describes conditions of zero dissolved oxygen in water.
8. 8
Hypoxia: Respiration by algae and bacteria reduce dissolved oxygen concentrations in the water
column, near the bottom and in the sediment. As a result, available habitat for oxygen-dependent
species such as shellfish and algae grazers shrinks. Prolonged hypoxic and anoxic conditions kill oxygen
dependent species, in particular immobile species and young, disturb trophic levels and change local
biochemistry.
Indirect effects: decrease in shellfish beds increases water turbidity and a decrease in algae grazers
relieves grazing pressure, as a result augmenting eutrophication effects even farther.
Habitat loss: Phytoplankton, macroalgae and epiphytes (small algae attached to eelgrass shoots) reduce
light availability for submerged aquatic plants that grow on the bottom such as eelgrass. Also,
macroalgae competes with eelgrass for bottom space, which results in fewer eelgrass shoots (Weis,
2014). The indirect result of eutrophication here is elimination of eelgrass meadows.
Nitrogen-rich estuarine waters and nitrogen from land transported via runoff and groundwater to tidal
marshes can trigger a chain of processes that contribute to degradation and eventual conversion of
vegetated marsh to mudflats.
Acidification: Though the central driver of ocean acidification is higher concentrations of CO2 in the
atmosphere, in coastal ecosystems, wastewater discharge, fertilizers and direct atmospheric deposition
of nitrogen dioxide9
(NO2) drive biological respiration and decomposition, adding significant
concentrations of carbon dioxide (CO2) to water and contributing to local acidification effects.
Nitrogen fate: Nitrogen can be removed from the aquatic system for a relatively long period of time by
three ways: it can be converted by microbes into gaseous dinitrogen (N2) and bubble up into the
atmosphere or it can be buried deep into the sediment or it can be assimilated into living organisms that
leave the area (to the open ocean or harvested).
The accumulation of a particular nitrogen form in certain places depends on the microcosms’ conditions
and the type of bacteria that favors them.
Top of the Document
Monitoring and Regulating Nitrogen
Drinking water
Nitrogen is regulated under the Safe Drinking Water Act since 1974 by the Environmental Protection
Agency (EPA) and enforced by State Health Departments to prevent health complications such as “blue
baby syndrome.” Safe nitrogen level in drinking water was set to a maximum contaminant level (MCL) of
10 mg/l (10 ppm) and is monitored directly in groundwater that supply private and public wells or in
drinking water supply facilities. Nitrogen in drinking water is measured as dissolved nitrate (NO3
-
) and
9
NO2 is a byproduct of fuel combustion from cars and power plants.
9. 9
can be effectively removed by ion exchange, reverse osmosis and electrodialysis10
. It is important to
note that regulating nitrogen in drinking water isn’t considered adequate protection for estuaries
though it does sometimes stimulate local awareness that is expressed in local bylaws and zoning
restrictions that aim to protect water quality.
Onsite wastewater systems (OWS)
EPA regulates large capacity septic systems under the Underground Injection Well program and disposal
of domestic septage11
under 40 CFR Part 503. States, tribes and local governments are responsible for
regulating individual onsite systems. EPA develops voluntary policies and guidance for onsite
wastewater management programs and sponsors demonstration projects to test new technologies12
.
Surface water
Under the Clean Water Act (1948, 1972, 1987) US States are required to set water quality standards for
surface waters and regulate pollutant discharges to surface waters. The goal is to prevent pollution and
impairment of rivers, lakes and estuaries.
Nutrient concentrations in a particular water body are defined by local species, water column
turbidity/light availability, water turn-over within the water body, water column mixing and nutrient
inputs, thus defining nitrogen standards is a complex task (Valiela, 2006).
Setting surface water standards and regulations is extremely complicated. Since 1998, most states have
in place water quality standards and regulations. There are multiple programs to reduce pollution and
excessive nutrients in surface waters. If a water body is “impaired” (on the 303(d) list), a total maximum
daily load (TMDL) is required to be established for its contributing watershed,13
such as the dissolved
oxygen TMDL developed for the Long Island Sound (Lee and Lwiza, 2008); however, many impaired
water bodies do not have a TMDL. All pollutant discharges from point sources are required to have a
pollutant discharge permit through the national pollutant discharge elimination system (NPDES)14
. For
nonpoint sources such as stormwater and agriculture, best management practices are recommended.
The Clean Water Act requires states to assign designated uses (i.e., water supply, swimmable/fishable)
to all of their water bodies, and accordingly develop water quality narrative and numeric criteria for
toxic pollutants and nutrients to maintain their designated uses15
. There are five levels in the
development of nutrient numeric criteria: level one is no nitrogen and no phosphorus criteria and level
five is having a complete, EPA approved set of nitrogen and phosphorus criteria for all water types
(lakes/reservoirs, rivers/stream and estuaries).
Hawaii (HI) (Chapter 11-54 (Hawaii, 2010)), American Samoa (AS), Northern Mariana Islands (MP) and
Guam (GU) completed level five with a complete, EPA approved set of nitrogen and phosphorus criteria
10
http://water.epa.gov/drink/contaminants/basicinformation/nitrate.cfm visited on 12/3/2014
11
Septage is the material contained in and removed from a septic tank.
12
http://water.epa.gov/infrastructure/septic/index.cfm visited on 12/3/2014
13
http://www2.epa.gov/nutrient-policy-data/what-epa-doing visited on 12/3/2014
14
http://www2.epa.gov/laws-regulations/summary-clean-water-act visited on 12/3/2014
15
http://water.epa.gov/scitech/swguidance/standards/uses.cfm visited on 12/3/2014
10. 10
for all of their water body types. Puerto Rico (PR), Florida (FL), New Jersey (NJ) and Wisconsin (WI)
completed level four though only Florida completed numeric nitrogen criteria for coastal estuaries
(Table 1). Massachusetts has developed TMDLs for a few estuaries (314 CMR 4.00 (Massachusetts,
2007))16
. New York, Connecticut and Rhode Island States have not yet developed numeric nitrogen
criteria for estuarine water bodies.
Table 1: EPA approved nitrogen numeric criteria in estuarine water bodies
17
.
State
Criteria
HI
Estuaries
AS
Fagatele Bay
MP
Class AA18
GU
M-1 cat.19
FL
Card Sound
MA
Bucks Creek
PR
Estuaries
Dissolved Total Nitrogen (TN) [mg/L] 0.2 0.135 0.4 0.33 0.38
Dissolved Inorganic Nitrogen [mg/L] 5
Dissolved Nitrate (NO3
-
as N) [mg/L] 0.2 0.10
Dissolved Nitrite (NO2
-
) + Nitrate [mg/L] 0.008
Dissolved Total Phosphorus (TP) [mg/L] 0.025 0.015 0.025 0.008 1
Orthophosphate [mg/L] 0.025 0.025
Chlorophyll a [μg/L] 2 0.35 0.5
Turbidity (Secchi depth) [NTU] 1.5 0.25 0.5 0.5 10
To summarize, for regulation and management purposes nitrogen is measured in groundwater as
dissolved nitrate (NO3
-
) and in surface waters usually as dissolved total nitrogen (TN). Dissolved TN
includes inorganic dissolved nitrogen forms (nitrate, nitrite and ammonium) and organic dissolved
nitrogen forms (natural forms such as proteins, peptides, nucleic acids and urea; and synthetic organic
materials).
Sampling nitrogen
In a water sample there is organic and inorganic particulate nitrogen that is excluded from dissolved
water samples by filtering the water sample during its preparation for analysis. Particulate nitrogen is
also biologically available. Nutrient sorption/desorption20
to suspended sediment is a quick process and
depends on the content of suspended sediment in the water (Wolanski and McLusky, 2011). Also, if
nitrogen is bounded to suspended organic matter (alive or dead) it can be directly assimilated by other
organisms such as bacteria, algae and shellfish (Simsek et al., 2013, Ou et al., 2014). Thus, monitoring
only for dissolved nitrogen in water might give an incomplete assessment of nitrogen levels available to
marine organisms.
16
http://water.epa.gov/scitech/swguidance/standards/wqslibrary/ma_index.cfm visited on 12/3/2014
17
http://cfpub.epa.gov/wqsits/nnc-development/ visited on 1/17-19/2014. This table doesn’t include all the detail
and shows just one example among the approved values (each water body has slightly different criteria).
18
Class AA uses to be protected in this class of waters are the support and propagation of shellfish and other
marine life, conservation of coral reefs and wilderness areas, oceanographic research, and aesthetic enjoyment
and compatible recreation with risk of water ingestion by either children or adults.
19
M-1 category includes all coastal waters off-shore from the mean high water mark, including estuarine waters,
lagoons and bays, brackish areas, wetlands and other special aquatic sites, and other inland waters that are subject
to ebb and flow of the tides.
20
Sorption is a process of one substance attaching to another, such as absorption and adsorption.
11. 11
How much time it takes and how expensive it is collecting nitrogen samples in the field and analyzing
them later in the lab largely depends on the technology available and the methods approved by EPA.
Location matters. Nitrogen can be sampled at the water surface, near the bottom, in the sediment, in
plants (and other organisms), in the middle of the channel, near the banks, in the open waters, near the
reef, underneath the reef, in deep waters, in the euphotic zone21
, etc. Location, frequency and timing,
costs, socio-economic feasibility, ecosystem processes and more need to be considered when designing
a monitoring program, especially for regulatory purposes.
Coupling with Phosphorus
To achieve significant improvements in coastal habitat conditions, carbon and phosphorus need to be
addressed along with nitrogen. Reductions in all three elements need to be considered in a holistic and
comprehensive plan.
Traditionally, because nitrogen is considered to be the limiting element of coastal phytoplankton
growth, nitrogen reductions are a major part of any coastal nutrient management program (Rose et al.,
2014). Phosphate sometimes can limit or co-limit algal growth (Lapointe and Clark, 1992). Thus, it is
recommended that in order to control coastal eutrophication, it is necessary to reduce both nitrogen
and phosphorus (Howarth and Paerl, 2008, Conley et al., 2009, Paerl, 2009).
Top of the Document
In the Water Column
Estuaries offer environmental services including recreation (bathing, kayaking, sailing, diving, etc.),
fishing and sighting/observation opportunities. Nitrogen enrichment of estuaries reduces the
opportunities for fishing, recreation and sighting. It also reduces the value of beaches and real estate
from excessive algae on shores that decay and sometimes emit unpleasant odors (NOAA, 2009).
In a majority of cases throughout the world, macroalgae blooms are found to be connected to higher
inputs of wastewater (Valiela, 2006). In places where coastal waters are abundant with wastewater
nitrogen, dense macroalgae canopies tend to form with heavier stable isotopic signature22
. In more
pristine environments, macroalgae do not form dense canopies and have lighter stable isotopic
signature, indicating that their nitrogen is from a natural fixation process (Valiela, 2006). Different
macroalgae species respond differently to nitrogen enrichment (Valiela, 2006). Diversion of treated
sewage away from Kaneohe Bay and Fraser River Estuary resulted in lower macroalgae biomass to the
extent that oxygen concentrations increased in the water column and grazers could control macroalgae
growth once again (Valiela, 2006).
21
Euphotic zone is the upper layer of the water column that receives enough light to stimulate photosynthesis.
22
Heavier isotopes are a signal for wastewater derived nitrogen.
12. 12
Wallace and Gobler (2014) found that macroalgae in the eutrophic Jamaica Bay was dominated by Ulva
rigida that covered 90% of the shallow water bottom and its primary nitrogen source was in wastewater
(by δ15
N signature). Interestingly, in deeper waters Ulva rigida cover was light-limited (out
competed/shaded out) by phytoplankton blooms (Wallace and Gobler, 2014).
An increase in nitrogen loads to coastal waters can result in increased biomass and productivity of
bacteria populations, in particular, populations of nitrifying microbes (which convert ammonium NH3 to
nitrate NO-
3) and denitrifying microbes (which convert nitrate NO-
3 to gaseous dinitrogen N2) (Valiela,
2006). Denitrifiers can convert as much as half of the nitrate external load in coastal waters where
nitrogen loads are relatively low but can’t keep up as anthropogenic activities on the watershed increase
(Valiela, 2006). It is important to note that some nitrogen inputs from the watershed are in the form of
ammonium (NH4
+
). Nitrifying microbes prefer to oxidize ammonium rather than fixing dinitrogen (N2)
because the fixation process consumes more energy. As a result, nitrates are the dominant nitrogen
chemical form that is found in the upper layers of the water column (Valiela, 2006).
In ammonium-rich, anoxic, aquatic environments ammonium is oxidized with nitrate and nitrite by
anammox bacteria to yield gaseous dinitrogen (Valiela, 2006).
Microbes play an important role in the nitrogen cycle. In the marine environment microbes are the only
organisms that can convert the biologically available nitrogen back to stable dinitrogen gas via
denitrification and anammox processes (Williams, 2013, Brin et al., 2014). Thus, any effects that reduce
the rate of denitrification and anammox may augment coastal eutrophication. For example, continuous
hypoxic conditions inhibit nitrification, thus reduce the production of nitrites and nitrates that are
needed to execute anammox and denitrification processes respectively.
Top of the Document
Organic nitrogen
Organic nitrogen can be described as biodegradable dissolved organic nitrogen (BDON) that is bounded
to organic matter and can be converted to ammonium by bacteria (Wadhawan et al., 2014). Wadhawan
and colleagues studied BDON in drinking water and found that BDON (17–275 µg N/L) is a substantial
portion of the dissolved organic nitrogen (DON) in fresh water. They also found that BDON
concentrations in the studied drinking water treatment plant were increased by ozonation and
decreased by biologically active filtration (Wadhawan et al., 2014). Though this study was done in fresh
drinking water it suggests not applying ozonation as the end treatment in wastewater unless followed
by biologically active filtration. Usually, ozonation is applied as a finishing treatment for disinfection (as a
substitute to chlorination) to reduce the concentrations of live organisms and other substances in the
effluent23
. One may conclude that dead organisms are more bioavailable for other organisms to
consume than live bacteria and viruses.
Ou and colleagues (2014) studied the growth and physiology of dinoflagellate Prorocentrum minimum as
a function of nitrogen sources. P. minimum is an active swimmer, toxic, photosynthetic and small size
23
http://www.water-research.net/index.php/ozonation visited on 12/18/2014
13. 13
plankton species. It is a common species found mostly in estuaries and is responsible for shellfish kills
and poisoning in humans24
. Ou and colleagues (2014) found that P. minimum was growing equally well
in response to equal amounts of nitrate, ammonium and urea. Their study also showed that P. minimum
was actively seeking and competing with bacteria to directly assimilate organic nitrogen. Approximately
18% to 20% of the nitrogen bound to the dissolved organic matter could be used by P. minimum for
growth as efficiently as it used inorganic dissolved nitrogen (Ou et al., 2014). Though this study was
done only on one species (which is not as common on the east coast of USA), one may still conclude that
algae thrives on organic nitrogen as much as on inorganic nitrogen. Thus, reductions in organic nitrogen
loads are critical to ensure decrease in nitrogen effects in coastal waters. Moreover, it will also help
reduce carbon loads to estuaries.
Top of the Document
Particulate nitrogen
Fine sediment in suspension sorbs and desorbs organic and inorganic nutrients quite rapidly (Fitzsimons
et al., 2011).
Middelburg and Herman (2007) studied European estuaries of the Atlantic coast and found that in
estuaries dominated by tides with intermediate to long residence times there is a high content of
suspended particulate matter (SPM). This is as a result of tidally and neap-spring induced repetitive
cycles of sediment deposition and erosion. In these systems, partitioning between the pools of dissolved
and particulate organic and inorganic nutrients (i.e. C, N) is mainly governed by SPM concentration in
the water. The fraction of estuarine nutrients in their particulate form increases as SPM concentrations
increase: 20% at SPM of ~10 mg/L; 60% at SPM of ~100 mg/L and 80% at SPM of ~1,000 mg/L
(Middelburg and Herman, 2007).
SPM may be very high in the maximum turbidity zone (MTZ) and near the bottom and may even result in
transient presence of fluidized mud in the bottom layers (Middelburg and Herman, 2007). Particles in
the MTZ and fluidized mud are subject to recurrent deposition and resuspension and oxic25
-anoxic
oscillations on short time scales (day to week) (Abril et al., 2010). This interaction can be viewed as a
chemical reactor with optimal solid-liquid exchange, substantially modifying the riverine nutrient input
before its transfer to the sea. In these systems, organic matter may show enrichment of up to 20‰26
due to internal heterotrophic processing (Middelburg and Herman, 2007).
Xu and colleagues (2013) suggest that nutrient sorption by SPM may locally inhibit eutrophication and
nutrient desorption may locally enhance eutrophication. Xu and colleagues (2013) also suggest including
SPM nutrient pools while calculating nutrient budgets for estuaries.
Top of the Document
24
http://species-identification.org/species.php?species_group=dinoflagellates&id=93 visited on 12/18/2014
25
Oxic conditions describe the presence of oxygen.
26
‰ parts per mille, parts in each thousand
14. 14
Hypoxia
In water there are two natural origins to oxygen: the atmosphere and photosynthesis.
The amount of oxygen dissolved into water from the atmosphere depends on its proportion in the air
and its solubility in water. If oxygen, nitrogen and other gases constituting the atmosphere were
perfectly soluble in water, they would easily diffuse into water through its surface to equalize their
partial pressures in the atmosphere. As a result we would have about 20% dissolved oxygen and about
80% dissolved nitrogen at the water surface.
However, oxygen solubility is very low in water and direct diffusion of oxygen into the water is very
slow. Thus, the majority of dissolved oxygen we find in water that originated in the atmosphere is a
result of active stirring of air and water at the water surface by wind and wave motion (surface water
agitation). Also, oxygen solubility is decreased with rising temperatures and rising salinity, and both vary
throughout the water column. In contrast to air that is uniform, low oxygen solubility and stratification
of gases even in the smallest water bodies make each water body unique27
.
Photosynthesis is a light dependent process thus doesn’t supply oxygen continuously. Photosynthesis
occurs during the day hours at the upper layers of the light illuminated water column. The amount of
light reaching the water surface depends on the season and the weather. During winter and during
cloudy days there will be less light available than during summer and clear sky days. Water turbidity and
shade determine the depth to which light can penetrate. The less turbid the water, the deeper the light
can penetrate.
Dissolved oxygen is also affected by temperatures, resulting in seasonal variations. Warmer
temperatures increase physical stratification of the water column, decrease oxygen solubility and
increase microbial activity (Lopez et al., 2014).
Low oxygen concentrations in water occur when oxygen is consumed and removed from water faster
than it is replenished by vertical and horizontal ventilation. Two major biological processes, respiration
and decomposition are responsible for consuming oxygen in water.
In chemical terms respiration and decomposition are the same process in which living organisms use
oxygen and complex organic substances to extract metabolic energy and nutrients (Figure 3). Metabolic
energy extracted from sugars for example maintains chemical transformations within the cells of living
organisms to support life activities such as building cells, moving materials throughout the body,
maintaining body temperature and moving around. Nutrients and carbon are the materials organisms
use to bio-synthesize new compounds needed to build their cells, DNA, amino acids and other complex
structures.
In coastal waters, nutrient enrichment can drive community respiration to levels that can deplete
oxygen in seawater, disturbing local biogeochemistry and killing oxygen dependent organisms.
27
http://www.fao.org/docrep/field/003/ac183e/ac183e04.htm visited on 12/18/2014
15. 15
Figure 3: Decomposition and respiration process
For example, macroalgae generates oxygen during the day via photosynthesis and during the night it
consumes oxygen in the respiration process. When macroalgae blooms, it can consume enough oxygen
during the night that at dawn there would be low oxygen conditions. If there are at least three
concurrent cloudy days no oxygen would be available in near-bottom waters leading to fish, shellfish
and other species kills. During a sunny day macroalgae photosynthesis would restore high oxygen
conditions in water (Valiela, 2006).
Algae are transported to depth either passively by sinking or actively via herbivory, stimulating its
decomposition by suspended and benthic microbial communities. Suspended microbial community was
found to account for more than 85% of the dissolved oxygen demand below the mixed layer (the rest
divided between benthic microbes and water chemistry) though at times benthic microbes could
account for more, especially after seasonal algae blooms (Lopez et al., 2014). Too much primary
production (algae) results in too much respiration by primary producers themselves and too much
respiration by their decomposers, depleting the dissolved oxygen, especially near the bottom. Lopez and
colleagues (2014) stress the importance of significant vertical and lateral physical ventilation to prevent
dissolved oxygen depletion. Their results show that oxygen could be completely depleted in 13 days by
plankton alone if no physical ventilation existed (Lopez et al., 2014).
In hypoxic waters the local biogeochemistry is disturbed and release of toxic substances to the water
column might be enhanced thus exacerbating the incorporation of toxins into the food web
(bioaccumulation and bio-magnification), eventually reaching humans (Varekamp et al., 2014). Low
oxygen in the bottom water and sediments can also increase the concentrations of ammonium
regenerated from the sediments by weakening the activity of nitrifying bacteria (requires oxygen), which
in turn increases ammonium loads in the bay (Valiela, 2006).
16. 16
Significantly greater abundance and diversity of benthic species were observed in areas where the
bottom water oxygen is higher than 3 mg/L (Valiela, 2006). Normal concentrations of dissolved oxygen
throughout the water column are above 7.5 mg/L (Wallace et al., 2014). If dissolved oxygen
concentrations are below 3 mg/L for more than a few hours it may kill oxygen dependent organisms,
especially immobile bottom organisms and young.
Top of the Document
Acidification
Acidification of the ocean happens in response to increased concentrations of carbon dioxide (CO2) in
the atmosphere (mostly due to fossil fuels combustion and eutrophication). In order to maintain a
constant chemical equilibrium between the atmosphere and seawater, more atmospheric CO2 dissolves
into the ocean. In seawater, CO2 reacts with water (H2O) to form carbonic acid (H2CO3). Carbonic acid
reacts in water to form bicarbonate (HCO3) while releasing an hydrogen ion (H+
). Consequently,
bicarbonate disintegrates to form carbonate (CO3) while releasing additional hydrogen ions in the water.
The more carbon dioxide is dissolved into water the more chemical equilibrium pushes toward
formation of carbonate and release of hydrogen ions. The more hydrogen ions are in water the more
acidic the water is ( Figure 4).
Figure 4: Ocean acidification
28
.
Carbon cycle in a nutshell: Carbon is captured by plants and microbes via photosynthesis. Some of the
carbon is released back to the water column during respiration when no sunlight is available. Once a
plant dies it sinks to the bottom of the sea. Part of its tissue is consumed by bottom-dwellers that
recycle nutrients and carbon back into the water column and the food web. Part of its tissue is buried
deep into the sediment or is exported into the deep ocean (Weis, 2014).
Top of the Document
Acidification effects on aquatic organisms
By changing the chemical properties of the ocean, ocean acidification has two major effects: It becomes
challenging for aquatic organisms to function normally in more acidic waters from breathing to
reproduction and it changes the bioavailability of building materials such as calcium.
28
http://reefkeeping.com/issues/2006-10/rhf/index.php retrieved on 11/10/2014
17. 17
Calcium carbonate is used by many marine animals to create shells and skeletons. Lower abundance of
calcium carbonate impairs calcium dependent organisms ability to thrive (Nunes et al., 2014). In more
acidic waters, calcium carbonate (CaCO3) dissimilates because carbonate (CO3) prefers to bond with
hydrogen ions (H+
) instead of calcium (Ca). As a result, mollusks such as shellfish, corals and sea urchins
are less able to assimilate aragonite and calcite. There are two common and naturally occurring calcium
carbonate crystal forms: aragonite and calcite. Aragonite is more soluble than calcite and dissimilates
easier in acidic water than calcite, thus bivalves (shellfish) are expected to be especially vulnerable to
acidification because they use aragonite to build their shells. Consequently, shellfish with weaker shells
will be more vulnerable to shell crushing predation (Weis, 2014).
On the US West Coast, where natural periodic upwelling of more acidic deep water happens, low
survival rates of larval oyster (spat) were observed (Weis, 2014). Ko and colleagues (2014) found that
oyster larvae pre and post settlement growth was delayed in combined conditions of increased acidity
(pH = 7.4), reduced salinity (15 psu)29
and warmer temperatures (30˚ C) (Ko et al., 2014).
Shellfish adhesives
Oysters, mussels and barnacles use adhesives to permanently attach themselves to surfaces and each
other. Oysters produce an organic-inorganic hybrid adhesive that is different from their shell and is
comprised of iron, a highly oxidized cross linked organic matrix of proteins and alternate calcium
carbonate crystals. Oysters, mussels and barnacles produce a cross linked protein matrix in their
adhesives though oyster adhesive content of proteins is lower. The majority of oyster adhesive is chalky
calcium carbonate giving it cement-like appearance (Burkett et al., 2010). Mussels and scallops use fine
hair-like threads called byssus (Martin et al., 2000) secreted from a gland on their foot to attach to
almost any kind of surface. Mussels stay attached to a surface for their entire life but scallops are
attached to eelgrass blades only while they are small and vulnerable to predation (as spat) (Richards et
al., 2015). Once scallops reach adult size they drop to the bottom and actively swim away from
predators30
. To summarize, mussels, scallops and barnacles use an adhesive that is softer, mostly made
from organic cross linked proteins and oysters use an adhesive that is harder, mostly made from
inorganic calcium carbonate.
In more acidic waters, the more organic adhesive loses its elasticity and breaks down more easily.
Mussels for example lose 40% of their ability to attach and hold on to surfaces (Weis, 2014). Oyster spat,
during the first 48 hours of their life, go through a growth spurt, growing shells and cementing it to a
surface, so they can start on feeding themselves. In more acidic waters, oyster larvae have trouble
growing their shells as the water dissolves it at a greater rate than they able to build it, eventually
resulting in spat death. It is unclear whether oyster cementing to a surface is also adversely affected by
water acidification since the calcium carbonate used for oyster cement has a different crystal form from
the one used to build its shell. In any case, oyster adhesive once formed is not easily dissolved even by a
strong acid (Burkett et al., 2010).
29
Ko and colleagues assumed that rainfall and the consequent enlarged river flow reduce salinity of estuarine
waters though the reality is more complex since in many places the rain itself is acidic.
30
http://www.savebuzzardsbay.org/DiscoverBay/AboutBuzzardsBay/FieldGuide/AnimalsPlants/BayScallop visited
on 12/31/2014
18. 18
Finfish
Though adult fish are quite resistant to ocean acidification, studies show that a common estuarine fish
(such as Menidia beryllina) is highly vulnerable to more acidic waters during its early stages of life
(Baumann et al., 2012). Baumann and colleagues (2012) found that the egg stage is more vulnerable to
low pH levels than the post-hatch larvae stage. Embryos that were exposed to low pH until one week
post-hatch stage showed lower survival rate (78%) and reduced body length (18%) (Baumann et al.,
2012).
In conclusion, acidification of the water column severely affects development and survival behavior of
many aquatic organisms, including finfish, crustacean and shellfish (Baumann et al., 2012, de la Haye et
al., 2012, Gobler et al., 2014, Weis, 2014). Although short term isolated laboratory studies don’t reveal
the complexity of real ocean community interactions, they show that fish and shellfish larvae often fail
to thrive and don’t live as long and grow as large as in more alkaline (less acidic) waters (Weis, 2014).
Organisms adaptation to ocean acidification
Studies showed that some species were able to adapt in the long run to more acidic waters, though
acute decreases in pH were detrimental to their survival (Weis, 2014). In one study, oyster larvae that
spawned from adults exposed to more acidic waters during reproductive conditioning developed faster,
grew larger and showed similar survival rates to larvae spawned from adults exposed to natural pH
levels (Parker et al., 2012). Parker and colleagues (2012) suggest that oysters may be able to adapt to
ocean acidification thru trans-generational exposure to more acidic waters and by changing their energy
allocation to fitness sustaining processes (metabolism). Similar trans-generational adaptation abilities
were shown in a coastal marine fish (Atlantic silverside Menidia menidia) in response to seasonal
variability in water acidity (Murray et al., 2014).
Additive effects of hypoxia and acidification
Gobler and colleagues (2014) studied the effects of concurrent hypoxia and acidification on bay scallops,
Argopecten irradians, and hard clams, Mercenaria mercenaria – both species are of major economical
and ecological value. Gobler and colleagues (2014) found that acidification (pH, total scale = 7.4–7.6)
reduced survivorship in larval scallops by more than 50% and reduced growth in early life stage clams by
60%. Low oxygen (30–50 µM) inhibited growth and metamorphosis of larval scallops by more than 50%
and led to 30% higher mortality in early life stage clams. Acidification and hypoxia combined produced
additively negative outcomes in larval scallops and reduced growth rates by 40% in later stage clams.
In the bays of New England, hypoxia and acidification often coincide, especially when driven by local
decomposition processes. Hypoxia and acidification additive and synergistic effects may pose a
significant challenge to the shellfish restoration efforts in New England.
Coastal acidification – Northeastern US
Although external atmospheric carbon deposition drives open ocean acidification, coastal acidification is
mostly driven by internal processes, especially within eutrophic regions where excessive nutrient
loadings are associated with large hypoxic events (Wallace et al., 2014). For example, though pH levels
19. 19
naturally change seasonally, annually and among different locations, release of CO2 from decaying
material on the bottom of the estuary speeds up the local acidification process (Weis, 2014).
Wallace and colleagues (2014) characterized oxygen and acidity levels in four eutrophic northeastern US
estuaries and found that acidification and hypoxia are annual features that co-occur and are primarily
driven by microbial respiration of nutrient rich algal biomass, with extremely high levels near sewage
discharges.
In all four estuaries, in May and in November, dissolved oxygen (DO) and acidity levels31
(pH) were
normal throughout the water column (DO > 7.5 mg/L, pHNBS > 7.9). However, in between, during
summer and fall months, low pH (< 7.4) conditions were detected in all systems simultaneously with
declines in DO concentration. Interestingly, the recovery from more acidic conditions took a month
longer than from lower oxygen conditions, especially in bottom waters, maybe due to water column
stratification (Wallace et al., 2014).
Blue carbon
Coastal vegetated habitats: tidal marshes, mangrove forests and seagrass meadows in addition to their
support of fisheries and shoreline stabilization, capture/fix carbon at a much higher rate than terrestrial
forests (known as “blue carbon”) (Weis, 2014). Coastal vegetated habitats are autotrophic and are highly
productive. They capture carbon in excess of carbon respired back by the biota (Duarte et al., 2005,
Duarte et al., 2010). Some of this excessive carbon (dead plants) is exported into the deep ocean and
some of it piles up on beaches, in support of the beach natural communities (Bouillon et al., 2008). The
majority of it is buried in the sediment right beneath the salt marsh, mangrove forest or seagrass
meadow and may stay there for millennia. Seagrass meadows for example, can form mats more than
three meters deep (Mcleod et al., 2011).
In conclusion, the only way to remove carbon from the system is by burying it deep into the ocean
sediment. At the same time as carbon is buried, nitrogen and other elements are buried with it bounded
to the dying organism.
Top of the Document
Tidal Marshes
Major ecosystem services delivered by tidal marshes include support of fisheries (nursery to estuarine
juvenile fish), stabilization and protection of the shoreline from storms, flood abatement, grazing fields,
habitat for wildlife such as birds, water quality (protection of the estuaries by assimilating pollutants in
runoff) and support of national and international tourism.
Tidal marshes suffer from many stressors. One of them is nitrate (NO3
-
) enrichment transported via
stormwater and groundwater and in tidal waters up the tidal-creeks and into the marsh.
31
pH stands for potential of hydrogen and is a measure of the relative acidity or alkalinity of a solution. NBS stands
for calibrated in dilute National Bureau of Standards buffers.
20. 20
Studies by Deegan and colleagues found that high nitrate concentrations brought in with rising tides
drove conversion of vegetated tidal marsh into mud flats (Deegan et al., 2012). The process starts at the
creek banks, affecting allocation of plant biomass and changing plant structure properties of the low
marsh grass, tall-form smooth cordgrass (Spartina alterniflora). After nine years of nitrate enrichment
(medium-high eutrophication levels), the creeks were widened and fractured. Interestingly, the line
between the low marsh and the high marsh was not migrating upslope to adjust while low marsh was
shrinking and no signs to creek-banks slope adjustment were seen (Deegan et al., 2012). Thus, it is still
unclear whether the marsh will find a new equilibrium or will continue to degrade.
The mechanism of the creek-bank structural failure is complicated and is a combination of plant-biology
and soil-mechanics. In affected marshes, Deegan and colleagues (2012) found fewer roots and rhizomes
in below ground biomass. In above ground biomass they found heavier and taller shoots that tend to
occur with increased nitrogen loading and lower structural compounds of foliar lignin.
High nitrate concentrations in water combined with readily-available highly-decomposable plant
detritus (high nitrogen content and lower lignin shoots) increased decomposition rates in the creek bank
sediments resulting in fine-grained less-consolidated creek banks that retained more water during low
tides (Deegan et al., 2012). It is important to note that roots and rhizomes bind sediments and create
macropores and large organic matter particles form air pockets, with both helping to drain creek banks
(Terzaghi, 1996).
During low tides, heavy water-logged creek banks cracked at the top and slid downward into the creek,
exposing high-marsh turf to water flow that removed sediments at the foot of the active rooting layers
and large chunks of high-marsh slumped into the creek as well (Deegan et al., 2012). To summarize,
direct effects of nitrogen enrichment changed in-plant nitrogen allocation and increased below ground
decomposition. As a result, soil strength decreased (Terzaghi, 1996) and water pore pressure increased
(Rinaldi et al., 2004) – both contributing to destabilization of the creek banks.
It is important to note that softer, nitrogen rich shoots make the grass also more attractive to grazers
(Coverdale et al., 2012, Altieri et al., 2013, Bertness et al., 2014a, Bertness et al., 2014b).
Bernot et al. (2009) found that in nitrogen enriched plots nitrate availability in porous waters is
increased but ammonium availability does not change.
Wigand and colleagues (2014) studied soil properties of tidal marshes in Jamaica Bay and found that
nitrogen-enriched tidal marsh kept pace with sea level rise as much as the less nitrogen affected tidal
marshes. The nitrogen-enriched tidal marsh experienced similar impacts compared to the previous
study mentioned, including elevated decomposition rates and decreased production of roots and
rhizomes. Nevertheless, it succeeded in keeping up with the relative sea level rise by producing larger
diameter rhizomes and swelling of the waterlogged peat. The adjacent less nitrogen affected tidal marsh
accumulated organic matter in its soil (Wigand et al., 2014). Both marshes accumulated material on
their surfaces (Wigand et al., 2014).
21. 21
In tidal marshes, soil properties that characterize elevated decomposition rates, more decomposed peat
and highly waterlogged peat include lower percentage of organic matter, lower abundance and lower
biomass of roots and rhizomes, larger diameter rhizomes, greater carbon dioxide emissions, greater
peat particle density, and lower soil strength (Wigand et al., 2014).
The phenomena of increased structural failure in tidal creek banks is significantly more important in
southern New England and Long Island salt marshes where low sediment delivery from rivers implies
that marshes have higher organic content to keep up with the relative sea level rise (RSLR) need to
accumulate organic material (OM) (Watson et al., 2014). Similar to Deegan, Watson found that plants
grown under nutrient-enriched conditions had less coarse roots and more fine roots that do not
contribute to long term OM accumulation (Morris et al., 2013). Watson also found that nutrient
additions stimulated the coupled process of sulfite reduction and OM mineralization in anoxic
conditions. Increased decomposition of OM also increases production of CO2 which in turn increases the
acidity in the porous water. Watson and colleagues concluded that nitrogen enrichment coupled with
increased inundation due to accelerated RSLR and increases in both precipitation intensity and drought
due to climate change will result in increased rates of salt marsh loss in the Northeastern US (Watson et
al., 2014).
Top of the Document
Seagrass Meadows
Seagrass meadows are an important coastal habitat that support many aquatic species and protect the
shore from erosion. Seagrass meadows support adult populations of estuarine finfish and mammals that
visit seagrass meadows to find food and shelter. Many young estuarine finfish, crabs and mammals
spend almost all their time in seagrass meadows as it is abundant with food and good hiding places
among its shoots and detritus (Weis, 2014). Some species depend entirely on eelgrass such as scallops.
Certain fish and birds such as geese and ducks feed on eelgrass, and their numbers decrease as seagrass
meadows disappear (Valiela, 2006, Weis, 2014). Seagrass leaves slowdown water currents and increase
sedimentation, their roots and rhizomes bind seafloor sediments together thus protecting the shoreline
from erosion by wind, waves and currents (De Forbes, 2008, Mallin, 2013).
Seagrass, Zostera marina, known also by its common name eelgrass, is a completely submerged
flowering plant that is found in shallow and deeper coastal mostly oligotrophic waters. Though it can
filter nutrients out of water, it requires clear water and plenty of sunlight. Thus its presence is a sign of
good water quality (De Forbes, 2008).
Destructive factors
Major groups of primary producers in coastal waters include: seagrass, phytoplankton, macroalgae and
epiphytes. Under oligotrophic conditions, nutrients limit primary production and seagrass flourish.
Under eutrophic conditions, light limits primary production. As a result, in shallow waters macroalgae
bloom, in deeper waters phytoplankton bloom, and in both shallow and deeper water seagrass decline
(Figure 5). The underlying direct mechanisms for seagrass decline besides light limitation include
22. 22
competition for nitrate, and for some species also nitrate inhibition and ammonium toxicity (Burkholder
et al., 2007). Sulfides, produced during anaerobic decomposition can also damage seagrass (Weis, 2014).
Figure 5: Nutrient and light limitations for primary producers (Burkholder et al., 2007).
Though direct responses of seagrass to nitrogen enrichment are incredibly diverse, the overall
conclusion is that seagrass meadows disappear in estuaries receiving nitrogen loads above 100-200
kg/ha/yr. The threshold to seagrass biomass, growth and production loss is very low. Significant losses
already occur when nitrogen loads are below 50 kg/ha/yr. Though nitrogen assimilation in seagrass
might have some direct detrimental effects, loss of seagrass meadows mainly occurs due to over
shading by other species in the same habitat such as macroalgae and phytoplankton (Valiela, 2006).
Eelgrass is also shaded out by epiphytes, a small algae that grows directly on its leaves and similar to
macroalgae cannot be controlled by grazers due to its overwhelming abundance (Weis, 2014).
Restorative and protective factors
Eelgrass meadows adjacent to larger coastal marshes have greater production and lower loss as
nitrogen levels increase (Valiela, 2006). Coastal marshes tend to export dissolved organic nitrogen,
23. 23
particularly organic nitrogen and ammonium, but less nitrate (inorganic nitrogen) due to high rates of
denitrification and burial (Valiela, 2006).
Successful eelgrass restoration efforts happened in Tampa Bay, though lagged by an estimated 25 years
once substantial reductions in nitrogen loads (72%) were achieved mainly by intercepting it in
wastewater effluent, and will still require a careful coordination between management, monitoring and
communication to preserve the success in the face of the growing population in the Bay (Bricker et al.,
2008).
Top of the Document
Shellfish
Shellfish includes bivalves such as oysters, scallops, mussels and clams. There are wild reefs, cultured
wild beds and aquaculture. The major threats to shellfish from eutrophication are indirect. Toxic blooms
create suspicion and raise the question whether shellfish is an appropriate food source for human
consumption because it filters the toxins out of the water in such an efficient manner. Seawater
acidification directly impacts shellfish health, development and survival rates. Scallops are directly
impaired by brown tides and threatened by seagrass elimination.
Shellfish reduce turbidity and improve water quality by filtering and incorporating 20-30% of the seston,
minute organisms and non-living matter floating or swimming in the water column (Rose et al., 2014).
Though shellfish that filter both toxic phytoplankton and wastewater (microbial contamination) is not
suitable for human consumption, there are benefits to shellfish increased activity in the bay and oyster
reefs are just one example (Rose et al., 2014).
Oyster reefs
Oyster reefs deliver multiple ecosystem services. Oyster reefs support greater variety and abundance of
marine organisms than adjacent tidal mudflats, including commercially important fish, shrimp, crabs,
gobies, blennies and more (Weis, 2014). Robust oyster reefs help process regenerated ‘legacy’ nitrogen
from the sediment into productive paths, eventually to be converted into gaseous forms by denitrifying
bacteria. Oyster reefs protect the shoreline from erosion during storm surges by reducing wave
strength.
Oysters recycle nutrients back into the water column and stimulate nitrifying bacteria below the reef by
fertilizing the seafloor with their excretions. Oysters improve water quality by filtering and consuming
nutrients, nitrogen-rich phytoplankton and detritus particles directly from the water column (Bricker et
al., 2014). Adult individual oysters can effectively filter/clean as much as 1.5 gallons of water in one hour
as it feeds on nutrients and other floating particles (Weis, 2014). In Chesapeake Bay, scientists found
that oyster reefs remove more nitrogen than adjacent tidal mudflats (Weis, 2014).
To summarize, healthy and robust oyster reefs support diverse and abundant marine life, partner with
benthic populations to stimulate nitrogen release back to the atmosphere and contribute to structural
stability of the shoreline, thus reducing damage to property and adjacent coastal habitats. Oysters are
24. 24
also commercially harvested though we need to be careful about what oysters are filtering and ensure
good water quality to reduce human illnesses (Weis, 2014).
Scallops
Scallops are sensitive to brown tides, to ocean acidification (Figure 6) and are habitat specific.
Figure 6: Lifecycle of Ballot’s scallop and acidification effects (Richards et al., 2015)
The Atlantic bay scallop, Argopecten irradians, is a commercially important edible bivalve species.
Scallops are the only bivalves that do not live under the sediment or attached to a surface for their
whole life. There is a short period when scallops are young (spat) during which they attach themselves
to seagrass leaves by a fine thread secreted from a gland on their foot (byssus) in order to stay out of
predators’ reach. As their shell grows, eventually they drop to the bottom and actively swim away from
predators32
though still using eelgrass canopy as a refuge from benthic and other predators such as rays.
Scallop populations decrease as seagrass meadows disappear.
Brown tides, Aureococcus anophagefferens, have a direct adverse affect on bay scallops. Bay scallops are in
particular vulnerable to stressors because few individuals survive to spawn more than once during their
short lifespan (less than 2.5 years) (Bricelj and Kuenstner, 1989). Brown tides cause growth inhibition
32
http://www.savebuzzardsbay.org/DiscoverBay/AboutBuzzardsBay/FieldGuide/AnimalsPlants/BayScallop visited
on 12/31/2014
25. 25
and recruitment failure of bay scallops (Bricelj and MacQuarrie, 2007). During June and July 1985, in
eastern Long Island Sound, brown algae bloomed on two consecutive years coinciding with bay scallop
spawning season. As a result, preventing establishment of new recruits and virtually eliminating the bay
scallop fishery in New York State (Bricelj and Kuenstner, 1989).
Bacterial World
Dissolved nitrogen gas (N2) is the most abundant chemical form of nitrogen in water, though it cannot
be used by most organisms. Most other chemical forms of nitrogen in water are reactive, thus
bioavailable (Figure 7).
Figure 7: Nitrogen cycle in the ocean
33
.
In the upper layers of the light illuminated water column, bacteria, Trichodesmium cogs, break the triple
bond in gaseous dinitrogen (N2) to convert it via photosynthesis into biologically available chemical
forms such as ammonium (NH4
+
) (Capone et al., 2008). Organisms can later use ammonium to generate
energy and build proteins and DNA. As organisms die, their biomass sinks to the bottom and is
decomposed by bacteria. The decomposition process consumes oxygen (O2) and generates plentiful
ammonium (NH+
4). As long as there are no local pockets of low oxygen conditions, denitrifying and
anammox microbes are not active. As a result, nitrate is accumulated, usually in the upper layers of the
water column and used by plants.
33
To read more detail about each step please visit Oceanus Magazine at Woods Hole Oceanographic Institute at
www.whoi.edu/page.do?pid=110417&cid=46925&cl=32332&article=53946&tid=5782.
26. 26
In low oxygen conditions, nitrification is suppressed and denitrifying and anammox microbes are active.
Denitrifying microbes reduce nitrate (NO3
-
) into nitrite (NO2
-
) and some of it directly into gaseous stable
dinitrogen (N2). Anammox microbes oxidize ammonium (NH4
+
) with nitrite (NO2
-
) to produced gaseous
stable dinitrogen (N2). Gaseous stable dinitrogen then leaks back to the atmosphere.
However, if lower oxygen conditions continue, nitrate and nitrite concentrations decrease. Once nitrate
is depleted denitrifying microbes cease their activity. Once the nitrite is depleted anammox microbes
cease their activity. The conditions in the sediment become anaerobic and affect the microbial
community assemblage as other chemical forms such as Fe3
+
, Mn4
+
and SO4
2-
are used to sustain their
metabolism (Berner, 1981). As a result, ammonium is usually accumulated close to the bottom, slowly
drifts and then re-suspended down the estuary to be consumed later by plants.
Sedimentary denitrification is a major component of the marine nitrogen cycle, especially because so
much dead material is precipitating onto the seafloor. It consumes dissolved nitrate, re-mineralizes
organic carbon and releases gaseous nitrogen to the atmosphere. Oxygen inhibits denitrification
enzymes but at the same time stimulates sedimentary nitrification, which produces the majority of
nitrates for the denitrification process to initiate (Gilbert et al., 2003).
In conclusion, maximum nitrogen removal rates depend on a combination of local oxic and anoxic
conditions that must occur in proximity to support microenvironments for the aerobic nitrifying
microbes and the anaerobic denitrifying and anammox microbes.
Top of the Document
Trawling and muddy coastal seafloor
Soft sediment bottoms are an important habitat for many commercially harvested fish (De Juan et al.,
2011). Many benthic organisms are an important food source for fish and play a major role in
re-mineralization of the organic matter deposited on the seafloor. Tidal flats are also important feeding
and breeding grounds to many local and migrating shore birds (Piersma, 2010). Tidal flats occur along
the edges of shallow seas with soft sediment bottoms (such as Long Island Sound), where the tidal range
is about one meter (Piersma, 2010). To harvest finfish and shellfish, coastal soft sediment bottoms
including tidal flats are routinely actively dredged by bottom trawls, scrapes, beams and/or dredges.
Shellfish of interest include oysters, mussels, cockles and lugworms (lugworms are used for fishing bait
and live at 30-40 centimeters sediment depth) (Piersma, 2010). Danish and Scottish seines and
mid-water trawls can also have significant effects on benthic habitats when parts of their gear touch the
sea bottom (Donaldson et al., 2010). Bottom mechanical dredging has cascading effects and causes
significant long term ecological damage to the benthic habitat and its users.
Dragging with bottom nets attached to beams or other anchors, tends to homogenize the sediment and
simplify the three dimensional structure of the habitat below and above the water-sediment interface
(Thrush and Dayton, 2010). Increased trawling activity reduces species abundance34
, total community
34
Species abundance is the number of individuals per species.
27. 27
biomass and species richness35
(De Juan et al., 2011). Ferguson and colleagues (work in progress) found
that trawling of the soft sediment retains 50% more bioavailable nitrogen in the microbial sediment
compartments than if not trawled (Figure 8)36
. Trawling also affects the composition of species in the
benthic habitat, replacing species that are vulnerable to trawling by those that are able to withstand
continuous trawling pressure (De Juan et al., 2011). As a result, the coastal ecosystem loses important
functions and structure (De Juan et al., 2011).
Figure 8: Trawling effects
22
.
Trawling studies offer the opportunity to learn about the characteristics of the benthic community that
promote aerobic decomposition of organic matter and release of N2. There are two major mechanisms
that increase nitrification and denitrification rates in the sediment: one is aeration of the upper layer of
the sediment (Figure 9) and the other is enhanced nutrient fluxes into the upper layer of the sediment.
Both mechanisms rely on the existence of a robust and diverse benthic community.
35
Species richness is the number of different species represented in an ecological community.
36
Ferguson, A. J. P. and Eyre, B. D. Benthic trawling impacts biocomplexity and critical ecosystem functions. Work
prepared for publication in the Journal of Geophysical Research.
Information obtained from http://scu.edu.au/coastal-biogeochemistry/index.php/46/ on 10/23/2014
28. 28
Figure 9: Sediment oxygenation
37
.
Species that are sensitive to trawling include sessile cnidarians38
, large echinoderms39
and bivalves40
. De
Juan and colleagues (2011) noticed in their study that heavily trawled grounds were dominated by
epifaunal (above ground) small mobile and burrowing invertebrates such as starfish and small shrimp.
Grounds that were not trawled showed higher epifaunal abundance of bivalves, pelagic fish and sessile
suspension feeder41
cnidarians such as sea pens and sea anemones that attach themselves to the
sediment/pebbles and filter plankton from the water column. Sessile suspension feeder cnidarians are
highly sensitive to increased turbidity and direct contact with trawling equipment (De Juan et al., 2011).
Grounds both trawled and not trawled, were dominated by infaunal (below ground) marine bristle
worms that burrow tube like homes in the sediment. The less trawled grounds though were of higher
diversity and showed higher abundance of other infaunal organisms such as brittle stars (detritus
feeders that live under the sand and mud with only their legs protruding), burrowing bivalves
(suspension feeders such as quahog) and peanut worms that consume detritus and live in burrows or
discarded shells (the way hermit crabs do). The less disturbed benthic habitat was, the more three
dimensionally complex it’s structure was, and therefore had more biogenically structured communities
(De Juan et al., 2011).
Burrowing organisms, especially large invertebrate deposit-feeders such as worms that burrow tube-like
homes, mix and oxygenate the sediment substrate. This type of bioturbation42
also maximizes the
denitrification potential43
by increasing the surface area available for diffusive exchange of nutrients
between aerobic and anaerobic adjacent microenvironments around biogenic structures such as
tunnels. Plants also contribute to sediment oxygenation and nutrient exchange via their roots.
37
http://www.ozcoasts.gov.au/indicators/benthic_inverts.jsp visited on 12/24/2014
38
Sessile cnidarians are immobile marine invertebrates such as sea anemones, corals and sea pens.
39
Echinoderms are marine invertebrates such as starfish, sea urchins, sand dollars, sea cucumbers, and sea lilies.
40
An aquatic mollusk that has a compressed body enclosed within a hinged shell, such as oysters, clams, mussels,
and scallops.
41
A suspension feeder is an animal that feeds on material (such as planktonic organisms) suspended in water and
that usually has various structural modifications for straining out its food.
42
Bioturbation is the disturbance of sedimentary deposits by living organisms.
43
Denitrification is an anaerobic process but depends on availability of nitrites that are a result of an aerobic
nitrification process.
29. 29
Lohrer and colleagues (2004) show that trawling of the soft sediment seafloor, the most widespread
ecosystem on earth, may reduce primary production in coastal oceans by disturbing positive feedbacks
between grazers, deposit feeders (i.e., urchins) and the sedimentary microbes. For example, urchin
activity on the seafloor increases nutrient exchange between the pelagic (water column) and the
in-sediment environments by digesting the detritus, depositing excretions and physically mixing the
sediment. As a result, microphytobenthos (sedimentary microbes and unicellular algae) have improved
conditions and increased productivity. Trawling reduces the number of urchins on the seafloor as those
are caught up in the net and are removed, eventually, reducing sedimentary productivity (Lohrer et al.,
2004).
In the bioturbated zone nitrification-denitrification relationships are a function of the space between
oxygenated burrows, their size, and macrofaunal species specific activities such as mucus secretion and
bioirrigation44
(Gilbert et al., 2003). Nitrification-denitrification is a complex process and includes
multiple reaction paths. For example, in addition to aerobic nitrification, anaerobic nitrification might
occur as well via the Mn-oxide reduction path (Gilbert et al., 2003).
In conclusion, it is hard to quantify what specific environmental conditions reach optimal
nitrification-denitrification rates. It is clear though that in order to maintain highly productive
sedimentary microbial communities, it requires an aerobic and biologically complex environment at the
sediment-water interface. In other words, it requires restricting trawling, encouraging habitat
bioengineering and elimination of bottom hypoxia.
Top of the Document
Toxic cyanobacteria
Cyanobacteria are one of a very few groups of organisms on earth that can convert the inert
atmospheric dinitrogen into bioavailable organic nitrogen, such as nitrate and ammonium.
Cyanobacteria are photosynthetic widespread organisms, found in aquatic and terrestrial (i.e., soil)
habitats. Aquatic cyanobacteria are abundant in fresh, brackish and marine waters worldwide. There are
planktonic (in the water column) and benthic (in the bottom sediment) cyanobacteria (Lopes and
Vasconcelos, 2011).
Aquatic cyanobacteria (known as blue-green algae) though microscopic can be noticed by the naked eye
due to the color (blue, red or pink) of their photosynthetic pigment, chlorophyll a. Cyanobacteria are of
great chemical diversity and produce a variety of biologically active compounds, some of which are of
high toxicity to other living organisms including humans via drinking, touch and digestion. Some toxins
are produced by all cyanobacteria species and some are produced just by a specific species45
. Thus,
reduction of cyanobacteria blooms either in fresh, brackish or marine environments reduce the release
of cyanobacterial toxins into the environment and consequently reduce the health risk from
cyanobacterial poisoning.
44
Bioirrigation is the process of benthic organisms flushing their burrows with overlying seawater, increasing the
exchange of dissolved substances between pore water and seawater.
45
http://www.ucmp.berkeley.edu/bacteria/cyanolh.html visited on 1/21/2015
30. 30
Cyanobacterial blooms are dependent on nutrient availability and water temperature. The predominant
cyanobacteria species to bloom is largely affected by salinity levels (Mulvenna et al., 2012).
Cyanobacteria bloom and form thick mats during the warmer months of the year when temperatures
and sunlight are optimal, in stratified, slow flowing, nutrient-rich waters46
. Sometimes the thick mats
created by cyanobacteria sink to the bottom but still continue to function. After the bloom visually has
gone and the bacteria have died and dissimilated, the toxins may still stay in the water for a period of
time (AUDW, 2009).
Lopes and Vasconcelos (2011) studied the occurrence, diversity and toxicity of cyanobacteria in
European estuaries and other brackish environments of the Atlantic Ocean, the Mediterranean Sea and
the Baltic Sea. They found that the dominant brackish cyanobacteria belong mainly to the planktonic
genera Nodularia, Aphanizomenon and Anabaena and to the benthic forms of Anabaena and
Phormidium. Brackish cyanobacteria mostly produce microcystin and nodularin, both are liver toxins
(hepatotoxins). The benthic brackish cyanobacteria forms also produce toxins such as anatoxin-a and
other bioactive compounds such as apoptogens (Lopes and Vasconcelos, 2011). Lopes and Vasconcelos
(2011) discuss potential health risks from brackish water toxic cyanobacteria though they note that
reports of animal poisoning by brackish water toxic cyanobacteria are scarce and no cases of human
intoxication are yet known.
Mulvenna and colleagues (2012) developed a risk assessment for cyanobacterial toxins in seafood
harvested from Australian brackish coastal Gippsland Lakes. Since 1985, there were recorded seven
non-cyanobacterial and twelve cyanobacterial toxic blooms. Non-cyanobacterial blooms included
blooms mostly by diatoms and dinoflagellates. Cyanobacterial blooms included frequent blooms by
Nodularia spumigena and sporadic blooms by Anabaena circinalis and Microcystis aeruginosa. Toxins
produced by cyanobacterial blooms included microcystins, nodularin, saxitoxins and cylindrospermopsin
(Mulvenna et al., 2012).
Microcystis aeruginosa lives also in freshwater. Freshwater Microcystis aeruginosa produces
microcystins (known as liver toxin). They form blue-green scum on the surface of the pond. Skin contact
with Microcystis blooms can cause skin irritation, rashes, burns and mouth blisters. Ingestion or
inhalation of Microcystis aeruginosa blooms from an infested pond can cause vomiting, nausea,
headache, diarrhea, pneumonia and fever. It is important to note that typical water treatment processes
do not fully remove microcystins that are present in drinking water supplies that are stored in reservoirs.
No deaths in humans were reported yet but livestock, wildlife and dogs have died following exposure to
this toxin (OEHHA, 2009).
Nodularia Spumigena can be found in both freshwater and brackish water (Voß et al., 2013). Nodularia
Spumigena produces nodularin, a hepatotoxin (liver-affecting toxin) (Simola et al., 2012). Drinking of
nodularin affected waters can kill domestic pets, livestock and wild animals. Nodularin is known to
contaminate drinking water as well as to accumulate in mussels, prawns and fish. Reported symptoms of
human nodularin toxicity include stomach complaints, headaches, eczema and inflammation of the
46
http://www-cyanosite.bio.purdue.edu/cyanotox/toxiccyanos.html visited on 1/21/2015
31. 31
eyes. Shellfish harvesting warnings were issued for example in Peel-Harvey Estuary in Western Australia
(AUDW, 2009).
Cyanotoxins persist in the environment and are highly toxic. They cause odor and taste in drinking water
and illness in humans, requiring special treatment of the drinking water (Anderson, 2015, Su et al., 2015,
Vlcek and Pohanka, 2015). Hepatotoxins produced by cyanobacteria can be transferred to humans and
other higher organisms by mussels (in freshwater, brackish and marine environments) (Barda et al.,
2015). Recently, the World Health Organization set a new provisional guideline value for microcystin-LR
of 1 mg/L in drinking water, which will require development of new technologies, monitoring and
consideration of drinking water treatment byproducts (Agrawal and Gopal, 2013). Alternatively,
reducing nutrient inputs into the environment from farms, lawns, sewage and other anthropogenic
sources could decrease occurrence of toxic blooms and reduce the health risk associated with
cyanobacteria poisoning.
Top of the Document
Onsite Wastewater Treatment (OWT) Systems
Septic systems and cesspools are onsite wastewater treatment (OWT) systems for individual homes,
multifamily, businesses, small communities and institutions. In the US, about 20% of homes use OWTs,
especially in rural places that are distant from centralized wastewater treatment plants and in
waterfront areas. In RI, MA and CT about 30% of state residents use OWT and 20% in NY. However, OWT
in coastal areas is more common. For example, 70% of the Suffolk County on Long Island, NY use OWT,
and most are cesspools (USNYSC, 2014). On Cape Cod, MA, 85% of all buildings use OWT, and most are
conventional septic systems (Heufelder et al., 2007, Schaider et al., 2013).
Every year, about 10-20% (25% in MA and RI, 4% in NY)47
of the OWT systems fail due to age, hydraulic
overloading (in some areas due to sea level rise), improper design, improper installation and improper
maintenance. In reality, with no routine maintenance of the systems and no monitoring of their
performance in place, total failure rates are significantly higher than historical statistics suggest because
system owners are not likely to replace malfunctioning septic systems unless serious problems arise
such as sewage backup and septage pooling on lawns (USEPA, 2002). It is important to note that
cesspools are still in use on many properties in RI, MA, CT and NY and pose a threat too. Malfunctioning
septic systems are the second greatest threat to groundwater pollution in US (USEPA, 2013).
Interestingly, malfunctioning OWT reduce property values. Also, the mounting evidence that OWTs can
pollute groundwater, surface water and increase public health risks create a negative public perception
of OWT (USEPA, 2002).
47
Failure numbers were derived mostly from state records that required a property assessment at the time of its
sale. It is important to note that these are usually neither full nor consistent records and only include homes that
were on the market. Thus, the real failure numbers are probably higher.
32. 32
Oakley and colleagues (Oakley et al., 2010) estimated that about 60% of the total reactive nitrogen
discharged into the environment comes from decentralized wet (i.e. septic systems) and dry (i.e. pit
privy) waste disposal systems, which is about 15.2 Tg N/yr globally. Arnold and colleagues (2014) used
ultrahigh resolution mass spectrometry to characterize coastal groundwater affected by septic system
effluent and found that it is more abundant in nitrogen containing formulas. These nitrogen containing
formulas are also heavier with carbon and are ‘protein-like’ and ‘lipid-like’ (Arnold et al., 2014).
The conventional septic tank – soil absorption system removes only 10-20% of the total nitrogen before
discharging the effluent into the environment, which is insufficient to comply with current total nitrogen
effluent standards for OWT systems in nitrogen sensitive areas such as drinking water aquifers, shallow
aquifers and proximity to water bodies. For example, Massachusetts restricts total nitrogen loading from
OWT to less than 10 mg/L. Rhode Island restricts OWT total nitrogen loading to less than 19 mg/L
(Oakley et al., 2010). Information could not be found on mandatory numerical standards for OWT
nitrogen levels in CT or NY States (USCT, 2011, USNY, 2012). These standards were developed without
statistical consideration of sampling frequency and other factors in OWT designs. Also, important
performance variables (i.e. flows, loadings, inhibitory compounds, etc.) vary in the field, thus identical
OWT systems may show mean effluent concentrations that vary by a factor of two (Oakley et al., 2010).
Top of the Document
Spotlight on nutrient pollution in coastal groundwater
In many coastal ecosystems, subterranean groundwater discharge is a significant source of dissolved
nitrogen and can be attributed to a large portion of coastal marine primary production. The eastern
coast of the US consists mostly of highly permeable glacial washouts (sand and gravel) that allow
groundwater transport of nutrients and contaminants along hundreds of meters over months and years
(Moran et al., 2014). In sandy coastal sediments, such as in Rhode Island, Long Island, NY and Cape Cod,
groundwater is very sensitive to onsite waste disposal. A number of studies have shown that as the
human population grows, nitrate concentrations and bacteria abundance increase in groundwater to
reflect population density (Moran et al., 2014 and references therein).
OWT systems (mostly conventional septic systems) contributed about 60% of the total nitrogen load to
San Lorenzo River in California during the summer months as recharge to baseflow and 74% of the total
nitrogen load to Buttermilk Bay in Massachusetts (USEPA, 2002, Oakley et al., 2010).
In Chesapeake Bay, a statistical analysis showed a sharp decline in seagrass coverage in subestuaries
where watershed septic system density exceeded 39 units/km2
(approximately more than one septic
system every six acres) (Li et al., 2007). Another study in Chesapeake Bay tributaries, found significant
attenuation of total phosphate and fecal microbes in the drain fields, but the dissolved inorganic
nitrogen concentrations reaching the estuary were 50-100 fold higher than in adjacent waters (Reay,
2004). A direct connection was also found between nitrogen originated in septic systems and
eutrophication of New Zealand lakes and hypoxia problems of Hood Canal in Washington State (Oakley
et al., 2010).
33. 33
A statistical study in Maryland found that 1% increase in the number of the septic systems in a
community relying on groundwater as their water supply was associated with a 1.1% increase in their
well water nitrate concentration (Lichtenberg and Shapiro, 1997). Kinney and Valiela (2011) linked 50%
of total nitrogen entering Great South Bay, New York to wastewater, mostly residential onsite septic
systems and cesspools. Lloyd (2014) linked 49.6% of land based nitrogen in Peconic Estuary, New York to
wastewater, mostly residential onsite septic systems and cesspools.
Moran and colleagues (2014) investigated a few coastal salt ponds in Southern Rhode Island and found
that groundwater contributed between 29% to 93% dissolved inorganic nitrogen of the total external
input, which resulted in 4% to 74% of water column primary production. Results showed relatively high
concentrations of ammonium (NH4
+
) and phosphate (PO4
-3
) in the emerging groundwater, suggesting
low groundwater flow and associated low oxygen conditions (reducing conditions). Results also showed
that groundwater emerges along the shoreline as it approaches the coast and it is suppressed and
uplifted by seawater (Moran et al., 2014). Moran and colleagues (2014) found strong correlation
between high nutrient concentrations in groundwater and the proximity of heavily fertilized land uses
such as golf courses, large agricultural farms and a baseball park, revealing an important mechanism for
supplying nutrients to coastal groundwater.
Top of the Document
Innovative nitrogen removal systems
A demonstration project funded by EPA in Oregon looked for innovative technologies to reduce nitrogen
loads exported from septic systems in highly permeable soils over a shallow aquifer. Barbara Rich, the
project coordinator, found that it is difficult to achieve sufficient nitrogen reductions in the field and
that several nitrogen removal systems that performed well in test centers didn’t perform as well in the
field. Rich concluded that in order to reach consistent reductions below 10 mg TN/L in the field a
secondary carbon source needed to be added to the OWT system such as methanol (Rich, 2005, Rich,
2008).
Grinnell (2013) developed an onsite sequential nitrification-denitrification system to optimize nitrogen
removal and found during a field test that though the two-step vegetated woodchip system was less
efficient during the cold months it still removed 92% of the total nitrogen on average in residential
wastewater effluent. The nitrogen levels in the effluent leaving this treatment septic system were
reduced to 1.7 ± 1.0 mg TN/L during warm months and 6.4 ± 4.2 mg TN/L during cold months (Grinnell,
2013).
Oakley and colleagues (2010) compared nitrogen removal rates by 20 OWT different systems and
concluded that passive, more natural system designs (i.e., post-anoxic single-pass sand filter with
denitrification bed of solid carbon (SPSF/DB), system number 14 in Figure 10) offer a more reliable and
robust alternative, use the least amount of energy and exhibit treatment performance equivalent to
centralized plants.
Using more natural system designs have additional benefits, including optimizing denitrification,
increasing system reliability, mitigating sprawl, using natural nitrogen sinks and supplying habitat for
34. 34
wildlife. More natural system designs require a larger areal footprint, suggesting that in places where
land is limited, a compact and mechanized OWT system can be used to improve nitrogen removal rates
(Oakley et al., 2010).
Figure 10: Effluent total nitrogen concentrations in field trials (Oakley et al., 2010)
Oakley and colleagues (2010) mentioned that organizations such as the National Sanitation Foundation
(NSF) (that works with the Massachusetts Alternative Septic System Test Center) certify certain
proprietary OWTs based on design and a limited number of trials to meet a given total nitrogen effluent
standard or percent removal. Approved OWTs are assumed to comply with standards and once installed
do not require routine, site specific monitoring, which does not assure compliance for individual OWTs
on a continuous basis (Oakley et al., 2010). Oakley and colleagues (2010) suggest to base regulatory
standards (as it is commonly done for centralized wastewater treatment plants) on performance
characteristics and reliability analysis (i.e., the probability of the effluent being below a certain
standard).
On Cape Cod, MA, under the revised “Title 5” (310 CMR 15.000), 1,100 innovative/alternative (I/A) OWT
systems were installed between 1995 and 2007 that have the potential to remove nitrogen. Heufelder
and colleagues (2007) described the performance of the I/A technologies in spite of low sample number
and high variability in field results (Figure 11). Figure 11 shows performance results for I/A OWT
technologies such as Fixed Activated Sludge Treatment (FAST), Modular FAST (Modular), Bioclere,
Recirculating Sand Filters (RSF), RUCK and Nitrex that have more than four total nitrogen (TN) samples
from their effluent.
35. 35
Figure 11: Nitrogen removal by OWT innovative technologies (Heufelder et al., 2007).
Top of the Document
Permeability, redox and nutrient transport in groundwater
Depending on the redox48
conditions in the soil vadose zone49
and its depth beneath the drain field,
either nitrates or ammonium will be mostly exported into the groundwater. Groundwater flow and
groundwater redox conditions affect the internal chemical transformation processes in the saturated
zone (groundwater) and are reflected in nutrient chemical forms accumulated in emerging groundwater
into surface waters (Moran et al., 2014). The magnitude of nutrient contamination also depends on the
depth of the vadose zone, distance from downstream surface water body, tidal movement and rain
frequency (Mallin, 2013). Many septic systems greatly rely on natural soil processes to treat their
effluents though usually do not have the required space to reach agreeably low concentrations of
pollutants.
To maximize denitrification and anammox processes, both oxic and hypoxic zones should exist in a deep
vadose zone beneath the drain field to allow natural processes enough time and space to treat the
effluent. In the oxic zone, nitrification mediated by aerobic ammonia- and nitrite-oxidizing bacteria
produce nitrates. In hypoxic zone, denitrifying microbes reduce nitrate to gaseous dinitrogen and
48
Redox stands for reducing and oxidizing. Redox conditions define whether nitrogen will be reduced (remain
ammonium) or oxidized to nitrate and then whether it will be reduced to dinitrogen gas.
49
Vadose zone is the unsaturated soil above the groundwater table.
36. 36
anaerobic anammox microbes convert the remaining ammonium and nitrite directly to gaseous
dinitrogen (Robertson et al., 2012).
Under sufficiently aerated soils (oxidizing conditions), most of the ammonium in the wastewater is
oxidized by nitrifying microbes to nitrate. Nitrate is highly soluble and moves rapidly through the soils
with water (Mallin, 2013). Nitrate concentrations higher than 10 mg/L have been documented in septic
plumes more than 100 meters from their point of origin (USEPA, 2002).
In insufficiently aerated soils (reducing conditions), nitrification is suppressed and elevated ammonium
concentrations may occur in the septic plumes. Ammonium binds to soil particles and is not as mobile in
soil as nitrate. However, in sandy, porous and waterlogged soils ammonium can reach and discharge
into adjacent water bodies (Mallin, 2013).
Phosphate in septic plumes readily binds to soil particles and is much less mobile than nitrate (Mallin,
2013). However, in sandy soils or in phosphate saturated soils, phosphorus concentrations of 1 mg/L
have been documented in septic plumes as far as 70 meters from point of origin (Robertson et al.,
1998).
In general, septic plumes tend to be narrow, long and well defined with little dispersion. For example, in
Florida, a septic plume from under an OWT leaching field in a carbonate-depleted sandy aquifer reached
a river 20 meters away after a year and a half of operation. At another site, an OWT was constructed on
a similar shallow sandy unconfined aquifer. After 5 years the septic plume dimensions were 18 meters,
14.5 meters and almost half a meter for longitudinal, lateral and vertical dispersion. After twelve years
the septic plume had clear spatial boundaries: a length of 130 meters and a uniform width of 10 meters
(USEPA, 2002).
One may conclude here that septic systems that are close to surface water bodies are more likely to
contribute ammonium, phosphate or nitrate to that water body than septic systems further away. One
may also conclude here that 100 feet (30 meters) separation zones adopted by many states to protect
vulnerable water bodies won’t necessary offer the expected protection from contaminants, pollutants
and nutrients originated in septic systems.
Top of the Document
Closing Comments
Vegetated coastal habitats are irreplaceable for the benefits they offer human society. Mangrove
forests, tidal marshes and seagrass meadows are highly biodiverse and highly productive, supporting
ecosystem functions, including stabilizing the shoreline, reducing turbidity, fixing carbon, capturing
nitrogen, and supporting local fisheries and foraging marine populations (Orth et al., 2006). Shellfish also
play an important role in maintaining healthy coastal waters by reducing turbidity, increasing
biodiversity, stabilizing the sediment and offering a good source of food. Even coastal mudflats, rich and
abundant in bioengineered benthic communities contribute to a robust coastal ecosystem.
Unfortunately, all these habitats are stressed and disappearing in an alarming and accelerating pace.