1. Case-Study 1. The Oresund Link
The Oresund Link connects Malmo (Sweden)
with Copenhagen (Denmark). The link is part
bridge, part tunnel with an artificial island at the
cross-over.
Overall Score = ‘Very Good Practise’
Environmental Score = ‘’Very Good Practise’
Economic Score = ‘Good Practise’
Social Score = ‘Very Good Practise’
Positive Indicators = Ecological Impact, Waste
Management, Use of Natural Material,
Consideration of Environmental Climate Change,
H&S, Stakeholder Engagement, Visual Impact,
Ecology, Educational Improvements,
Consideration of Social Climate Change
Negative Indicators = Energy Use
Development of the CBSA model
Using the conclusions from the literature review,
the CBSA model was developed into a 9-stage
method:
Stage 1) Initial Research
Background research of bridge location &
sustainability ‘needs’ of that location.
Stage 2) Indicator Selection
Use Stage 1 to select suitable indicators.
Stage 3) Indicator Weighting
Indicators are weighed according to their
significance to bridge’s overall sustainability.
Stage 4) Indicator Aggregation
A minimum weighting limit is set & insignificant
indicators are aggregated from model.
Stage 5) Identifying Key Design Options
Key design options & alternatives are identified.
Stage 6) Pairwise Comparison of Design Options
AHP & pairwise comparison methods use matrix
calculations to establish the overall more
sustainable design options in comparison to their
alternatives.
Stage 7) Normalised Indicator Assessment
The bridge’s indicators are assessed as a whole &
normalised into a tabulated Linkert Scale.
Stage 8) Results
The results of Stage 7 are tabulated.
Stage 9) Visualisation
Results are input into a visual ROSE plot.
Sustainability Assessment
of Complex Bridges
James Serpell
11027311
Advanced Final Year Project Report
Prof. Crina Oltean-Dumbrava
The Story so far…
Following the development of the New Road
Bridge Sustainability Assessment (NRBSA) model,
it was clear that some improvements had to be
made in creating a useable model in reality. In
doing this, the NRBSA model as been adapted to
cater to ‘complex’ bridges such as the Millau
Viaduct.
Project Aims
Adapt & Improve the NRBSA model to create a
Complex Bridge Sustainability Assessment (CBSA)
model.
Methodology
- Research & critically analyse existing models &
indicators (literature review).
- Adapt & improve the NRBSA model to develop
the CBSA model.
- Test the CBSA model on an existing bridge case-
study (post-construction stage).
- Test the CBSA model on a proposed bridge
case-study (design stage).
- Discuss results, note advantages &
disadvantages.
Conclusions from Literature Review
- Analytical Hierarchy Process (AHP) has proven
a useful tool in sustainability assessment.
- The individual assessment of key design
options is a good way to promote sustainable
design.
- Useful data for the Oresund Bridge was found.
Case-Study 2. The Solent Link
The Solent Link is a proposed crossing from
Gurnard (the Isle of Wight) to Lepe (England). It
is a floating bridge with a raised main span.
Overall Score = ‘Very Good Practise’
Environmental Score = ‘’Very Good Practise’
Economic Score = ‘Very Good Practise’
Social Score = ‘Very Good Practise’
Average Indicators = Employment
Negative Indicators = Use of Natural Materials
Conclusion & Future Recommendations
- AHP/Pairwise Comparison methods proved
useful & accurate.
- Assessing individual design options aids in the
design process.
- Introduction of new assessment methods
(scaled, credit-based, flow charts etc.)
- Need to move from academic report to
professional model by improving usability.
- Implement Engineering Analysis Sheets & AHP
computer models.
- Employ experts for assessment team.
Figure 1. Millau Viaduct
Sustainability
score
Very poor
practise
Poor practise Average Good practise Very good
practise
Data range £0-£100 £101 - £5000 £5001 -
£1,000,000
£1,000,001 -
£5,000,000
>£5,000,000
Table 1. Normalisation Table Example
Figure 2. Visualisation Wheel Example
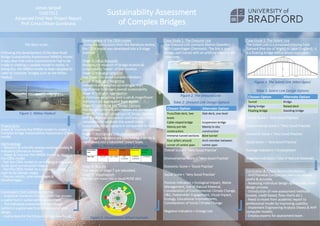
Figure 2. The Oresund Link
Chosen Option Alternate Option
Truss/Slab deck, two
levels
Slab deck, one level
Cable-stayed bridge Suspension bridge
Mainly pre-fab
construction
Mainly in-situ
construction
Immerse tunnel sections Bore tunnel
Four pillars around
corner of centre span
Arch member between
centre span
Table 2. Oresund Link Design Options
Figure 3. The Solent Link (Main Span)
Chosen Option Alternate Option
Tunnel Bridge
Swing bridge Raised deck
Floating bridge Standing bridge
Table 3. Solent Link Design Options