
Recommended
Recommended
More Related Content
What's hot
What's hot (20)
Similar to Identifying components and concentrations in samples given using hplc
Similar to Identifying components and concentrations in samples given using hplc (20)
Recently uploaded
Recently uploaded (20)
Identifying components and concentrations in samples given using hplc
- 1. 1 Identifying components and concentrations in samples given using HPLC, GLC and ICP-AES Formal laboratory report – Jacob Scholes Introduction There were three techniques used to determine either components and concentration within samples given, those techniques included high performance/pressure liquid chromatography (HPLC), gas liquid chromatography (GLC) and inductively coupled plasma atomic emission spectroscopy (ICP-AES). The objective for the HPLC experiment was to identify and quantify organic compounds (sweeteners) in branded and generic diet soft drinks. The reason for using HPLC within this experiment is because the sample given contains organic analytes which HPLC can separate effectively. The analytical method separates the organic compounds out due to the differences in reactivity with the absorbent material inside the HPLC machine causing different flow rates for the organic analytes as the flow out of the column.1 The objective for the GLC method was to analyse different types of perfumes (high street and branded). GLC is used to separate compounds that can be vaporised but not decomposed and can prepare pure compounds and identify organic compounds from samples. The gaseous compounds of interest interact with the inside walls of the chromatography column which is covered with a stationary phase and they leave the column at different times. This gives each compound a unique “retention time”. The comparison of these retention times is why we are using GC.2 Finally, the objective for the ICP-AES was to quantify elements within the branded and homemade energy drinks. The reason ICP-AES was chosen was because it can identify different elements present within the sample. It does this by exciting the atoms in the sample using plasma and the different elements within the sample give off a specific wavelength. We can then use the results by identifying the element with a table of standard results.3 Methods • HPLC – Within this experiment, there were a range of different sweeteners which were used in generic and branded soft drinks that were analysed using HPLC. The three sweeteners used were Saccharin, Aspartame and acesulfame K, and all 3 were analysed and compared to one another using their unique retention time given by the analytical technique HPLC. In order to obtain the sweetener’s retention time to be able to compare them, we needed to produce a chromatogram for each of the sweeteners. The first task was to set the HPLC data system to be ready for our given samples to be injected into the injector port. The samples were degassed branded and generic diet soft drinks and injected in that order. The first sweetener to be injected into the machine was Saccharin (50mg L-1 ) followed by Acesulfame K (25mg L-1 ). Then our standards needed to be injected for Aspartame (100mg L-1 - 500mg L- 1 ). These standards for Aspartame were simply done to allow for more in depth
- 2. 2 analysis of the generic compared to the branded later on as well as finding the concentrations of aspartame. On a HPLC machine, there will be a 6-point Rheodyne injector port valve which allows for a specific amount of sample into the chromatography column as it ejects any waste by mixing the samples with the mobile phase. In this experiment, the mobile phase used was HPLC eluent: 20% acetonitrile, 80% buffer which was 10mM ammonium acetate and 0.1% trifluoroacetic acid (pH 2.6). The wavelength set for the experiment was to 255nm. This was done as this wavelength is present in the absorbance for all three sweeteners allowing a cross section between them. Figure 1 - The UV spectra of the three sweeteners all showing their absorbance values crossing at around 255nm Our samples that we have injected and mixed with our mobile phase enter the column only when the correct volume is acquired and all of the waste is removed from the Rheodyne valve. Next, the volume runs through to the glass capillary column which contains the non – polar stationary phase and this is where all the organic analytes are retained. Once the samples have passed out of the column they will have been separated as each of the molecules interacts differently with the stationary phase and then pass through a detector. This detector makes it possible for the chromatograph to be displayed on our computer monitor. Now, we are able to view the retention time and sweeteners present in our generic and branded diet soft drinks. • GLC – In our second experiment (gas liquid chromatography) we were analysing two different samples of perfumes both high street and designer. In this experiment there was also a “smell test” however this only provides a qualitative result. Before the sample could be ready for injection the syringe must be firstly rinsed with ethanol 3 times. This was done by filling the syringe with ethanol fully each time.
- 3. 3 Then, the sample of perfume was done similarly as the syringe was rinsed with the perfume by filling it 3 times with the sample perfume. Now the sample is taken into the syringe once more time for injection into the injection port. The port is at a high temperature of around 250 degrees Celsius so caution is needed whilst injecting the sample into the machine’s port. 0.2 microlitres of sample was injected into the GLC where it then travels into the column oven starting around 60 degrees Celsius and then enters the coiled column. This is where the sample is separated and once the sample passes through and reaches the flame ionisation detector, the chromatogram for the sample is produced. The mobile phase for this experiment is nitrogen, which is mixed with the sample and then carried over to the liquid stationary phase inside the glass capillary column. The temperature is now starting to increase gradually 10 degrees Celsius per minute as the sample moves along the column and finishes at 220 degrees Celsius with a hold time of 4 minutes. The chromatogram will still be completing within this time frame so the “smell test” was conducted. The smell test was conducted by firstly taking 4 labelled tissues marked with “fresh high street”, “aged high street”, “fresh designer” and “aged designer”. Then placing a drop of the perfume samples on the “aged” marked according to which perfume it is. Then they were left 30 minutes to “age”. After 30 minutes, a fresh drop of each perfume were dropped onto the “fresh” marked tissues again according to the high street or designer perfumes. The tissues were smell tested by people and they were asked to complete a table based in descriptions of the perfumes which then was later processed into viewable results. • ICP-AES – In our final experiment, the samples of soft sports drinks were diluted using a pipette, filler and a volumetric flask. The dilutions were labelled to avoid confusion and the different dilutions of samples were 100ml of a 1 in 10 solution. The pipettes were needed to be disposed successfully by rinsing with deionised water then placed tip down into the pipette boot to be washed. With our dilutions ready to use, we then were able produce results using the ICP-AES which we then compared to internal standards to calculate concentrations of different elements and a calibration graph was produced by the technical staff on the instrument’s software on a computer. The results were finally able to be collected and analysed.
- 4. 4 Results and discussion • HPLC Table 1 Sample: Retention time (min) Peak area (uV*sec) Saccharin (50 mg L-1) 5.130 566593.69 Acesulfame K (25 mg L-1) Peak 1 – 4.287 Peak 2 – 5.135 Peak 3 – 7.001 Peak 1 – 2860193.56 Peak 2 – 1164.02 Peak 3 – 4064.34 = 2865421.92 Aspartame standard 1 (100 mg L-1) 8.320 89254.66 Aspartame standard 2 (200 mg L-1) Peak 1 – 6.985 Peak 2 – 8.237 Peak 1 – 10273.11 Peak 2 – 180308.96 =190581.29 Aspartame standard 3 (300 mg L-1) 8.171 274346.94 Aspartame standard 4 (400 mg L-1) 8.120 371699.29 Aspartame standard 5 (500 mg L-1) 8.069 31413.73 Brand drink Peak 1 – 4.282 Peak 8 – 8.272 Peak 1 – 4031697.68 Peak 8 – 138535.04 Generic drink Peak 6 – 5.147 Peak 10 – 8.326 Peak 6 – 763088.43 Peak 10 – 83997.44 This table shows the retention time of the molecules in minutes and the peak areas of each peak present in all the samples also the standards in this experiment. In the branded drink there is a presence of aspartame and acesulfame K in standard 2. We can also see that there are very similar retention times for saccharin and aspartame in standard 1.
- 5. 5 Branded Diet Drink Generic Diet Drink The red circles in the images below show that the branded diet drink contains acesulfame K sweetener and the generic diet drink contains saccharin due to the peaks being extremely
- 6. 6 similar and similar retention times as mentioned before. However the retention times of both Acesulfame K and saccharin varies as there are multiple peaks present in acesulfame K but there is only one peak present for saccharin. Figure 2 – The peak area of aspartame against the concentration of aspartame Both sample peak areas (unknown concentrations), branded – 138535.04 uV*sec and generic – 83887.44 uV* sec, can be used in the graph above so that we can find out the concentration of aspartame in the drinks shown in the graph below: Figure 3 – Calibration curve determining the concentrations of aspartame in our unknown diet drinks A – branded, B - generic A B
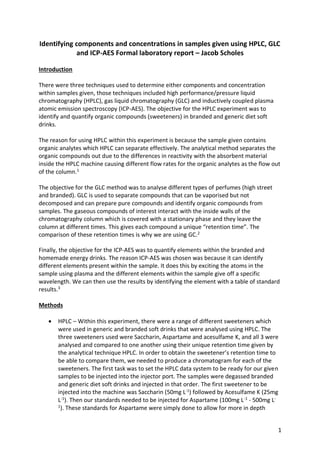
- 7. 7 We can see that the concentration for the branded diet drink is around 150 mg L-1 and that the concentration for generic diet drink is around 95 mg L-1 . So using this data we can calculate how much is the acceptable daily intake of aspartame: The US FDA acceptable daily intake (ADI) for aspartame is 50 mg per kg of body weight, so for someone with a body weight of 60kg will consume. 60 x 50 = 3000 mg of aspartame a day 3000/95 = 31.6L is the maximum a person can drink a day according to our calculated concentration for a generic drink Figure 4 - The specifications for the column used for HPLC In the HPLC experiment Figure 4 shows the specifications of the column used. This column contained our non-polar stationary phase that our polar mobile phase ran through, separating the organic molecules from each other. • GLC Table 2 – Data taken from the perfume samples by GLC Limonene concentration (mg L- 1) Peak Area of Limonene Peak area of Nonane Peak area of Limonene/Peak area of Nonane 0 0 81768 0.00 20 22431 94275 0.23793158 40 36279 72571 0.49991043 60 52630 70457 0.74698043 80 80420 77244 1.04111646 100 101167 78300 1.29204342 Designer perfume 87989 139522 0.63064606 High street Perfume 37474 126785 0.29557124
- 8. 8 Figure 5 – graph showing the concentration of limonene in the designer and high street perfume This graph displays the concentration of limonene in both perfume samples. Reading from the graph we can see that the concentration of limonene in the Designer perfume sample is around 55 mg L-1 and the concentration of limonene in the High street brand is around 25 mg L-1 . So, we can already see a difference of over double in the concentration of limonene in the perfume samples. This experiment being a 20-fold dilution means that when we calculate the undiluted concentration we must times the values we have by 20. Therefore, our initial concentration for our designer perfume is 55 x 20 = 1100 mg L-1 and the initial concentration of the High street brand is 25 x 20 = 500 mg L-1 SMELL TEST Designer High street Fragrance wheel (Michael Edwards, 1983)
- 9. 9 Figure 6 – fragrance wheel used in the smell test so students could describe what they smelt in each sample of perfume fresh and aged. In the second part of the GLC experiment the smell test was completed using fresh and aged samples of each perfume. Two groups shown below in table 3 smelt both fresh and aged perfume samples and their descriptions of what they smelt according to the fragrance wheel were recorded in table 3. Table 3 – recorded data of both groups from smell test Above in table 3 we can see that the Designer managed to maintain the stronger floral scent it had when fresh but also when aged for 30 minutes. On the other hand, the High street sample was not as strong as the designer to begin with and even managed to fade with its scent a lot quicker than the designer brand. However, this test producing qualitative data can be very subjective and therefore cannot be fully trusted/correct. To get a clearer, more trustworthy comparison of the 2 perfumes, we can use the GLC chromatograms produced in the first part of this experiment.
- 10. 10 Designer Brand perfume Chromatogram High street perfume chromatogram By comparing the 2 chromatograms we can observe that the number of peaks present in the designer perfume greatly outnumbers the total number of peaks in the High street perfume, a difference of 16 peaks, which can be seen in the middle region of the designer perfume chromatogram. The retention times near the beginning of both chromatograms are quite similar, however nearing the end, they seem to become greatly dissimilar with a difference of 3 minutes on the last peak observed.
- 11. 11 • ICP-AES Table 4 – short report on the metallic elements from ICP In this experiment our samples of sports drinks were diluted to a 1 in 10 dilution of 100 ml therefore a 10-fold dilution experiment. Using data from table 4 (shown above) we can use the calculated concentration (CC) and our dilution factor to calculate our undiluted concentration of each metallic element present in both drinks. By having a dilution factor of 10 we are able to times the CC values from the table by 10 to get the initial undiluted concentration: HOMEMADE DRINK: Calcium = 2.39 x 10 = 23.9 Potassium = 24.46 x 10 = 244.6 Magnesium = 1.24 x 10 = 12.4 Sodium = 94.89 x 10 = 928.9 BRANDED DRINK: Calcium = 3.53 x 10 = 35.3 Potassium = 23.57 x 10 = 235.7 Magnesium = 1.74 x 10 = 17.4 Sodium = 100.07 x 10 = 1000.7 Overall, the main difference we can see straight away is that there is less calcium, magnesium and sodium in the homemade drink compared to the branded drink but 3.78% more potassium is seen in the homemade than the branded. Summary To summarise it may be worth paying more for the branded product looking at the sports drinks and perfume data, whereas the diet soft drinks don’t have much of a difference between the sweeteners included, so you would be fine with either of them. When all data
- 12. 12 is evaluated (especially for the diet drinks) it is the consumers choice of preference to with either option of branded or non-branded. References: 1 Gerber, F.; Krummen, M.; Potgeter, H.; Roth, A.; Siffrin, C.; Spoendlin, C. (2004) Journal of Chromatography A. 1036 (2): 127–133. 2 Pavia, L., Gary M. Lampman, George S. Kritz, Randall G. Engel (2006). Introduction to Organic Laboratory Techniques (4th Ed.). Thomson Brooks/Cole. pp. 797–817 3 https://www.sciencedirect.com/topics/materials-science/inductively-coupled-plasma-atomic-emission- spectroscopy