Recommended

Recommended
More Related Content
Viewers also liked
Similar to The Diabetes Portal at the Rat Genome Database
Similar to The Diabetes Portal at the Rat Genome Database (20)
More from Jennifer Smith
More from Jennifer Smith (16)
Recently uploaded
Recently uploaded (20)
The Diabetes Portal at the Rat Genome Database
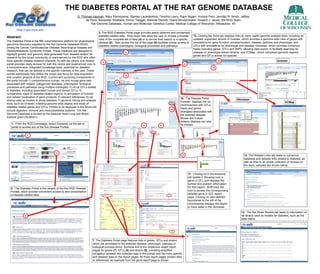
- 1. THE DIABETES PORTAL AT THE RAT GENOME DATABASE G. Thomas Hayman, Mary Shimoyama, Stanley Laulederkind, Timothy Lowry, Rajni Nigam, Victoria Petri, Jennifer R. Smith, Jeffrey de Pons, Alexander Stoddard, Simon Twigger, Melinda Dwinell, Diane Munzenmaier, Howard J. Jacob; the RGD Team Rat Genome Database, Human and Molecular Genetics Center, Medical College of Wisconsin, Milwaukee, WI 3. The RGD Diabetes Portal page provides easily obtained and condensed diabetes-related data. Drop-down lists allow the user to choose a broader 12. Clicking the Tools tab displays links to many useful genome analysis tools, including an Abstract: view of the complete set of data (4) or to narrow their search to a specific updated, expanded version of Gviewer, which provides a genome-wide view of genes with The Diabetes Portal is the fifth comprehensive platform for physiological disease (5). Tabs across the top of the page (6) facilitate similar access to annotations for gene function/ process/location, disease, pathway and phenotype, and genomics discovery supplied by the Rat Genome Database (RGD), diabetes-related phenotypes, biological processes and pathways. QTLs with annotations for phenotype and disease; Gbrowser, which provides numerous joining the Cancer, Cardiovascular Disease, Neurological Disease and tracks including genes, QTLs and SNPs, allowing data export, to facilitate searches for Obesity/Metabolic Syndrome Portals. These initiatives are designed to 3 disease- or phenotype-linked variants; and VCMap, which compares genomic regions, highlight genetic and genomic data generated from disease-related rat genes and QTLs across six species. research for the broad community of users served by the RGD who often have specific disease research interests. As with the others, this newest 14 Gviewer 4 portal provides ready access for both the novice and experienced user to 12 a comprehensive, integrated knowledge base, essential for diabetes 13 research, that can be tailored to the specific interests of the user. These portals additionally help define the scope and focus for data acquisition 6 and curation projects at the RGD. Current and upcoming components of the portal include 1) comprehensive human, rat and mouse gene sets associated with related, categorized diseases, phenotypes, biological 5 processes and pathways using multiple ontologies; 2) all rat QTLs related to diabetes, including associated mouse and human QTLs; 3) comparative maps of diabetes-related regions; 4) annotation of function and cellular localization of gene products; 5) relevant references; 6) rat 10. The Disease Portal strains used as models to study diabetes; 7) genome mining and analysis Gbrowser Gviewer displays the rat VCMap tools, such as Gviewer, enabling genome-wide display and study of chromosomes with QTLs diabetes-related genes and QTLs. Portals to be deployed in the future will (bars) and genes include digestive, immune and musculoskeletal systems. The Rat 10 (triangles) associated with Genome Database is funded by the National Heart Lung and Blood the selected disease. Institute grant (HL64541). Mouse and human synteny displays can also 1. From the RGD homepage, select Diseases via the tab or 7 be chosen. 8 9 panel to access any of the five Disease Portals. 1 60187797 71987956 1 11 13. The Related Links tab leads to numerous database and website links related to diabetes, as well as links to an ample collection of reviews on the topic; samples are shown below. 11. Clicking on a chromosome will isolate it. Mousing over a gene or QTL icon displays the symbol and position information 2. The Diabetes Portal is the newest of the five RGD Disease for that object. Shift+click the Portals, which provide convenient access to and consolidation icon to access the corresponding of disease-related data. detailed gene or QTL report page. Clicking on user-defined boundaries to the left of the chromosome displays the region in more detail in the Gbrowser. 14. The Rat Strain Models tab leads to information on 2 rat strains used as models for diabetes, such as the table below. 7. The Diabetes Portal page features lists of genes, QTLs and strains which are annotated to the selected disease, phenotype, pathway or biological process terms. Symbols link to the respective object report pages for genes (7), QTLs (8) and strains (9), providing simplified navigation between the collected data in the portals and the more specific and detailed data on the report pages. All three report pages contain links to references; an example from the gene report page is shown.