allele distributionIn population genetics, allele frequencies are.pdf
SALK seaside symposium
1. *downloaded from public database(GSE62742)
When mapping molecular quantitative trait loci, genetic
associations with traits such as gene expression are
typically identified using linear additive genetic models.
These models assume that the phenotype of
heterozygotes is halfway between the low-homozygous
and high-homozygous genotypes and may miss
non-additive relationships, such as those caused by
dominant alleles. Studies in Drosophila melanogaster
and other model organisms have found evidence for
non-additive genetic associations with enhancer activity and gene expression,
and we hypothesized that these type of associations may also exist in the
human genome (1). To map non-additive associations in the human genome,
we applied a multiple linear regression model on single nucleotide
polymorphisms (SNPs) from 1000 Genomes and ChIP-seq data from 62 Yoruba
lymphoblaststoid cell lines (2).
PhenotypicValues
0 1 2
Number of reference alleles
Fig.1 Figure shows additive
relationship between phenotypic
and genotypic values
rs1079355 on chr 1
(p = 1×10⁻⁵)
where GA equals the number of reference alleles in each genotype and GD
was assigned to be 1 for heterozygotes and 0 for homozygotes.
Levels refer to the quantile normalized H3K27ac levels, which were then
forced to be standard normal.
Identifying non-additive genetic associations with histone modifications
and gene expression in human cell lines
Jing Gu, Patrick Fiaux, Graham McVicker *
Department of Chemistry and Biochemistry, University of California, San Diego, CA 92093
Salk Institute for Biological Studies, 10010 N Torrey Pines Rd, La Jolla, CA 92037
Abstract
Statistical Model: Multi Linear Regression
Levels = 𝛽0 + 𝛽1 × GA +𝛽2 × GD + 𝜀
Pipeline Development
Acknowledgements & References
Results for Association Tests
I would like to thank Patrick for his support in developing pipelines. I also
need to thank Dr. Graham McVicker for helping experiments design and data
analysis. Lastly, I appreciated all the help from other people in McVicker’s lab.
1) T.E.Lum et al., Genetics, vol.189, 837-849(2011)
2) F. Grubert et al., Cell 162, 1051–1065 (2015)
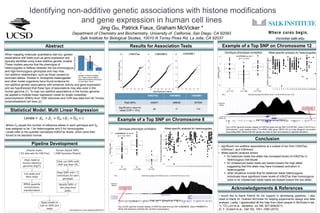
Example of a Top SNP on Chromosome 12
• significant non-additive associations at a subset of loci from H3K27ac,
H3K4me1, and H3K4me3
• Allele-specific analysis shows
for balanced reads low-allele has increased levels of H3K27ac in
heterozygous individuals
for imbalanced reads reads are biased toward the high-allele
suggesting that this allele may have increased activation in
heterozygotes.
other situations include that for balanced reads heterozygous
individuals have significant lower levels of H3K27ac than homozygous
ones or for imbalanced reads reads are biased toward the low-allele.
Conclusion
mcvicker.salk.edu
Example of a Top SNP on Chromosome 8
H3K27AC H3K4ME3 H3K4ME1
Total SNPs 449001 369526 637050
Significant p value for
beta2 (FDR = 10%)
60 17 174
Genotype-phenotype correlation
H3k27acLevel
(n = 17) (n = 30) (n = 14)
Fractionofreadsfromreferenceallele
Allele-specific analysis for heterozygotes
H3K27AC
Marker
rs10797355
Fig.3 UCSC genome browser display of H3K27ac peak and top SNP rs10797355. Gene C1orf174 is a
chromosome 1 open reading frame 174 mRNA, while gene LINC01134 is a long intergenic non-protein
long coding RNA. Notice that both genes are close to each and express in opposite directions.
Genotype-phenotype correlation
H3k27acLevel
(n = 25) (n = 30) (n = 6)
rs36089630 on chr 8
(p = 1.5 ×10⁻⁶)
Fractionofreadsfromreferenceallele
Allele-specific analysis for heterozygotes
rs12824739
H3K27AC
Marker
Fig.2 UCSC genome browser display of H3K27ac peak and top SNP rs36089630. Gene FAM86B3P is
family with sequence similarity 86, member A pseudogene.
H3K27acH3K27ac H3K4ME1H3K4ME3
-log10(actualp-value)
-log10(actual p-value)