1.8.4 Positive and negative externalities in consumption and production.pptx
1. 1.8.4 Positive and negative externalities in
consumption and production
AQA 1.8: The market mechanism, market
failure and government intervention in markets
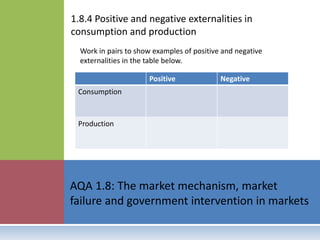
Positive Negative
Consumption
Production
Work in pairs to show examples of positive and negative
externalities in the table below.
2. 1.8.4 POSITIVE AND NEGATIVE EXTERNALITIES
IN CONSUMPTION AND PRODUCTION
Externalities exist when there is a divergence between
private and social costs and benefits
Why negative externalities are likely to result in over-
production and that positive externalities are likely to
result in underproduction
Why the absence of property rights leads to externalities
in both production and consumption and hence market
failure
Students should be able to illustrate the misallocation of
resources resulting from externalities in both production
and consumption, using diagrams showing marginal
private and social cost and benefit curves
Recap from
Y1 Economics
3. EXTERNALITIES
Externalities are the costs and benefits to a third
party created by economic agents when undertaking
their activities
These costs and benefits can be negative or positive
Negative externalities are those costs to a third party
that are not included in the price of the economic
activity
Positive externalities are those benefits to a third
party that are not included in the price of the
economic activity
Y1 recap.
4. THE ABSENCE OF PROPERTY RIGHTS LEADS TO
EXTERNALITIES IN BOTH PRODUCTION AND
CONSUMPTION AND HENCE MARKET FAILURE
Common property includes resources that are owned
by society rather than individuals e.g. the sea, air and
common land
This has led to exploitation and overuse of these
resources as anyone can use them. This has been
detrimental to society
A lack of property rights therefore leads to the abuse
of resources as it is difficult to stop an individual
exploiting them to the detriment of others
This causes negative externalities such as pollution
and resource depletion
Property rights
provide for a legally
recognised ownership
of resources.
5. THE ABSENCE OF PROPERTY RIGHTS LEADS TO
EXTERNALITIES IN BOTH PRODUCTION AND
CONSUMPTION AND HENCE MARKET FAILURE
Creating property rights internalises the externality
meaning that the owner of the resources has to take
responsibility
This means the resource is now part of the market
mechanism
If the owner of the resource creates a negative externality
to a third party they can be taken to court to pay for the
damage
If the owner of the resource creates a positive externality
they can use the price mechanism to charge a third party
for use of the resource and benefit from this
6. MARGINAL ANALYSIS
We can use marginal analysis to enhance our
understanding of externalities
Marginal analysis looks at the benefit or cost we receive
from consuming or producing one more unit
Marginal benefit is the benefit to a consumer of
consuming one more unit of a good or service
Marginal cost is the cost to a producer of producing one
more unit of a good or service
7. DEMAND IS THE SAME AS
MARGINAL PRIVATE BENEFIT
Marginal private benefit (MPB) is the additional amount of
satisfaction that a consumer gains from an additional unit of a good
or service
MPB can be represented by the demand curve. The vertical distance
at each quantity e.g. 50 units shows the amount consumers are
willing to pay for that unit e.g. £10
This reflects the benefit derived from each unit
This can be recognised in the lower price that consumers are willing
to pay for an additional unit as satisfaction decreases as we consume
more
Therefore:
D = MPB
Price
Quantity
D = MPB
£10
50
MPB and MPC are
terms that we will use
to enhance our
understanding of
externalities.
Is there something you
miss when you go on
holiday or don’t have it
for a while? How much
MPB do you get from
the 1st unit consumed
and the 3rd?
8. PRICE = MARGINAL COST
Allocative efficiency occurs where P = MC
If the price of producing a product is above the marginal cost of
producing it then firms should increase output
As the price is above the cost of production the firm will increase
output and make additional profit
Firms will allocate more resources into producing the product
until price is equal to marginal cost (P = MC)
At this point the firm is maximising profits
If MC was greater than P the firm would be making a loss on
producing each additional unit
9. SUPPLY IS THE SAME AS
MARGINAL PRIVATE COST
Marginal private cost (MPC) is the cost to a producer of producing an
additional unit
MPC can be represented by the supply curve. If the price of an
additional unit pays for the cost of producing the extra unit then a
firm will supply it
The supply curve reflects this as higher prices will lead to more being
supplied as firms cover their costs for producing the additional unit
As price increases we will see an increase in supply as it is more likely
that producers will cover their costs
As cost increases a
producer can only
make a profit from an
additional unit if price
is higher or equal to
the cost of producing
that additional unit.
The point at which a
firm stops supplying is
when the additional
cost is higher than the
price received for
producing that
additional unit.
The marginal private
cost curve therefore
shows the relationship
between costs, price
and the quantity
supplied of that
product.
Price
Quantity
S = MPC
P
Q
10. MARGINAL SOCIAL BENEFITS AND
MARGINAL SOCIAL COSTS
We can use marginal social benefits (MSB) and
marginal social costs (MSC) to enhance our
understanding of externalities
MSB includes MPB but also the additional benefits to
society of consuming or producing one extra unit
We call these marginal external benefits (MEB)
MSC includes MPC but also the additional costs to
society of consuming or producing one extra unit
We call these marginal external costs (MEC)
Marginal social
benefits (MSB) are
those benefits of
consuming or
producing an additional
unit of goods or
services that are
received by society.
This will include
marginal private
benefits.
MSB = MPB + MEB.
Marginal social costs
(MSC) are those costs
of consuming or
producing an additional
unit of goods or
services that are paid
for by society. This will
include marginal
private costs.
MSC = MPC + MEC.
11. MARKETS OPERATE WHERE MPB = MPC
In a market economy the economic unit only considers the
private costs or benefits of its activities
Consumers and producers will operate in a market where:
MPB = MPC
This will lead to the maximisation of private benefit
If MPB < MPC then consumers can achieve additional
benefit from consuming more goods and services
If MPB > MPC then producers can achieve additional profits
by increasing supply
When MPB = MPC the market is in equilibrium
The market optimum
position occurs where
MPB = MPC.
12. WHY EXTERNALITIES LEAD
TO MARKET FAILURE
In a market economy the economic unit only
considers the private costs or benefits of its activities
However, this does not take into account social
benefits and costs
Externalities can be broken down into the following
four categories:
Negative production externalities
Negative consumption externalities
Positive production externalities
Positive consumption externalities
Both negative and
positive externalities
lead to market failure
because the private
consumer or producer
is not paying for, or
receiving, the full cost
or benefit of the
economic activity.
13. NEGATIVE PRODUCTION EXTERNALITIES
Negative production
externalities occur
when the activities of
producers lead to
costs to a third party
that are not included
in the price of the
economic activity.
In the diagram, the supply curve S takes
into account the cost to the firm of
producing the product i.e. the private
cost.
If we include the cost to society the
supply curve would shift up and to the
left (S1) as the costs to society of a
negative externality will be greater than
the costs to the producer.
If social costs were included i.e. the full
costs then we would operate where S1 =
D at P1Q1.
The cost to society (or welfare loss) can
be seen by the blue shaded area. This
measures the difference between the
social cost and private cost at output
levels between Q and Q1.
Price
Quantity
D
Q1
S1 = MSC
Q
S = MPC
P1
P
The firm’s optimal level of output is Q. Society’s
optimal level of output is Q1. Therefore, the
firm is overproducing by Q – Q1.
Price is too low and output too high. There is
allocative inefficiency.
14. POSITIVE PRODUCTION EXTERNALITIES
Positive production
externalities occur
when the activities of
producers lead to
benefits for a third
party that are not
included in the price
of the economic
activity.
Welfare gain can be
defined as a situation
where the social cost
is lower than the
private cost and
society gains as it does
not have to pay for the
difference.
S1 is down and to the right of S as the
costs to society of a positive externality
will be less than the costs to the
producer.
If social costs were included i.e. the full
costs then we would operate where S1 =
D at P1Q1.
The benefit to society (or welfare gain)
can be seen by the blue shaded area.
This measures the difference between
the social cost and private cost at
output levels between Q and Q1.
Price
Quantity
D
Q Q1
P
P1
S1 = MSC
S = MPC
The firm’s optimal level of output is Q. Society’s
optimal level of output is Q1. Therefore, the
firm is underproducing by Q – Q1.
Price is too high and output too low. There is
allocative inefficiency.
15. NEGATIVE CONSUMPTION EXTERNALITIES
Negative
consumption
externalities occur
when the activities of
consumers lead to a
loss of benefit to a
third party that are
not included in the
price of the economic
activity.
The consumer gains the benefit of
consuming a good or service on the
demand curve D.
Social benefit is below and to the left of
private benefit as the benefits to society
of a negative externality will be lower
than the benefits to the individual
consumer.
A consumer will maximise its private
benefit by consuming where S = D at PQ.
However, if social benefits were included
we would operate where S = D1 at P1Q1.
The consumer’s optimal level of output is Q.
Society’s optimal level of output is Q1.
Therefore, the consumer is overconsuming by
Q – Q1.
The loss of benefit to society (or welfare loss)
can be seen by the blue shaded area. This
measures the difference between social
benefit and private benefit at output levels
between Q and Q1.
16. POSITIVE CONSUMPTION EXTERNALITIES
Positive consumption
externalities occur
when the activities of
consumers lead to
benefits to a third
party that are not
included in the price
of the economic
activity.
The consumer gains the benefit of
consuming a good or service on the
demand curve D.
Social benefit is above and to the right
of private benefit (D1) as the benefits to
society of a positive externality will be
greater than the benefits to the
individual consumer.
A consumer will maximise its private
benefit by consuming where S = D at
PQ.
However, if social benefits were
included we would operate where S =
D1 at P1Q1.
Price
Quantity
D = MPB
Q1
S
Q
D1 = MSB
P1
P
The consumer’s optimal level of output is Q.
Society’s optimal level of output is Q1.
Therefore, society is benefiting over and above
the individual consumer by Q – Q1. The
consumer is underconsuming.
The benefit to society (or welfare gain) can be
seen by the blue shaded area. This measures the
difference between social benefit and private
benefit at output levels between Q and Q1.
17. MARGINAL PRIVATE AND SOCIAL COST AND
BENEFIT CURVES
Price
Output
MPB
QE
MSC
MSB
Q1
MPC
The diagram shows
the marginal private
and social benefit
curves and the
marginal private and
social cost curves.
Market equilibrium
occurs at an output of
QE.
The allocation of
resources can be
improved by
increasing price and
reducing output so
that MSB = MSC at Q1.
The optimal allocation
of resources to society
is where MSB = MSC.
18. WHY EXTERNALITIES LEAD
TO MARKET FAILURE
In order to eliminate externalities as a market failure the
market needs to operate where MSB = MSC
As can be seen with our look at four types of externalities
this is unlikely to happen
Economic units will look to operate where MPB = MPC
Society will benefit where MSB = MSC
Neither producers or consumers will take into account the
needs of society
This is where government steps in
The divergence
between private costs
and benefits and social
costs and benefits
leads to government
intervention.
The social
optimum position
occurs where MSB
= MSC.
19. QUICK TEST
Negative externalities exist when
a) Social costs and private costs are the same
b) Social costs and private costs are different
c) Social benefits and private benefits are the same
d) Social benefits and private benefits are different
Can you explain your answer?
21. THE IMPACT OF EXTERNALITIES - TRANSPORT
Transport policy is at the forefront of public policy
decision making
In the UK road, rail and air travel have become
expensive and congested
All of them are seen to cause negative externalities
The humble bike leads to positive externalities
Increasing the
supply of cycling
routes.
Is government
planning for the
future?
HS2 – for and
against.
Who should pay for
roads?
22. THE IMPACT OF EXTERNALITIES - HEALTH
CARE
The UK expects to spend £130 billion on healthcare in
2014
The National Health
Service (NHS) is the
biggest employer in
Europe with
approximately 1.5
million employees.
The NHS was 60 years
old in 2008.
In the UK private
health care is also
provided through
specialists such as
BUPA.
Does private health
care work?
Healthcare spending:
where does the UK stand?
Should the government
intervene in markets?
23. THE IMPACT OF EXTERNALITIES -
ENVIRONMENT
There is debate regarding the best way to control
pollution
Some commentators believe that there should be a
tax on carbon emissions
Others believe that a permit to pollute system is more
effective
Tax v permits – the
pollution debate.
Is there government
failure in the
pollution market?
Does trading
scheme actually
work?
EU’s flagship
scheme in
jeopardy.
Government regulation
of the environment
involves the use of
pollution permits.
What is emissions
trading?
Follow the links. How
can you use economic
theory to explain the
tradable permit
market?
China follows
EU lead.