1. An Analysis of Two Different Options for Dairy Policy Change in
Canada in the Trans-Pacific Partnership Free Trade Negotiations
Research by Isaac Jonas
Supervised by Dr Richard Barichello
ABSTRACT
Phasing out the Canadian Dairy
Supply Management system could
open up the sector to better
investment opportunities and increase
efficiency in the medium to long term.
However, the process needs to be
handled carefully, in a way that does
not send bad signals about
government policy consistency. The
dairy sector could generate
approximately a billion dollar dairy
‘cake’ in the first year of
consummation of the Trans-Pacific
Partnership Agreement.
2. 1
Acknowledgements
First and foremost, my sincere gratitude goes to my supervisor, Professor Richard Barichello. His
generous, kind assistance and, encouragement has been unwavering throughout the duration of
this project. I would like to also thank Professor Michael Johnson, whose mathematical insights to
the research were very helpful.
I am also indebted to Nathan Canen, a Ph.D. student and friend at the University of British
Columbia (UBC) who provided valuable comments on my mathematical model.
I acknowledge, with most grateful thanks, the financial support from the University of British
Columbia MasterCard Foundation Scholarship who made it financially feasible for me to
undertake this research through their consistent and generous support throughout the duration of
my master’s program at UBC.
Lastly, many thanks goes to my mum who gave me unwavering support at least my entire life as
a child and as a student.
3. 2
Table of Contents
List of Acronyms..................................................................................................................................... 3
Research overview and Introduction........................................................................................................ 4
Literature review..................................................................................................................................... 7
Methodology........................................................................................................................................... 8
Assumptions............................................................................................................................................ 9
Data Sources ........................................................................................................................................... 9
The Model…………………………………………………………………………………………………..9
Explanation of
Results……………………………………………………………………………………………………17
Experience from Australia and New Zealand……………………………………………………………19
Criticism of the Model……………………………………………………………………………………20
Conclusion……………………………………………………………………………………………….21
References………………………………………………………………………………………………22
4. 3
List of Acronyms
Association of Southeast Asian Nations-ASEAN
Gross Domestic Product-GDP
Dairy Structural Adjustment Program-DSAP
International dairy Federation –IDF
Regional Comprehensive Economic Partnership-RCEP
Trans-Pacific Partnership Agreement-TPPA
5. 4
Research Overview
Introduction
The last half of the twenty first century has been marked by significant increase in regional trade
volumes between countries across the globe. The Trans-Pacific Partnership negotiations is one
stride that is set to increase the volume of trade between North America, Asia and, Australasia1
.
Globally, there are more than 150 million households that are involved in milk production2. On
the other hand, there are more than 6 billion consumers of milk across the world3
. India is the
largest world producer for milk, followed by the United States of America, China, Pakistan and,
Brazil4
. India accounts for at least 16% of the world’s milk production5
. Canada produces milk
across all its ten provinces and much of the milk is consumed domestically. New Zealand, United
States of America, Germany, France, Australia and Ireland have the greatest milk surpluses6. On
the other hand, China, Italy, the Russian Federation, Mexico, Algeria and, Indonesia have the
greatest milk deficits7. These anomalies create the need for countries to trade with each other and
hence matching the milk deficits with the surplus.
Canadian dairy system’s supply is managed by the government through the provincial boards. This
has created a wedge between dairy farmers and the consumers for the dairy products. On the
extreme end, there are dairy farmers who want the status quo to prevail and on the other deep end
the dairy products’ consumers are paying a higher price than their counterparts in the United States
of America. This has drawn much attention both in local and international media as recently, the
government of Canada is taking part in the Trans-Pacific Partnership negotiations.
Nonetheless, there has not been many studies to quantify the welfare implications should Canada
open up on its supply managed regime. Barichello (1981) calculates the efficiency effects and
income transfers effects for the industrial milk as $208 million and minus $989 million
respectively. There are different categories for milk that include fluid and industrial types. This
1
For the purpose of this research, Australasia means Australia and New Zealand
2
http://www.fao.org/agriculture/dairy-gateway/milk-production/en/#.VaaiQ_lVhBc
3
http://www.fao.org/agriculture/dairy-gateway/milk-and-milk-products/en/#.VaaiSvlVhBc
4
http://www.fao.org/agriculture/dairy-gateway/milk-and-milk-products/en/#.VaaiSvlVhBc
5
http://www.fao.org/agriculture/dairy-gateway/milk-and-milk-products/en/#.VaaiSvlVhBc
6
http://www.fao.org/agriculture/dairy-gateway/milk-and-milk-products/en/#.VaaiSvlVhBc
7
http://www.fao.org/agriculture/dairy-gateway/milk-and-milk-products/en/#.VaaiSvlVhBc
6. 5
paper focuses on milk products at farm level due to the availability of data and the research gap
under this category.
The Trans-Pacific Partnership Agreement (TPPA) is a comprehensive package of economic and
political objectives that opens up regional trade in a non-discriminatory basis (Capling and
Ravenhill, 2011). The TPPA consists of twelve countries which are Canada, Brunei, Mexico,
Malaysia, Singapore, Vietnam, Japan, Australia, New Zealand, Chile, Peru and, The United
States8
.
There has been speculation about the true extent of the benefits that could result from the
implementation of the Trans-Pacific Partnership Agreement. To illustrate this, Petri (2012)
projects the Trans-Pacific Partnership agreement to raise income by $295 billion per annum upon
its full implementation. The United States alone would benefit $789
billion per year through trade
and business opportunities with member countries. Not only that, the overall monetary benefits
are estimated to be about $2 trillion per year from the trading bloc (Petri, 2012). However,
Canada’s monetary gains or losses from the Trans-Pacific Partnership Agreement are yet to be
established.
It is against this background that this research focuses on establishing approximate dairy sector
economic values from the Trans-Pacific Partnership Agreement for Canada. It further articulates
the possible welfare implications that could result from Canada implementing the Trans-Pacific
Partnership Agreement in the currently supply managed dairy sector. Canada could equally benefit
from opening up its supply managed dairy sector. This could be in form of increased business
opportunities within Canada itself as local and international investors invest in the currently supply
managed dairy sector. There could also be intra-trade benefits between Canada and the other 11
members of the Trans-Pacific Partnership Agreement. In the same way, the process could also
result in the transfer of benefits and or losses across different stakeholders ranging from dairy
farmers, consumers and, government.
The two hypotheses of this study therefore, are that Canada could implement the Trans-Pacific
Partnership Agreement and if not, then it would maintain the current supply management. Both
options could have different outcomes in terms of the welfare implications as explained in this
paper. Every outcome results in different stakeholders gaining and others losing. This works like
8
Capling, Ann, and John Ravenhill. “Multilateralising Regionalism: What Role for the Trans-Pacific Partnership Agreement?”
The Pacific Review 24, no. 5 (December 1, 2011): 553–75. doi:10.1080/09512748.2011.634078
9
Petri, 2012
7. 6
a ‘political market10
where gains and or losses are transferred across the divide with each move
taken.
It is important that we contextualize the research to understand the genesis of the dairy supply
management in Canada. The history of supply management in Canada dates back to the 1960s
when farmers were facing increasingly volatile markets trend and losing control over their
production process to processors (Canadian Parliamentary Report Review/Autumn, 2008). In
Canada, dairy industry supply management system was put in place in the early 1970s to address
these uncertainties in milk supplies and the revenue fluctuations to producers and processors
which were a common phenomenon in the 1950s and 1960s11
.
Supply management, as it is conceptualized by Oscam and Speijers (1992)12, applies to Canada's
dairy sector. The Canadian Dairy Board issues milk quotas as producer’s right to sell an amount
of milk13. The Dairy Commission of Canada predetermines the milk production for a certain
period so that it balances with the predicted demand forecasts of the milk (Canadian Dairy
Commission report, 2010). The Dairy Commission, which is the bona fide milk regulator,
balances milk production from all farms across the Canadian provinces with the domestic
consumption of the dairy products by issuing marketing quotas within the framework provided by
the National Milk Marketing Plan. The National Milk Marketing Plan establishes the national
milk production target for industrial milk in Canada, or Market Sharing Quota (Canadian Dairy
Commission, 2010). When setting up this milk production target, the Canadian Dairy Commission
incorporates the milk imports and exports to cater for all demand and supply dimensions.
The probable question that is speculating is how the Canadian government is going to compensate
the dairy farmers who bought their quotas using loans from banks going to pay off their debts if
the government phases out the dairy supply management system? As of June 2015, there were
11962 farmers with milk shipments across Canada with about 959 dairy cows and 444 200 dairy
heifers14. Related to this, the whole milk per capita consumption has been on an upward trend for
10
The different stakeholders like dairy farmers, processors, government and dairy products consumers all interact on the dairy
market. Each stakeholder bargains to have a better deal but the most important part is to convince the policymakers who may be
the politicians to make the best rational decisions.
11
Canadian Parliamentary Report Review/Autumn, 2008
12
Oscam and Speijers (1992) observe that supply management system is an agricultural policy that involves controlling the
production side of dairy products without necessarily decreasing the prices to very low prices.
13
Moreso, the Canadian Dairy Commission Act r.s.c., 1985,c.C-15 demands that all milk produced in Canada be sold to the
Canadian Dairy Commission
14
Statistics Canada
8. 7
the period 1995 to 2014, with the average percentage change for the same milk category being
6.9%15
.
It is also important to note that the mobility of quotas between farmers across the different
Canadian provinces is a critical factor that enables the dairy market to balance off the supply and
demand for quotas (Oscam and Speijers, 1992). The quotas like any other marketable good have a
price that incorporates the equilibrium price plus some risk premium of holding the quotas16
. Risk
is an important consideration in asset purchase. In case of dairy supply management quotas in
Canada, portfolio risk and default risk are important (Barichello, 1996). However, there are other
risk sources: the risk could also be from any other market fundamentals or government policy
change.
Literature Review
In order to enhance a better understanding of the extent to which Canada could benefit from the
Trans-Pacific Partnership Agreement, this section focuses on critical literature on the Dairy Supply
Management system. Barichello (1981) estimates the economic effects of selected agricultural
policies in Canada at farm gate level for major milk categories. He further sums up the gains and
losses for the dairy supply management in four categories as Economic Gain /Efficiency loss (-
$214 million), Producer Gain ($955 million), Consumer Gain (-$980 million) and taxpayers Gain
(-$303 million).
In 1983, Schmitz improved the findings in the dairy supply management body of knowledge by
bringing in the resource misallocation dimension of marketing boards as that of transferring
income from the general consuming public to a few specific consumers who can afford to buy milk
quotas.
In addition, Troughton (1989) highlights that marketing boards have emerged as a significant
institutional framework with Canadian agricultural system since the industrial period about 95
years ago. He alludes this trend as a step up in response to the economic depression, the need to
stimulate agribusinesses, the integral response to the pressures of the market, to technological
pressures of the market and, the structural changes in the industrialization of agriculture17
.
15
http://dairyinfo.gc.ca/pdf/camilkcream_e.pdf
16
Oscam and Speijers, 1992
17
Troughton, Michael J. “The Role of Marketing Boards in the Industrialization of the Canadian Agricultural System.” Journal
of Rural Studies, Special Issue Institutions and Rural Systems, 5, no. 4 (1989): 367–83. Doi: 10.1016/0743-0167(89)90063-6.
9. 8
One of the most recent studies specific to Canada with regards to the Dairy supply management
system, has been the working paper by Ciuriak and Xiao published in September 2014. The two
authors assess the impact of the Trans-Pacific Partnership Agreement based on a ‘best guess’18
on
what could be the possible outcomes for the negotiations since the information from the
negotiations is usually not made public.
Although there has been studies in the dairy supply management in a broader sense, there has not
been specific research that quantifies the economic value that Canada would benefit if it
implements the Trans-Pacific Partnership Agreement. This research closes down the research gap
Methodology
To quantify the gains and or losses from implementing the Trans-Pacific Partnership Agreement,
it is important to identify two variables which are the price and the quantity of raw milk. The price
and quantity data are then used to mathematically simulate the welfare gains and or loses as will
be shown on the diagrams below. In this case, the United States dairy system is used as a
benchmark for measuring the deadweight loss. Canada and the United States share close
similarities. The sources of differences in the two dairy systems emanate from differences in
technologies across the two countries. Once the milk trade flow is captured, then it would be a
clever conjecture to start quantifying the welfare gains and or loses from that vantage point. The
demand side of the dairy sector consists of the consumers and processors who buy the milk
products and, the supply side consists of the dairy farmers. The model is at equilibrium when the
demand and supply of milk are equal.
18
http://papers.ssrn.com/abstract=2550935.
10. 9
Assumptions
● The price of milk in Canada does not affect the world price of milk.
● The United States milk price is a fair estimate for the world milk price.
● The demand for the raw milk is fixed over the short run as the supply changes with the
consummation of the TPPA.
● The demand and supply curves for raw milk are linear.
● The supply elasticity of milk 0.5.19
● Demand elasticity of whole milk is approximately -1.3120
.
● There are no imports of milk and its associated products.
DATA SOURCES
There are two main data sources for the research. These are the International Monetary Fund and
Statistics Canada. The national data is a sum of the provincial boards and agencies milk figures.
These data are available on the International dairy Federation (IDF) Statistics Canada. The US and
Canadian milk price is found on the IDF database. Due to the limited time frame, the research will
be limited to desktop data gathering.
The Model
To give context to the model, the dairy sector in Canada supply managed throughout the ten
provinces of British Columbia, Alberta, Manitoba, New Brunswick, Newfoundland and Labrador,
Nova Scotia, Ontario, Prince Edward Island, Quebec and, Saskatchewan. The specific distribution
of milk production across Canada is shown below.
19
Bozic, Marin, Christopher A. Kanter, and Brian W. Gould. “Tracing the Evolution of the Aggregate U.S. Milk Supply
Elasticity Using a Herd Dynamics Model.” Agricultural Economics 43, no. 5 (September 1, 2012): 515–30. doi:10.1111/j.1574-
0862.2012.00600.x.
20
http://ageconsearch.umn.edu/bitstream/51791/2/IAAE%202009-Ref%20356-Davis.pdf. This result is confirmed to be same as
those obtained by Boehm and Babb(1975) and Schmidt et al.,(2002)
11. 10
Source: Canadian Dairy Information Centre
Quebec province has the highest number of dairy cows at 354800 and Newfoundland and Labrador
have the lowest number of dairy cows at 600021.
In setting up the mathematical model, the underlying anecdote is that the price, which the Diary
Commission sets should be greater than the marginal cost. The marginal cost in economic sense,
gives a closer approximation of the supply curve of raw milk. Farmers would want to produce milk
as long as they at least cover the marginal costs otherwise it would be a loss for them to continue
to supply milk.
21
http://www.dairyinfo.gc.ca/index_e.php?s1=dff-fcil&s2=farm-ferme&s3=nb.
12. 11
Graphically, to have a conjecture of the deadweight loss, the optimal price is assumed to be close
to that of the United States average raw milk price. The price is the Canadian price of raw milk
per liter and is the United States raw milk price average. The average prices are for the period
2008 to 2014. The conjecture for and are calculated from the average milk price for Canada
and the United States respectively. The two economies are assumed to be closely linked in terms
of trade due to their trade links and geographical proximity. This data are obtained from the
Statistics Canada, International Dairy Federation (IDF) database. The values for the prices
on fig 2 are the estimates from this author. The milk production data are obtained from the
provincial boards and agencies database.
The demand curve for the raw milk is downward sloping and the supply curve is fixed as the Dairy
Commision fixes the quotas that are distributed.
13. 12
The value for milk at is known to result in the price, which the Canadian consumers face.
This is arrived at using the formula which the Dairy Board uses to impute all costs incurred dairy
farmers across Canada.
Mathematically, given the assumptions highlighted above,
The Q1 is the quantity that is set up by the Canadian dairy commission and all other variables are known. This makes the solutions for the
deadweight loss feasible to calculate as they are areas of the shapes. The overall deadweight loss is the sum of the areas under the curves as
shown on the diagram labeled fig 2 below
14. 13
Given the aforementioned assumptions, the total value of what the dairy suppliers and consumers
could share is $944 401 24.38. This is calculated by summing up all the areas between the
demand curve and supply curves for the milk. The table below shows the respective welfare
implications.
15. 14
Area A B C D E
Prices of raw milk 2.20 1.91 0.97 0.92 0.75
Quantities of Raw Milk(Qi) 76,711,985 78246224.41 79811148.9 81407371.87 83035519.31
Welfare loss/Gain 11123237.78 75944864.87 6520518.701 721092.6563 130410.374
Total Value of the milk
revenue cake 94440124.38
Triangle A shown by the blue triangle has a value of $11123237.78. This value shows that the
consumer surplus would increase as Canada opens up the dairy sector. Canadian dairy consumers
would pay less than what they are currently paying under the supply management system.
In year two (denoted by S2), the deadweight loss falls as shown by the triangles in black. Raw
milk supply increases presumably from more efficient farmers and also increased investment in
dairy farming as the dairy sector opens up. More raw milk is produced and production
hypothetically increases by ten percent in each year from the initial amount of 767 119 85. This is
a simplified assumption.
It is important to highlight that the Canadian government should cleverly find a phasing out
formula that does not send bad signals to farmers. Whatever the phasing out case the Canadian
government may take should it implement the TPPA, there has to be a cleverly timed out
mechanism to avoid panic and shortages for the dairy products.
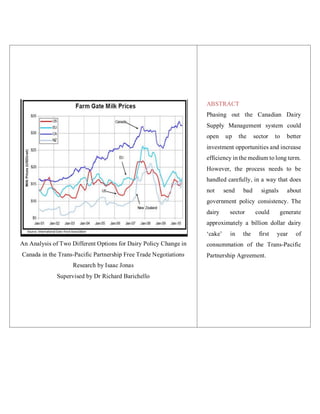
To further illustrate the current scenarios, the diagram below shows that the Canadian milk
consumers pay more compared to the United States counterparts. This trend could be averted as
Canada opens up to international trade in its closed dairy sector through the TPPA. As shown on
fig 2 above, as the milk production falls, the milk prices consequently falls. This is good news in
the eyes of dairy products consumers and sad news for the dairy farmers who would be receiving
lesser return from their milk products. The graph below supports this fact.
Fig 3.
16. 15
Source: author's calculations based on the Statistics Canada database
The dollar value difference at farm gate level between the United States and Canada are also
shown below.
17. 16
Year Canadian Milk Production
2006 45,307,315
2007 78,197,966
2008 79,801,292
2009 77,771,092
2010 76,731,527
2011 76,627,816
2012 75,926,096
2013 75,891,672
2014 74,234,398
Source: Provincial Boards and Agencies
Link: http://www.dairyinfo.gc.ca/index_e.php?s1=dff-fcil&s2=farm-ferme&s3=prod&s4=can
18. 17
The table above shows that the number of dairy quotas have been increasing over the period
from 2006 to 2014. This could be due to the increased demand for milk. If Canada implements
the TPPA, it would have to open up the market to free market forces of demand and supply.
Year US Price (Litre)
Canada Milk
Price (Litre)
1995 0.76 1.34
1996 0.82 1.33
1997 0.84 1.38
1998 0.86 1.41
1999 0.9 1.43
2000 0.92 1.45
2008 1.00 1.42
2009 0.82 1.62
2010 0.86 1.17
2011 0.94 2.22
2012 0.92 2.30
2013 0.91 2.32
2014 0.97 2.34
2015 0.95 2.34
Source: International Dairy Federation (IDF), Statistics Canada
Explanation of Results
To fully capture the gains from the Trans-Pacific Partnership Agreement, it is important to have a
quick overview of the TPP economic data. The table below shows some useful statistics.
19. 18
Source: Ciuriak and Xiao (2014)
The Trans-Pacific Partnership parties have a combined population of approximately 800 million
people, a combined Gross Domestic Product of about US$28 trillion, imports of goods of
approximately US$5.2 trillion and imports from commercial services of close to US$1.0 trillion22
.
It is against this background and the above stated assumptions that the ball pack welfare quantities
are given by the respective areas on the graphs above as Canada opens up to trade of milk products.
As of 2014, the consumer surplus in Canada was in the region of $5 938 751.81. In case of Canada
opening up to the Trans-Pacific Partnership agreement, this value would increase as the prices of
milk products would be expected to fall in the medium to long run and as more players come into
the dairy sector. However, notwithstanding that dairy sector is a capital intensive business in terms
of commercial needs ranging from the relatively higher dairy wage rate in the sector to the high
22
Ciuriak, Dan, and Jingliang Xiao. “The Trans-Pacific Partnership: Evaluating the ‘Landing Zone’ for Negotiations.” SSRN
Scholarly Paper. Rochester, NY: Social Science Research Network, September 21, 2014.
http://papers.ssrn.com/abstract=2550935.
20. 19
value equipment required in the milking process like the milking parlour, the assumption is that
there will be investors who invest in the sector at commercial rates.
In contrast, the producer surplus would be expected to fall as the inefficient farmers are driven out
of business through free market mechanism. Perhaps this is the reason why some dairy farmers are
against the opening up of the dairy sector. Over the years, the dairy farmers have been earning a
higher than average returns under the supply management23.
Geopolitically, the Trans-Pacific Partnership Agreement would counter the rise of the Association
of Southeast Asian Nations (ASEAN) and the Regional Comprehensive Economic Partnership
(RCEP)24 by harmonizing this mega market (Ciuriak and Xiao, 2014).
Experience from Australia and New Zealand
Canada could take lessons from Australia and New Zealand when opening up the dairy sector to
competition. Australia implemented the dairy supply management system in the 1920s in the face
of both domestic and international market pressures and opened up the system to international
trade in 200125. The Canadian dairy supply management system is closely related to the Australian
system in many ways for example the marketing of table and cream milk were set at level above
the export equivalence (Martha et al, 2012). It was administered from provincial level which is the
same with the Canadian. While there are some notable differences between the two systems, The
Australian government agreed to pay $1.6 billion to dairy farmers under the Dairy Structural
Adjustment Program (DSAP)26
.
23
http://papers.ssrn.com/abstract=2089041.
24
RCEP comprises of Australia, New Zealand, China, India, Japan, and Korea
25
http://papers.ssrn.com/abstract=2089041
26
http://papers.ssrn.com/abstract=2089041
21. 20
The New Zealand dairy system27
was different from the current Canadian system in that
fundamentally, it was export focused, farmer-owned and, cooperative driven from the initial stages
and the benefits came from the power of pooled resources (Martha et al, 2012).
The two cases offer examples of benefits of opening up to international trade as New Zealand and
Australia have managed to produce milk more efficiently and also benefited from increased export
earnings from dairy products. While there may be differences in terms of the specifics of how the
Canadian dairy supply management system could be phased out, the benefits that could be gained
from opening up to trade could be huge. The Trans- Pacific Partnership Agreement offers such a
window for politicians, dairy farmers and consumers to be realistic to what Canada could be losing
out through protecting some inefficient dairy farmers and also international investment
opportunities from other countries in the TPPA.
Criticism of the Model
While the model tries to quantify the welfare implications that could emanate from Canada
opening up the regulated dairy sector as rationally as possible with the given information, the finer
details about the Trans-Pacific Partnership Agreement are closely kept secret between the
negotiating governments until such time it is finalized. The demand curve is assumed to be constant
in the model and the focus in mainly on the supply function. However, in reality, demand
preferences may change in tandem with changing supply dynamics.
The Trans-Pacific Partnership Partners tend to have trade in more similar products for example,
trade would be more complimentary and better if there were more pronounced differences in the
milk types. Milk is also not easily transportable across borders as it is perishable. To buttress this
fact, Ciuriak and Xiao (2014) highlight that the correlation of Trade Specialization Indexes for
Canada and the other eleven TPP members is quite similar. This is shown below.
27
New Zealand never had a supply management system like the one Australia had and the one Canada has, it provided
agricultural subsidies hence there was no accumulated quota value(Martha et al, 2012)
22. 21
Source: Ciuriak and Xiao, 2014
Conclusion
The welfare implications for opening up the dairy sector is close to a billion at farm gate level.
The revenue that could be generated from an open dairy system is closely contested amongst
different stakeholders ranging from dairy consumers, dairy processors, and government and dairy
farmers. Taken from the eyes of dairy consumers, the Canadian dairy consumers would pay less
than what they are currently paying when the country opens up to international trade by
implementing the Trans-Pacific Partnership Agreement. In contrast, the dairy farmers would
receive less than their current above average returns per hectare in the medium to long run. In
calculating the welfare implications, the overall projections largely depend on the assumptions
stated holding true over time. The most important question there would be to have a feasible
compensation mechanism to phase out the current dairy quota system over time. A minimum of a
ten year phase out process would seem feasible for the Canadian government. This would enable
the market to adjust to the more open conditions gradually with time.
23. 22
References
Arcus, Peter L. “THE VALUES OF MILK QUOTAS IN BRITISH COLUMBIA: An Economic
Analysis.” Canadian Journal of Agricultural Economics/Revue Canadienne D’agroeconomie 26,
no. 2 (July 1, 1978): 62–71. doi:10.1111/j.1744-7976.1978.tb02908.x.
Barichello, Richard R. The economics of Canadian dairy industry regulation. Vol. 2. Economic
Council of Canada, 1981.
Barichello, Richard, John Cranfield, and Karl Meilke. “Options for the Reform of Supply
Management in Canada with Trade Liberalization.” Canadian Public Policy 35, no. 2 (June 1,
2009): 203–17. doi:10.3138/cpp.35.2.203.
Bozic, Marin, Christopher A. Kanter, and Brian W. Gould. “Tracing the Evolution of the
Aggregate U.S. Milk Supply Elasticity Using a Herd Dynamics Model.” Agricultural Economics
43, no. 5 (September 1, 2012): 515–30. doi:10.1111/j.1574-0862.2012.00600.x.
Canada, Branding Management; International Markets Bureau; Market and Industry Services
Branch; Agriculture and Agri-Food Canada; Government of. “Comparative Consumer Profile -
Canada and the United States,” December 14, 2010.
Canadian Dairy Commission, Communication Dept. “Canadian Dairy Commission,” (2010-08-
05) http://www.revparl.caCapling, Ann, and John Ravenhill. “Multilateralising Regionalism:
What Role for the Trans-Pacific Partnership Agreement?” The Pacific Review 24, no. 5
(December 1, 2011): 553–75. doi:10.1080/09512748.2011.634078.
/31/3/31n3_08e_McIsaac.pdf. Accessed May 15, 2015
Centre, Government of Canada; Canadian Dairy Information. “Number of Farms, Dairy Cows and
Heifers - Canadian Dairy Information Centre (CDIC),” June 30,
2015. http://www.dairyinfo.gc.ca/index_e.php?s1=dff-fcil&s2=farm-ferme&s3=nb.
Ciuriak, Dan, and Jingliang Xiao. “The Trans-Pacific Partnership: Evaluating the ‘Landing Zone’
for Negotiations.” SSRN Scholarly Paper. Rochester, NY: Social Science Research Network,
September 21, 2014. http://papers.ssrn.com/abstract=2550935.
24. 23
“English Title / Titer En Anglais.” Accessed June 19, 2015. http://www.statcan.gc.ca/cgi-bin/sum-
som/fl/saveas-eng.cgi.
Findlay, Hall, and Martha. “Supply Management: Problems, Politics and Possibilities.” SSRN
Scholarly Paper. Rochester, NY: Social Science Research Network, June 21, 2012.
http://papers.ssrn.com/abstract=2089041.
Government of Canada, Foreign Affairs Trade and Development Canada. “Canada-European
Union: Comprehensive Economic and Trade Agreement (CETA).” Accessed May 15, 2015.
http://www.international.gc.ca/trade-agreements-accords-commerciaux/agr-acc/ceta-
aecg/benefits-avantages/agriculture-agricoles.aspx?lang=eng.
Oskam, A. J., and D. P. Speijers. “Quota Mobility and Quota Values: Influence on the Structural
Development of Dairy Farming.” Food Policy 17, no. 1 (February 1992): 41–52. Doi:
10.1016/0306-9192(92)90016-Q.
Schmitz, Andrew, and Troy G. Schmitz. “Supply Management: The Past and Future.” Canadian
Journal of Agricultural Economics/Revue Canadienne D’agroeconomie 42, no. 2 (July 1, 1994):
125–48. doi:10.1111/j.1744-7976.1994.tb00013.x.
Schmitz, Andrew. “Supply Management in Canadian Agriculture: An Assessment of the
Economic Effects.” Canadian Journal of Agricultural Economics/Revue Canadienne
D’agroeconomie 31, no. 2 (July 1, 1983): 135–52. doi:10.1111/j.1744-7976.1983.tb01193.x.
Sumner, Daniel A., and Norbert L. W. Wilson. “Capitalization of Farm Policy Benefits and the
Rate of Return to Policy-Created Assets: Evidence from California Dairy Quota.” Applied
Economic Perspectives and Policy 27, no. 2 (June 20, 2005): 245–58. doi:10.1111/j.1467-
9353.2005.00224.x.
Lindall, Scott A., Douglas C. Olson, and Gregory S. Alward. “Deriving Multi-Regional Models
Using the IMPLAN National Trade Flows Model.” Journal of Regional Analysis and Policy 36,
no. 1 (2006). http://econpapers.repec.org/article/agsjrapmc/132316.htm.
Petri, Peter A., Michael G. Plummer, and Fan Zhai. The Trans-Pacific Partnership and Asia-
Pacific Integration: A Quantitative Assessment. Peterson Institute, 2012.
25. 24
Troughton, Michael J. “The Role of Marketing Boards in the Industrialization of the Canadian
Agricultural System.” Journal of Rural Studies, Special Issue Institutions and Rural Systems, 5,
no. 4 (1989): 367–83. Doi: 10.1016/0743-0167(89)90063-6.
“Trans-Pacific Partnership (TPP) Free Trade Negotiations.” Accessed May 15, 2015.
http://www.international.gc.ca/trade-agreements-accords-commerciaux/agr-acc/tpp-ptp/benefits-
avantages.aspx?lang=eng.
http://ageconsearch.umn.edu/bitstream/197161/2/Session%204%20-
%20Barichello%20Liew%20Grant.pdf. Accessed May 15, 2015
http://www.dairyfarmers.ca/what-we-do/international-trade/international-trade-
negotiations/comprehensive-economic-and-trade-agreement-with-the-european-union. Accessed
May 15, 2015
http://policyoptions.irpp.org/wp-content/uploads/sites/2/assets/po/canada-us-trade-
tensions/gifford.pdf .Accessed online. March 26, 2015
http://www.agr.gc.ca/eng/industry-markets-and-trade/statistics-and-market-information/by-
region/canada/comparative-consumer-profile-canada-and-the-united-
states/?id=1410083148458#d.
http://www.wcds.ca/proc/2013/Manuscripts/p%20113%20-%20128%20Muirhead.pdf. Accessed
online 14 May, 2015
http://www.iedm.org/files/janv06_en.pdf. Accessed May 19, 2015
http://ageconsearch.umn.edu/bitstream/51791/2/IAAE%202009-Ref%20356-Davis.pdf.
Accessed online, 22 July 2015.
http://www.wcds.ca/proc/2013/Manuscripts/p%20113%20-%20128%20Muirhead.pdf. Accessed
online, 14 May, 2015
http://www.imf.org/external/research/index.aspx. Accessed Online, June 23, 2015
http://www.fao.org/docrep/012/i1522e/i1522e02.pdf. Accessed Online, 15 July, 2015
http://www.fao.org/agriculture/dairy-gateway/milk-and-milk-products/en/#.VaaiSvlVhBc.
Accessed Online, 15 July, 2015