SlideShare a Scribd company logo
1 of 46
Download to read offline
For updated information, please visit www.ibef.org July 2018
GOA
AGUADA FORT IN CANDOLIM, GOA
PEARL OF THE ORIENT
.
Table of Content
Executive Summary .…………….…….…....3
Introduction ……..………………………...….4
Economic Snapshot ……………….….…….9
Physical Infrastructure ………..……...........15
Industrial Infrastructure ……..……….........26
Key Sectors ………….………………..…...29
Key Procedures & Policies………………...34
Annexure.………….……..….......................43
Social Infrastructure …..……..……….........23
For updated information, please visit www.ibef.orgGOA3
EXECUTIVE SUMMARY
 Goa currently* has a total of 38 operational mining leases with a reported production of 6.08 million tonnes
in 2017-18 (up to December 2017).
 Exports of iron ore reached 17.64 million tonnes between September 2015 and November 2017.
 Total Iron Ore1 traffic handled at Mormugoa Port, Goa in 2017-18P was 10.26 million tonnes.
India’s major iron ore
producer
 During 2016-17, the total traffic handled by Mormugao port was recorded to be 33.18 million tonnes,
registering a growth of 59.70 per cent over the previous year, which is the highest growth rate among 12
major ports of the country. The port handled 26.90 million tonnes of cargo in 2017-18.
 The average output per ship berth day was recorded to be 12,042 million tonnes during the same period.
Mormugao Port,
reflected remarkable
growth
 Goa is one of the fastest growing states in the country. Goa’s gross state domestic product (GSDP) was Rs
645.44 billion (US$ 9.62 billion) in 2016-17.
Strong economic
growth
 Goa is a popular tourist destination due to its natural beauty and bountiful avenues for leisure and relaxation.
During 2017, Goa witnessed arrivals of 6,895,234 domestic tourists and 890,459 foreign tourists.
Tourist paradise
Source: Economic Survey of Goa, Indian ports Association, Goa Tourism Department
Note: * during 2017-18 as per Goa Economic Survey 2017-18, 1 – Includes Pellets, P - Provisional
GOA
INTRODUCTION
For updated information, please visit www.ibef.orgGOA5
GOA FACT FILE
Source: Census 2011
 Goa is located in the western region of India. The state shares its
border with the Arabian Sea to the west, Maharashtra to the north
and Karnataka to the south and the east.
 Languages spoken are Konkani, Marathi, Portuguese, Hindi and
English.
 Goa’s administrative headquarters are located at Panaji (the state
capital) and Margao. The state has two districts: North Goa and
South Goa.
 Goa has a tropical climate, with a monsoons lasting from June to
September. Due to its long coastline, the weather is hot and humid
for the rest of the year.
Parameters Arunachal Pradesh
Capital Panaji
Geographical area (sq km) 3,702
Administrative districts (No) 2
Population density (persons per sq km) 364
Total population (million) 1.46
Male population (million) 0.74
Female population (million) 0.72
Sex ratio (females per 1,000 males) 973
Literacy rate (%) 88.7
For updated information, please visit www.ibef.orgGOA6
ADVANTAGE GOA
High Economic Growth
 The GSDP (in Rs) increased at a compound
annual growth rate (CAGR) of 8.78 per cent
between 2011-12 and 2016-17.
 The state has one of the highest per capita GSDP
in the country and stands at about US$ 6,345.94 in
2016-17.
Facilitating infrastructure
 Goa has a well-developed social, physical and
industrial infrastructure, and virtual connectivity.
 It has an international airport that is in line its
ambition to be a globally recognised leisure
destination. It also has significant port
infrastructure.
Rich labour pool
 Goa’s high rate of literacy has attracted
knowledge-based industries such as
pharmaceuticals, biotechnology and IT.
 A large proportion of the population can speak
English, which helps boost the state’s tourism
and ITeS industries.
Strong presence in
mining, tourism and pharmaceuticals
 Abundant reserves of iron ore.
 Established base for the pharmaceuticals industry
and an emerging destination for knowledge-based
industries such as biotechnology and IT.
 High inflow of international tourists driving tourism
revenue.
Advantage
Goa
Source: Economic Survey of Goa 2017-18, Press Information Bureau
For updated information, please visit www.ibef.orgGOA7
GOA IN FIGURES
Parameter Goa India
GSDP as a percentage of all
states’ GSDP
0.42 100.0
GSDP growth rate (in Rs) (%) 18.92 10.8
Per capita GSDP (US$) 6,345.94 1,750.29
Goa‘s Contribution to Indian Economy (2016-17)
Parameter Goa India
Installed power capacity
(MW) (May 2018)
549.41 343,898.39
Wireless subscribers (mn)
(April 2018)1 94.80 1,125.07
Internet subscribers1 (mn)
(March 2018)
39.51 493.96
National Highway length
(km)
293 122,432
Major and minor ports (No) 1+5 13+187
Airports (No) 1 125
Physical Infrastructure in Goa
Parameter Goa India
Literacy rate (%) 88.7 73.0
Birth rate (per 1,000
population)
12.9 20.4
Social Indicators
Parameter Goa India
Completed and Operational
PPP projects (No)
42 9,068
Industrial Infrastructure
Parameter Goa India
Cumulative FDI equity inflows
(US$ billion) April 2000 – March
2018
0.967 376.97
Investments
Note: GSDP, per capita GSDP figures are taken at current prices, exchange rate used is average of 2016-17 i.e. 67.09; 1Goa is included in Maharashtra circle
Note: PPP: Public Private Partnership
For updated information, please visit www.ibef.orgGOA8
STATE VISION
Vision 2035
Value chains to
success
Preserve beauty
and serenity
Knowledge centric
Governance
 To depend on natural
resources and related logistic
industries, tourism and related
services, healthcare & pharma
industry, etc.
 The state plans to be a
knowledge-centric destination in
the upcoming years.
 The state plans to preserve its
natural beauty at all costs
 To ensure vibrant future for the
habitats of the state.
 The foundation of high
quality governance should
be fairness, accountability
and transparency.
 Goa plans to emerge as the
most well-governed state in
India.
 Goa’s per capita GDP is
twice that of India and the
state aims to exceed that in
the next 25 years.
 In spite of its higher literacy
rate, the state plans to move
one step ahead.
 To conserve Goa’s biodiversity,
embrace responsible mining,
develop tourism sites.
Source: Goa Chamber of Commerce and Industry
GOA
ECONOMIC SNAPSHOT
For updated information, please visit www.ibef.orgGOA10
ECONOMIC SNAPSHOT – GSDP
 At current prices, Goa’s gross state domestic product (GSDP)
was Rs 645.44 billion (US$ 9.62 billion) in 2016-17.
 The GSDP (in Rs) increased at a compound annual growth rate
(CAGR) of 8.78 per cent between 2011-12 and 2016-17.
GSDP of Goa at current prices
Source: Directorate of Economics and Statistics Goa
8.84
7.00
5.94
7.82
8.29
9.62
423.67
381.20
359.21
478.14
542.75
645.44
0
100
200
300
400
500
600
700
0
2
4
6
8
10
12
2011-12
2012-13
2013-14
2014-15
2015-16
2016-17
US$ billion Rs billion
Note: exchange rates used are averages of each year
GSDP per capita of Goa at current prices
6,031
4,746
3,998
5,230
5,509
6,346
289,192
258,441
241,893
319,827
360,634
425,749
0
50,000
100,000
150,000
200,000
250,000
300,000
350,000
400,000
450,000
-
1,000
2,000
3,000
4,000
5,000
6,000
7,000
2011-12
2012-13
2013-14
2014-15
2015-16
2016-17
US$ Rs
 The state’s per capita GSDP was Rs 425,749 (US$ 6,346), one of
the highest in India, during 2016-17.
 Goa’s per capita GSDP (in Rs) increased at a CAGR of 8.04 per
cent between 2011-12 and 2016-17.
CAGR 8.04%CAGR 8.78%
For updated information, please visit www.ibef.orgGOA11
ECONOMIC SNAPSHOT – NSDP
 At current prices, Goa’s net state domestic product (NSDP) was Rs
587.71 billion (US$ 8.76 billion) in 2016-17.
 The NSDP (in Rs) increased at a compound annual growth rate
(CAGR) of 9.11 per cent between 2011-12 and 2016-17.
NSDP of Goa at current prices
CAGR 9.11%
7.93
6.35
5.30
7.07
7.52
8.76
380.09
345.67
320.43
432.33
492.22
587.71
0
100
200
300
400
500
600
700
0
1
2
3
4
5
6
7
8
9
10
2011-12
2012-13
2013-14
2014-15
2015-16
2016-17
US$ billion Rs billion
Source: Directorate of Economics and Statistics Goa
Note: exchange rates used are averages of each year
NSDP per capita of Goa at current prices
5,411
4,304
3,567
4,729
4,996
5,778
259,444
234,354
215,776
289,185
327,059
387,668
0
50,000
100,000
150,000
200,000
250,000
300,000
350,000
400,000
450,000
0
1,000
2,000
3,000
4,000
5,000
6,000
7,000
2011-12
2012-13
2013-14
2014-15
2015-16
2016-17
US$ Rs
 The state’s per capita NSDP was Rs 387,668 (US$ 5,778) in
2016-17.
 Goa’s per capita NSDP (in Rs) increased at a CAGR of 8.36 per
cent between 2011-12 and 2016-17.
CAGR 8.36%
For updated information, please visit www.ibef.orgGOA12
ECONOMIC SNAPSHOT – PERCENTAGE
DISTRIBUTION OF GSVA
 In 2016-17, the tertiary sectorµ accounted for 35.55 per cent of GSVA
at current prices, secondary sector for 55.18 per cent and the
primary sector contributing a share of 9.26 per cent.
 At 11.67 per cent, the secondary sector had the highest growth
among all three sectors between 2011-12 and 2016-17, followed by
the tertiary sector (11.07 per cent).
 Growth in the tertiary sector has largely been driven by the tourism
industry, which facilitated growth of other related industries such as
banking and financial services, real estate, and business services.
Visakhapatnam port traffic (million tonnes)GSVA composition by sector
21.52%
9.26%
47.23%
55.18%
31.25% 35.55%
0%
10%
20%
30%
40%
50%
60%
70%
80%
90%
100%
2011-12 2016-17
Primary Sector Secondary Sector Tertiary Sector
-8.55%
11.07%
11.67%
CAGR
Source: Directorate of Economics and Statistics Goa
For updated information, please visit www.ibef.orgGOA13
ECONOMIC SNAPSHOT – FDI INFLOWS &
INVESTMENTS
 According to the Department of Industrial Policy & Promotion (DIPP),
FDI inflow into the state of Goa, between April 2000 and March 2018
was US$ 967 million.
 In 2017 - 2018, the number of investments filed were 4 and the
amount of investments proposed were Rs 141 crore (US$ 21.88
million)
Source: Department of Industrial Policy & Promotion
Investment intentions in terms of IEMs filed
Year Number
Proposed
investments
(US$ million)
2016 13 186.35
2017 12 20.48
2018 4 21.88
Visakhapatnam port traffic (million tonnes)FDI Inflows to Goa (US$ million)
302
38
9 17 35 18
83
43
724
762 771 788
823 841
924
967
200
400
600
800
1,000
1,200
1,400
FY11 FY12 FY13 FY14 FY15 FY16 FY17 FY18
Annual FDI Inflow
Cumulative from April 2000
For updated information, please visit www.ibef.orgGOA14
ECONOMIC SNAPSHOT – EXPORTS
Source: Ministry of Mines, Mormugao Port Trust Goa, Goa Economic Survey 2017-18
Commodities Loaded at Mormugao Port (Metric Tonnes)
Visakhapatnam port traffic (million tonnes)Export of Marine Products (US$ million) Visakhapatnam port traffic (million tonnes)Iron ore exports from Mormugao Port Trust (‘000 tonnes)
50.87
58.23 63.24
78.62 79.47
91.61 95.70
0.00
20.00
40.00
60.00
80.00
100.00
120.00
2011 2012 2013 2014 2015 2016 2017
604 3,570
15,053
10,259
0
5,000
10,000
15,000
20,000
2014-15 2015-16 2016-17 2017-18
Commodities 2014-15 2015-16 2016-17 2017-18
Total Ores 871,398 3,779,608 14,722,851 9,925,112
Calcined Allumina 21,000 21,000 47,150 30,468
Container Cargo 144,423 108,286 131,999 127,903
Granite 302,627 313,140 290,322 170,135
H.R. Steel Coils 1,625,094 841,166 1,820,700 1,551,369
Iron and Steel 62,571 0 140,908 353,580
Pig Iron 263,699 306,624 140,350 248,371
Petroleum, Oil and Lube 0 2,166 0 4,164
GOA
PHYSICAL
INFRASTRUCTURE
For updated information, please visit www.ibef.orgGOA16
PHYSICAL INFRASTRUCTURE – ROADS
 NH-17 runs along India's West Coast & links Goa to Mumbai in the
north & Mangalore to the south. NH-4A running across the state
connects Panaji to Belgaum (Karnataka) in the east. As of February
2018, Goa had 293 km of national highways.
 The state had a road density of 68.7 km per 1,000 sq. km of area, as
of December 2016.
 As per state’s Economic Survey, following road works were under
taken in the state during 2017-18:
• Major district road works were completed with a cost of Rs 12.78
crore (US$ 1.98 million).
• Rural road works were completed with a cost of Rs 68.21 crore
(US$ 10.58 million).
• Central road works were completed with a cost of Rs 39.17 crore
(US$ 6.10 million).
Road type Road length (km)
National highways (As of February 2018) 293
State highways 232
District highways 815
Source: Directorate of Transport PWD: Public Works Department, State Budget 2017-18
Note: Data is as per latest available information, exchange rate used is average of 2017-18 i.e. 64.45
For updated information, please visit www.ibef.orgGOA17
 The total railway route in Goa is comprising of two rail tracks: the
Konkan Railways line that runs from the north to south & the South-
Western Railways line that runs from west to east. These routes
connect the state to other parts of the country. These routs are
around 167 km long, and crosses the most important junction of the
state, the Madgaon railway station. Vasco Da Gama is the next
important railway station in the state.
 Konkan Railways, which connects Mumbai, Goa & Mangalore, has
considerably boosted tourism. The Mormugao port is connected
through a broad gauge line.
 An amount of US$ 14.87 million has been allocated under 2017-18
budget towards Konkan Railways. 4 railway overbridges are to be
built in Goa with financial support from the Rail Ministry. The
government has pulled off a new double-decker luxury train service
on Konkan Railways route that commutes tourists from Mumbai to
Goa.
 On May 22, 2017, state-of-the-art, high-speed, 15 coach train Tejas
Express, with a speed of 200 km/hour, made its debut. The train
would run between Mumbai to North Goa, covering a distance of
579 km in 8.5 hours. The train has 2 classes — executive chair car
& chair car, and is equipped with facilities like automatic doors,
secured gangways, Wi-Fi, LCD screens, magazines, tea-coffee
vending machines, bio-toilets, etc.
PHYSICAL INFRASTRUCTURE – RAILWAYS
Source: Maps of India
For updated information, please visit www.ibef.orgGOA18
PHYSICAL INFRASTRUCTURE – AIRPORTS
Goa Airport Passenger Traffic (million) Goa Airport Aircraft Movement
Source: Airports Authority of India
Freight handled by Goa airport (Metric Tonnes)
2013-14 2016-17 2017-18 2018-19*
4,767 4,103 4,372 269
24,326
24,018
27,430
26,804
28,904
33,422
39,030
47,801
50,567
4,351
0
10,000
20,000
30,000
40,000
50,000
60,000
2009-10
2010-11
2011-12
2012-13
2013-14
2014-15
2015-16
2016-17
2017-18
2018-19*
2.63
3.08
3.52 3.54
3.89
4.51
5.37
6.86
7.61
0.66
0
1
2
3
4
5
6
7
8
2009-10
2010-11
2011-12
2012-13
2013-14
2014-15
2015-16
2016-17
2017-18
2018-19*
 Passenger footfalls at the Goa airport during 2017-18 reached
7,607,249 with aircraft movement reaching 50,567 flights.
 Freight handled at Goa airport during 2017-18 was 4,372 MT.
 Goa has one airport at Dabolim, which functions as a domestic as
well as an international airport. The state is connected to most
Indian cities by air.
 The state ranks among the top 10 in all-India air traffic, most of
which is tourism related.
 The state has good connectivity in terms of international flights,
including chartered flights from European countries.
Note: For April 2018
For updated information, please visit www.ibef.orgGOA19
PHYSICAL INFRASTRUCTURE – PORTS
 Goa has 255 km of rivers & canals, providing an economical mode
for goods transport. The Mormugao harbour, a multi-purpose general
cargo berth situated in the port town of Vasco-da-Gama, handles
local & international maritime cargo traffic.
 The River Navigation Department was established to provide safe,
dependable & affordable transport facilities on different ferry routes
of Goa’s inland waters.
 During 2017-18, cargo traffic handled at the port was recorded to be
26.90 million tonnes. In April-May 2018 the port handled 4.35 million
tonnes of traffic.
Major ports  Mormugao
Minor ports
 Panaji
 Chapora
 Betul
 Talpona
 Tiracol
Commodity-wise Traffic Handled at Mormugao Port during
2017-18P
Commodity Quantity (metric tonnes)
POL (Petroleum, Oil & Lubricants) 629,000
Other Liquids 572,000
Iron ore 10,259,000
Thermal & Steam 1,999,000
Coking & others 8,514,000
Container tonnage 425,000
Container TEUs 32,000
Other Misc. Cargo 4,317,000
Source: Ministry of Shipping, Government of India, Indian Ports Association, Mormugao Port Trust
Ports
Note: P – Provisional
For updated information, please visit www.ibef.orgGOA20
PHYSICAL INFRASTRUCTURE – POWER
 The Electricity Department of Goa was created as a Government
Department in the year 1963. The Electricity Department is the only
licensee in the state of Goa for transmission and distribution of
Electrical Energy. As of April 2018, Goa had a total installed power
generation capacity of 549.41 MW.
 Of the total installed capacity, 500.45 MW was managed by central
utilities, 48.91 MW by private utilities and 0.05 MW by state utilities..
Thermal power plants accounted for a significant share in the total
installed capacity with 522.45 MW, whereas nuclear energy and
renewable energy contributed 26 MW and 0.96 MW respectively.
 The state generates power from its 48 MW naphtha-based plant of
Reliance Infrastructure Limited and it depends, largely, on the power
allocated from the central generating stations.
 The industrial sector is the largest consumer of electricity, followed
by the domestic sector. Goa Electricity Department controls power
infrastructure in the state.
Visakhapatnam port traffic (million tonnes)Installed power capacity (MW)
Source: Central Electricity Authority, State Budget 2016-17 Economic Survey of Goa, 2014-15
357.20
380.90
386.90
400.20
430.02
400.02
400.02
412.45
540.56
549.41
549.41
0.00
100.00
200.00
300.00
400.00
500.00
600.00
2008-09
2009-10
2010-11
2011-12
2012-13
2013-14
2014-15
2015-16
2016-17
2017-18
2018-19*
Note: * - 2018-19 (Up tp May 2018)
For updated information, please visit www.ibef.orgGOA21
PHYSICAL INFRASTRUCTURE – TELECOM
 Goa is among the few states in the country to have 100 per cent
automatic telephone systems with a good network of telephone
exchanges.
 Goa has a fibre-optic cable network spread through the state; it
provides high-speed access for a wide range of internet-related
services. All the gram panchayats in the state of Goa are connected
with optical fiber.
 As of April 2018, Goa(1) has 94.80 million wireless subscribers and
1.71 million wireline subscribers. Moreover, the tele-density stood at
108.46 per cent1, as of April 2018.
 In December 2016, the Government of Goa announced the launch of
Goa Yuva Sanchar Yojna, under which the state would be providing
100 minutes of free talk time and 3 GB of internet data every month,
free with a new SIM card.
Source: Economic Survey of Goa, Telecom Regulatory Authority of India
Wireless subscribers(1) 94,795,487
Wireline subscribers(1) 1,705,903
Internet subscribers (million)(1)(2) 39.51
Tele-density(1) 108.46
Telecom Infrastructure – April 2018
Some of the major telecom service providers
 Bharat Sanchar Nigam Limited (BSNL)
 Tata Indicom
 Bharti Airtel
 Aircel Limited
 Reliance Communications
Note: 1Denotes Maharashtra including Goa, 2As of March 2018
For updated information, please visit www.ibef.orgGOA22
PHYSICAL INFRASTRUCTURE - URBAN
DEVELOPMENT
 Panaji is one of the 65 cities identified under the Jawaharlal Nehru
National Urban Renewal Mission (JNNURM). Two projects costing
around US$ 15.6 million have been sanctioned for Panaji.
 As per budget 2017-18, US$ 81.81 million would be allocated for Panaji
under the Smart City mission, 5 major cities to be connected with tourist
places with frequent plying of KTC with a budget of US$22.31 million. All
street lights would be converted to LED lights by December 2017, a 2nd
solid waste treatment plant to be built at Cacora in South Goa, an
amount of US$ 17.25 million has been allocated for garbage
management.
 Under AMRUT (Atal Mission for Rejuvenation & Urban
Transformation) scheme by the Government of India, the city of
Panaji has been selected from the state of Goa.
Source: JNNURM, Ministry of Urban Development, Public Works Department of Goa SJSRY – Swarna Jayanti Shahari Rozgar Yojana NULM – National Urban Livelihoods Mission
Funds allocated to Goa under SJSRY and NULM (US$ million)
0.23
0.37
0.14
0.51
0.13
0.2
0
0.1
0.2
0.3
0.4
0.5
0.6
2012-13 2013-14 2014-15 2015-16 2016-17 2017-18
Water supply
 Water supply in Goa’s urban and rural areas is 143 and 82 litres per
capita per day (LPCD), respectively.
 Goa’s water tariffs are among the cheapest in the country.
 The state has proposed an investment outlay of US$ 160.1 million for
water supply and sanitation projects in its 12th Five-Year Plan (2012-17).
Area Based
Development
Service improvement for urban poor in Mala
Fontainhas area, Integrated Urban Water
Management, Church Square Revitalization,
Provision of basic services in entire area (2 sq
km), etc
Smart
Transportation and
Eco Mobility
Digital Enabled System for Public Bike Share
System, Air Quality monitoring stations, Smart
Parking, Smart Component for buses (GPS,
automated fare collection etc.), etc
Smart
Environmental
Services
Trolley Bins with RFID tags, Biometric
Attendance in 12 Zonal Offices, CCTV
Surveillance of black spots, etc
Smart City Proposal: List of projects in Panaji
GOA
SOCIAL
INFRASTRUCTURE
For updated information, please visit www.ibef.orgGOA24
SOCIAL INFRASTRUCTURE – EDUCATION
 Goa has a number of leading engineering, business management,
medical and legal institutes. The Maritime School, under the Captain
of Ports Department, Government of Goa, is among the first of its
kind in the country.
 Goa College of Pharmacy, set up in 1842, is one of the oldest
institutes in India. It offers bachelor’s, master’s & diploma courses in
pharmacy. The institute has 60 seats for bachelor's degree, 60 seats
for diploma & 36 seats for master’s degree in various fields of
pharmacy.
 The state has a literacy rate of 88.7 per cent according to the data of
Census 2011; the male literacy rate is 92.65 per cent & the female
literacy rate is 84.66 per cent. During 2017-18, the total enrolments
in schools were recorded to be 239,834.
 As per State Budget 2018-19, Goa Government has allocated Rs
18.91 billion (US$ 293.55 million) to the Education sector. As per
state budget 2017-18, the Government of Goa has proposed to
allocate US$ 6.24 million as financial assistance for Goa University,
Source: Educational Statistics at a Glance 2017-18, Government of Goa
Primary schools 1,157
Middle schools 64
Secondary schools 408
Higher secondary schools 200
Primary level and Middle level
teacher – pupil ratio
1:24
Secondary level and Higher
secondary level teacher – pupil
ratio
1:21
Educational Statistics, 2016-17
Total 88.70
Male 92.65
Female 84.66
Literacy rate (%)
 Shree Rayeshwar Institute of
Engineering and Information
Technology
 Padre Conceicao College of
Engineering
 National Institute of
Oceanography
 Parvatibai Chowgule College of
Arts & Science
 Don Bosco College
 St. Xavier’s College
 BITS Pilani Goa campus
Some of the higher education institutions
For updated information, please visit www.ibef.orgGOA25
SOCIAL INFRASTRUCTURE – HEALTH
 Goa has some very renowned hospitals including Apollo Victor
Hospital in Margao, Manipal Hospital in Panaji & Vrundavan Shalby
Hospital in Mapusa. As of May 2018, the number of primary health
centres & sub centres in Goa were recorded to be 48 and 218,
respectively.
 Further, the state government has also made a provision of US$ 2.43
million for buildings, US$ 0.18 million for books & periodicals & US$
0.70 million for various equipment for Goa Medical College.
 As per Budget 2018-19, State Government has allocated Rs 521.27
crore (US$ 80.88 million) to the Health Services sector. A provision
of US$ 0.12 million has also been made for supplies and materials &
US$ 3.10 million is allocated for the completion of the 2nd phase of
the building of Goa Dental College.
 The state government announced ban on use of plastic bags
effective from July 2017. Manufacturing, selling and carrying plastic
bags would lead to imposition of a fine of up to US$ 74.37.
Source: Goa Economy in Figures - 2015, Economic Survey of Goa, 2014-15 1Per thousand persons, 2Per thousand live births PHC# -Primary Health Centre, State Budget 2016-17, 2017-18
2018-19
Primary health centres 48
Sub centers 218
Community health centres 10
Active district hospitals 3
Active sub-district hospitals 2
Health infrastructure (as of May 2018)
Birth rate
1
12.9
Death rate
1
6.7
Infant mortality rate
2
8
Health indicators (September 2017)
GOA
INDUSTRIAL
INFRASTRUCTURE
For updated information, please visit www.ibef.orgGOA27
INDUSTRIAL INFRASTRUCTURE
Industry clusters Industries
Verna Rubber, plastics, petroleum products, pharmaceuticals, electronics and telecommunication equipment.
Bicholim Engineering, oil products, plastics, leather, textiles, food processing, soaps and agro products.
Kundaim Rubber, plastics, petroleum products, pharmaceuticals, steel fabrications and aluminum furniture.
Margao Printing, plastics, herbal hair oils, cosmetics, ice blocks, engineering items and industrial diamond tools.
Mormugao Shipbuilding and repair.
Corlim
Metal works, engineering, cold storage, food processing, electronic products, paper products, chemicals, paints
and varnishes.
Vasco Shipbuilding and repair.
 Goa Industrial Development Corporation (Goa-IDC) is the nodal agency established for setting up of industrial estates & offering developed plots
to industrial units in the state.
 Goa-IDC has established 20 industrial estates, spread across the state’s talukas & is currently working on the expansion of existing industrial
estates as well as establishing new ones.
 7 ITIs (industrial training institutes) in the state of Goa are covered under the World Bank Assisted Vocational Training Improvement Project
(VTIP) while 1 ITI in the state has been taken up by the central government for upgradation through public private partnership.
Source: Goa Industrial Development Corporation
For updated information, please visit www.ibef.orgGOA28
SEZ AND INDUSTRIAL ESTATES
 As of December 2017, Goa had seven formally approved and three
notified special economic zones (SEZs). However, there are no
operational SEZs in the state and no in-principle approved SEZ.
 On completion, the SEZs would primarily cover knowledge-based
industries such as biotechnology and IT/ITeS. The Goa Industrial
Development Corporation (Goa-IDC) assists in establishing
industries in specific industrial areas and estates. Goa-IDC has
established 20 industrial estates in various talukas of Goa. It plans to
expand eight of these existing units and establish another five
industrial estates.
 The Government is committed to make Goa an aspirational
investment destination for best-in-class manufacturing, tourism,
entertainment and other service industries, including research and
knowledge-based industries. Accordingly, the Government has set
an ambitious target of creating 50,000 jobs by 2019, facilitating new
investments of around US$ 4.2 billion in the state during 2014-19.
Sector-wise formally approved SEZs
Sector Developer
Number
of SEZs
Area
(Hectares)
IT/ITeS K. Raheja Corp Pvt. Ltd. 1 105.91
Biotechnology
Peninsula Pharma
Research Centre Pvt
Ltd
1 20.37
Pharmaceuticals
Meditab Specialities Pvt
Ltd
1 123.20
IT/ITeS
Paradigm Logistics and
Distribution Pvt Ltd
1 40.25
Gems and
Jewellery
Planet Mercantile
Company
1 13.28
Biotechnology
Inox Mercantile
company
1 48.48
IT
Panchbhoomi
Infrastructure
1 18.5
Source: Ministry of Commerce & Industry, Department of Commerce, Goa Industrial Development Corporation, Economic Survey of Goa
GOA
KEY SECTORS
 Mining
 Tourism and Hospitality
 Fishing
For updated information, please visit www.ibef.orgGOA30
KEY SECTORS – MINING… (1/2)
 The mining belt of Goa covers an area of approximately 700 sq km &
is mostly concentrated in the 4 talukas of Bicholim, Salcete,
Sanguem & Quepem.
 The iron ore in Goa is export oriented with average annual export
from Goa at around 30 million tonnes. Value of minerals produced
(excluding fuel minerals) in Goa in 2017-18 (up to January 2018)
reached Rs 620.55 crore US$ 96.29 million.
 Most mines in Goa are of open-cast type, which necessitates the
removal of over burden overlying the iron ore formations. During
2015-16, the state government created a separate District Mineral
Foundation under the MMDR Act, 1957, as per which the state’s
mining firms need to deposit an additional amount of 30 per cent of
the royalty paid to this fund.
 Under State Budget 2018-19, Rs 22.77 crore (US$ 3.53 million) was
allocated to the mining sector.
Source: Ministry of Mines, Government of India
Mineral Reserves (In ‘000 tonnes)
Iron ore-hematite 6,42,113
Iron ore-magnetite 2,15,557
Manganese 23,271
Bauxite 53,072
Quartz/silica sand 20,004
Goa mineral reserves*
Note: * - As per latest available data
For updated information, please visit www.ibef.orgGOA31
KEY SECTORS – MINING… (2/2)
 Formaly known as Sesa Goa, is one of the world's largest global diversified natural resource majors, with
operations across zinc-lead-silver, oil & gas, iron ore, copper, aluminium and commercial power.
 Vedanta has large iron ore mines in Goa and Karnataka and a pig iron plant in Goa. The mining operations are
carried out at the Codli group and the Sonshi group of mines in Goa.Vedanta Limited
For updated information, please visit www.ibef.orgGOA32
KEY SECTORS – TOURISM AND HOSPITALITY
 Innovative marketing strategies to project Goa as an all-time leisure
destination have resulted in higher tourist inflows over the years. With
the continuous in-flow of tourists, Russian & European tourists, in
collaboration with locals from Arambol to Patnem, have started
offering yoga training classes to people.
 During 2017, Goa witnessed arrivals of 6,895,234 domestic tourists
and 890,459 foreign tourists. E – visa facility issued at Dabolim
airport, Goa from January 2017 – December 2017 was 133,798.
 During 2017-18 (up to October 2017), the hotel rooms available in the
state increased by 7.93 per cent year-on-year.
 For the year 2018-19, the state government had made an allocation
of Rs 219.53 crore (US$ 34.06 million) to the tourism sector.
Source: Department of Tourism, Government of Goa, Economic Survey of Goa, 2014-15
Visakhapatnam port traffic (million tonnes)Tourist arrivals in Goa (in million)
2.21
2.02 2.13 2.2 2.22 2.33
2.62
3.54
4.76
5.65
6.90
0.39
0.35 0.38 0.44 0.45 0.45
0.49
0.51
0.54
0.68
0.89
0
1
2
3
4
5
6
7
8
9
2007 2008 2009 2010 2011 2012 2013 2014 2015 2016 2017
Domestic Foreign
For updated information, please visit www.ibef.orgGOA33
KEY SECTORS– FISHERIES
 Goa has a coastline of about 104 kms and inland waterways of about
250 km. The coast is full of creeks and estuaries formed by rivers;
144.28 thousand tonnes of marine fish and 5.33 thousand tonnes of
inland fish were harvested in 2017.
 As per budget 2018-19, Fisheries has been allotted an annual fund
of Rs 6,900 crore (US$ 10.71 million).
 Marine fish production in the state in 2017 was 120,430 tonnes while
inland fish production was 5,332 tonnes.
Annual fish catch (‘000 tonnes)
Source: Economic Survey of Goa, 2017-18 State Budget 2016-17
91.1 88.7 80.6 87.0
86.1
86.6
87.9
128.1
105.7
101.1
144.3
2.4
3.0 3.2 3.3
3.5 3.8 4.6
3.7 4.6
4.4
5.3
0.0
1.0
2.0
3.0
4.0
5.0
6.0
0.0
50.0
100.0
150.0
200.0
2007
2008
2009
2010
2011
2012
2013
2014
2015
2016
2017
Marine (LHS) Inland (RHS)
Marine Fish Production in Goa (‘000 tonnes)
Source: Department of Animal Husbandry, Dairying and Fisheries,, Ministry of Agriculture, Government of India, State Budget 2018-19
Note: 2016-17(P) – provisional, Conversion rate = 64.45
86.60 88.00
128.10
108.20
101.10
120.40
0.00
20.00
40.00
60.00
80.00
100.00
120.00
140.00
2012 2013 2014 2015 2016 2017
GOA
KEY PROCEDURES &
POLICIES
For updated information, please visit www.ibef.orgGOA35
KEY INVESTMENT PROMOTION OFFICES
Agency Description
Goa Industrial Development
Corporation (Goa-IDC)
 It has been established with the purpose of securing land and assisting in fast and orderly establishment of
industries in the 20 designated industrial areas and estates.
Economic Development
Corporation
 This is a state Government-promoted financial institution to operate and manage government-promoted
financial schemes.
 It acts as an investment company and provides financial assistance to entrepreneurs for starting as well as
expanding business units.
The Goa State Infrastructure
Development Corporation
 This was set up as a Special Purpose Vehicle (SPV), with the basic aim to develop infrastructure in a time-
bound manner.
Goa Handicrafts Rural and Small
Scale Industries Development
Corporation
 It promotes traditional arts and crafts, fashioned by the state’s artists and artisans.
 It performs functions related to procurement and distribution of indigenous and imported raw material,
especially for small scale units.
 It has been instrumental in starting the ‘Deen Dayal Swayamrojgar Yojana’, a scheme to develop self-
employment opportunities for the youth.
Goa Tourism Development
Corporation
 It promotes tourism and related activities in Goa.
 It focuses on developing eco-tourism, heritage tourism, adventure tourism, medical tourism and event
tourism.
Goa Horticulture Corporation
 It promotes investments in export-oriented projects, especially for the cultivation of exotic fruits and
vegetables, floriculture, etc.
 It is entrusted with the development of horticulture estates and establishment of sales outlets for local
produce through establishments called ‘Krishi Ghars’.
Info Tech Corporation of Goa Ltd
(ITG)
 It looks after the development of IT-related infrastructure, ITeS and implementation of the government’s
e-governance objectives.
For updated information, please visit www.ibef.orgGOA36
CONTACT LIST
Udyog Bhavan,
Panaji- 403 001 Goa
Phone: 91-832-2226377
Website: http://www.goaditc.gov.in/
Directorate of Industries, Trade and Commerce
Narayan Rajaram Bandekar Bhavan, T.B Cunha Road,
P.O. Box 59, Panaji - 403 001
Phone: 91-832-2424252
E-mail: goachamber@goachamber.org
Website: http://www.goachamber.org/
Goa Chamber of Commerce & Industry
For updated information, please visit www.ibef.orgGOA37
KEY APPROVALS REQUIRED
Approvals and clearances required Departments to be consulted Estimated time in days
Incorporation of company Registrar of Companies N.A.
Registration, Industrial Entrepreneurs Memorandum (IEM),
Industrial Licences
High Powered Coordination Committee (HPCC) for large
and medium-sized projects, Director of Industries, Trade
and Commerce for small and micro projects
N.A.
Allotment of land Goa-IDC 8 to 15
Permission for land use Goa-IDC 8 to 15
Site environmental approval
Goa State Pollution Control Board and Ministry of
Environment and Forests
60
No objection certificate and consent under Water and
Pollution Control Acts
Goa State Pollution Control Board 7 to 14
Approval of construction activity and building plan Town and Country Planning Authority 30
Sanction of power State Electricity Department Up to 60
Registration under the State Sales Tax Act and Central
and Excise Act
Sales Tax Department and Central and State Excise
Department
N.A.
N.A. – Not Available
For updated information, please visit www.ibef.orgGOA38
APPROVAL PROCESS … (1/2)
 The Goa Industrial Policy 2003 has revamped the single-window clearance mechanism in the state.
 HPCC, chaired by Goa’s Chief Minister, has been appointed responsible for dealing with large projects. Members of the committee include senior-
most officers of concerned state departments.
 The Director of Industries, Trade and Commerce handles small scale industries. The Goa-IDC and the District Industries Centre act as nodal
agencies for various projects in the state. Goa-IDC handles the creation of SEZs in the state.
Greater than US$
1.09 million
HPCC
Department of
Industries, Trade
and Commerce
Director of
Industries, Trade
and Commerce
The Chief Minister
District Industries
Centre
Goa Industrial
Development
Corporation
(Goa-IDC)
Nodal agency
Under the
Chairmanship ofInvestment handled
Below US$ 1.09
million
For updated information, please visit www.ibef.orgGOA39
APPROVAL PROCESS … (2/2)
 Goa Investment Policy 2013, which laid a special thrust on development of Special Investment Regions, aims to kick start investment in Goan
economy.
 This policy aims to articulate various initiatives being undertaken to make Goa a preferred and aspirational investment destination.
 It aims to create an institutional framework for facilitating investments in the thrust areas as well as other areas decided upon by the Investment
Promotion Board (IPB)/Government of Goa on an ongoing basis.
Evaluation and
recommendation by
satellite expert
consultant
IPB decision on
investment proposal
along with all
approving authorities
Check on land
availability in
industrial estates
Process for industrial set up in Goa
15 days Rejection
IPB
approval
Detailed
templatised
proposal submitted
to IPB
Land not available
Land
earmarked
30 days
Evaluation and
recommendation by
satellite consultant
Nodal officer
approval who would
assist with all
approvals Approval
Rejection
Receipt of all
clearances for unit to
establish facility and
start operations
30 days30 days30 days
Preliminary Project
Report submitted to
IPB
For updated information, please visit www.ibef.orgGOA40
COST OF DOING BUSINESS IN GOA
Cost parameter Cost estimate
Industrial land (per sq ft) US$ 10–50
Office space rentals (per sq ft per month) US 60 cents to US$ 2
Residential rentals (for a 2,000 sq ft house per month) US$ 800–1,300
Five-star hotel room (per night) US$ 160–800
Power cost (per kWh) Industrial: US 4.7–7.3 cents
Labour cost (minimum wage per day) US$ 3.9–5.5
Source: Industry sources, Goa-IDC, Ministry of Labour and Employment, Government of India, Electricity Department, Government of Goa
For updated information, please visit www.ibef.orgGOA41
STATE ACTS & POLICIES … (1/2)
 The government has notified the Goa Start-up Policy 2017 with the following objectives:
• Make Goa a hub of high value start-ups.
• Attract entrepreneurial talent to the state and build a robust start-up eco-system in Goa
• Provide assistance to local entrepreneurs and start-ups
• Create at least 100 successful start-ups in the next five years
 The Government of Goa has introduced the new Goa Investment Policy 2014 in order to boost investor confidence and attract new industries to Goa.
 Main objectives of the new policy include: making Goa an aspirational investment destination by making business a pleasure, for best in class
manufacturing, knowledge-based, tourism, entertainment and other service industries, while improving the environmental and social indicators of the
state.
 The state Government is working on the new tourism policy with a vision of overall tourism development and to engage with private players to invest
and develop infrastructure in the state.
For updated information, please visit www.ibef.orgGOA42
STATE ACTS & POLICIES … (2/2)
Objectives
IT Policy 2015
 To make state of Goa most preferred destination for investors there by making IT/ITeS/ESDM a vibrant industry
leading to inclusive growth and employment generation.
Mining Lease Policy,
2014
 The state Government can directly auction the leases in order to secure the best returns for the grant of leases by
way of a competitive bidding process.
Goa Investment Policy
2014
 Creating 50,000 jobs and investing US$ 4.2 billion in new projects in the next five years.
 Providing 24x7 high-quality power supply and logistics infrastructure to industries.
Biotech Policy 2006
 To ensure accelerated growth in all areas of the biotechnology sector such as education, research and economic
sectors covering healthcare, agriculture, industry, services, environment management and employment generation.
Objectives of the policy include prioritisation of the thrust areas for basic and applied research and technology
development, and promotion of innovations in R&D by providing financial and infrastructural support.
Goa Special Economic
Zone Policy 2006
 To augment infrastructure facilities to boost exports.
Industrial Policy 2003
 To ensure accelerated industrial development, catalyse economic growth and balanced regional growth, protect
the environment and create sustainable employment for local youth of the state.
 Key areas identified are pharmaceuticals, drugs and biotechnology, food processing, agro-based, IT and IT-
enabled services, eco-tourism/heritage tourism/adventure tourism/event tourism/medical tourism and
entertainment industries.
Read more
Read more
Read more
Read more
Read more
Read more
GOA
ANNEXURE
For updated information, please visit www.ibef.orgGOA44
ANNEXURE…(1/2)- SOURCES
Data Sources
GSDP (state) MOSPI, Directorate of Economics and Statistics, Goa
Per capita GSDP figures MOSPI, Directorate of Economics and Statistics, Goa
GSDP (India) MOSPI, Directorate of Economics and Statistics, Goa
Installed power capacity (MW) Central Electricity Authority, as of April 2018
Wireless subscribers (No)
Telecom Regulatory Authority of India, as of
February 2018
Internet subscribers (Mn) Telecom Regulatory Authority of India, as of December 2017
National highway length (km) NHAI & Roads and Building Department, as of February 2018
Number of Ports India Ports Association
Airports (No) Airports Authority of India
Literacy rate (%) Census 2011
Birth rate (per 1,000 population) SRS Bulletin, September 2017
Cumulative FDI equity inflows (US$ billion) Department of Industrial Policy & Promotion, From April 2000 to December 2017
Operational PPP projects (No) DEA, Ministry of Finance, Government of India, February 2018
For updated information, please visit www.ibef.orgGOA45
ANNEXURE…(2/2) - EXCHANGE RATES
Exchange Rates (Fiscal Year) Exchange Rates (Calendar Year)
Year INR INR Equivalent of one US$
2004–05 44.95
2005–06 44.28
2006–07 45.29
2007–08 40.24
2008–09 45.91
2009–10 47.42
2010–11 45.58
2011–12 47.95
2012–13 54.45
2013–14 60.50
2014-15 61.15
2015-16 65.46
2016-17 67.09
2017-18 64.45
Q1 2018-19 67.04
Year INR Equivalent of one US$
2005 44.11
2006 45.33
2007 41.29
2008 43.42
2009 48.35
2010 45.74
2011 46.67
2012 53.49
2013 58.63
2014 61.03
2015 64.15
2016 67.21
2017 65.12
Source: Reserve Bank of India, Average for the year
For updated information, please visit www.ibef.orgGOA46
DISCLAIMER
India Brand Equity Foundation (IBEF) engaged Aranca to prepare this presentation and the same has been prepared by Aranca in consultation with
IBEF.
All rights reserved. All copyright in this presentation and related works is solely and exclusively owned by IBEF. The same may not be reproduced,
wholly or in part in any material form (including photocopying or storing it in any medium by electronic means and whether or not transiently or
incidentally to some other use of this presentation), modified or in any manner communicated to any third party except with the written approval of
IBEF.
This presentation is for information purposes only. While due care has been taken during the compilation of this presentation to ensure that the
information is accurate to the best of Aranca and IBEF’s knowledge and belief, the content is not to be construed in any manner whatsoever as a
substitute for professional advice.
Aranca and IBEF neither recommend nor endorse any specific products or services that may have been mentioned in this presentation and nor do
they assume any liability or responsibility for the outcome of decisions taken as a result of any reliance placed on this presentation.
Neither Aranca nor IBEF shall be liable for any direct or indirect damages that may arise due to any act or omission on the part of the user due to any
reliance placed or guidance taken from any portion of this presentation.

More Related Content

What's hot

What's hot (20)

Goa State Report November 2017
Goa State Report November 2017Goa State Report November 2017
Goa State Report November 2017
 
Goa State Report March 2018
Goa State Report March 2018Goa State Report March 2018
Goa State Report March 2018
 
Goa State Report September 2017
Goa State Report September 2017Goa State Report September 2017
Goa State Report September 2017
 
Goa State Report November 2016
Goa State Report November 2016Goa State Report November 2016
Goa State Report November 2016
 
Goa State Report - February 2017
Goa State Report - February 2017Goa State Report - February 2017
Goa State Report - February 2017
 
Goa State Report - January 2017
Goa State Report - January 2017Goa State Report - January 2017
Goa State Report - January 2017
 
Punjab State Report May 2018
Punjab State Report May 2018Punjab State Report May 2018
Punjab State Report May 2018
 
Punjab State Report - July 2018
Punjab State Report - July 2018Punjab State Report - July 2018
Punjab State Report - July 2018
 
Punjab State Report - April 2019
Punjab State Report - April 2019Punjab State Report - April 2019
Punjab State Report - April 2019
 
Punjab State Report - August 2018
Punjab State Report - August 2018Punjab State Report - August 2018
Punjab State Report - August 2018
 
Punjab State Report - November 2018
Punjab State Report - November 2018Punjab State Report - November 2018
Punjab State Report - November 2018
 
Punjab State Report July 2017
Punjab State Report July 2017Punjab State Report July 2017
Punjab State Report July 2017
 
Jharkhand State Report July 2017
Jharkhand State Report July 2017Jharkhand State Report July 2017
Jharkhand State Report July 2017
 
Nagaland State Report - October 2018
Nagaland State Report - October 2018Nagaland State Report - October 2018
Nagaland State Report - October 2018
 
Bihar State Report - November 2018
Bihar State Report - November 2018Bihar State Report - November 2018
Bihar State Report - November 2018
 
Bihar State Report - September 2018
Bihar State Report - September 2018Bihar State Report - September 2018
Bihar State Report - September 2018
 
Nagaland State Report - July 2018
Nagaland State Report - July 2018Nagaland State Report - July 2018
Nagaland State Report - July 2018
 
Haryana 04092012
Haryana 04092012Haryana 04092012
Haryana 04092012
 
West Bengal State Report - February 2019
West Bengal State Report - February 2019West Bengal State Report - February 2019
West Bengal State Report - February 2019
 
Bihar State Report - February 2019
Bihar State Report - February 2019Bihar State Report - February 2019
Bihar State Report - February 2019
 

Similar to Goa State Report - July 2018

Similar to Goa State Report - July 2018 (20)

Goa State Report October 2017
Goa State Report October 2017Goa State Report October 2017
Goa State Report October 2017
 
Goa july 2017
Goa   july 2017Goa   july 2017
Goa july 2017
 
Goa-04092012.ppt
Goa-04092012.pptGoa-04092012.ppt
Goa-04092012.ppt
 
West Bengal State Report - December 2018
West Bengal State Report - December 2018West Bengal State Report - December 2018
West Bengal State Report - December 2018
 
Punjab State Report - January 2019
Punjab State Report - January 2019Punjab State Report - January 2019
Punjab State Report - January 2019
 
West Bengal State Report - March 2019
West Bengal State Report - March 2019West Bengal State Report - March 2019
West Bengal State Report - March 2019
 
West Bengal State Report May 2018
West Bengal State Report May 2018West Bengal State Report May 2018
West Bengal State Report May 2018
 
West Bengal State Report - November 2018
West Bengal State Report - November 2018West Bengal State Report - November 2018
West Bengal State Report - November 2018
 
Gujarat State Report - December 2018
Gujarat State Report - December 2018Gujarat State Report - December 2018
Gujarat State Report - December 2018
 
Gujarat State Report May 2018
Gujarat State Report May 2018Gujarat State Report May 2018
Gujarat State Report May 2018
 
West bengal State Report November 2017
West bengal State Report November 2017West bengal State Report November 2017
West bengal State Report November 2017
 
Gujarat State Report - September 2018
Gujarat State Report - September 2018Gujarat State Report - September 2018
Gujarat State Report - September 2018
 
Gujarat State Report - August 2018
Gujarat State Report - August 2018Gujarat State Report - August 2018
Gujarat State Report - August 2018
 
Punjab State Report March 2018
Punjab State Report March 2018Punjab State Report March 2018
Punjab State Report March 2018
 
Gujarat State Report - March 2019
Gujarat State Report - March 2019Gujarat State Report - March 2019
Gujarat State Report - March 2019
 
West Bengal State Report September 2018
West Bengal State Report September 2018West Bengal State Report September 2018
West Bengal State Report September 2018
 
Nagaland State Report - April 2019
Nagaland State Report - April 2019Nagaland State Report - April 2019
Nagaland State Report - April 2019
 
Gujarat State Report - April 2019
Gujarat State Report - April 2019Gujarat State Report - April 2019
Gujarat State Report - April 2019
 
West Bengal State Report July 2017
West Bengal State Report July 2017West Bengal State Report July 2017
West Bengal State Report July 2017
 
Rajasthan State Report - January 2019
Rajasthan State Report - January 2019Rajasthan State Report - January 2019
Rajasthan State Report - January 2019
 

More from India Brand Equity Foundation

More from India Brand Equity Foundation (20)

Tamil Nadu State report - April 2019
Tamil Nadu State report - April 2019Tamil Nadu State report - April 2019
Tamil Nadu State report - April 2019
 
Steel Sector Report - April 2019
Steel Sector Report - April 2019Steel Sector Report - April 2019
Steel Sector Report - April 2019
 
Services Sector Report - April 2019
Services Sector Report - April 2019Services Sector Report - April 2019
Services Sector Report - April 2019
 
Real Estate Sector Report - April 2019
Real Estate Sector Report - April 2019Real Estate Sector Report - April 2019
Real Estate Sector Report - April 2019
 
Rajasthan State Report - April 2019
Rajasthan State Report - April 2019Rajasthan State Report - April 2019
Rajasthan State Report - April 2019
 
Railways Sector Report April 2019
Railways Sector Report April 2019Railways Sector Report April 2019
Railways Sector Report April 2019
 
Power Sector Report - April 2019
Power Sector Report - April 2019Power Sector Report - April 2019
Power Sector Report - April 2019
 
Meghalaya State Report April 2019
Meghalaya State Report April 2019Meghalaya State Report April 2019
Meghalaya State Report April 2019
 
Infrastructure Sector Report - April 2019
Infrastructure Sector Report - April 2019Infrastructure Sector Report - April 2019
Infrastructure Sector Report - April 2019
 
Media and Entertainment Sector report - April 2019
Media and Entertainment Sector report - April 2019Media and Entertainment Sector report - April 2019
Media and Entertainment Sector report - April 2019
 
Manufacturing Sector Report - April 2019
Manufacturing Sector Report - April 2019Manufacturing Sector Report - April 2019
Manufacturing Sector Report - April 2019
 
Manipur State Report - April 2019
Manipur State Report - April 2019Manipur State Report - April 2019
Manipur State Report - April 2019
 
Himachal Pradesh State Report - April 2019
Himachal Pradesh State Report - April 2019Himachal Pradesh State Report - April 2019
Himachal Pradesh State Report - April 2019
 
Gems and Jewellery Sector Report - April 2019
Gems and Jewellery Sector Report - April 2019Gems and Jewellery Sector Report - April 2019
Gems and Jewellery Sector Report - April 2019
 
Engineering and Capital Goods Sector Report - April 2019
Engineering and Capital Goods Sector Report - April 2019Engineering and Capital Goods Sector Report - April 2019
Engineering and Capital Goods Sector Report - April 2019
 
E Commerce Sector Report - April 2019
E Commerce Sector Report - April 2019E Commerce Sector Report - April 2019
E Commerce Sector Report - April 2019
 
Delhi State Report - April 2019
Delhi State Report - April 2019Delhi State Report - April 2019
Delhi State Report - April 2019
 
Chhattisgarh State Report - April 2019
Chhattisgarh State Report - April 2019Chhattisgarh State Report - April 2019
Chhattisgarh State Report - April 2019
 
Agriculture and Allied Industries Sector Report - April 2019
Agriculture and Allied Industries Sector Report - April 2019Agriculture and Allied Industries Sector Report - April 2019
Agriculture and Allied Industries Sector Report - April 2019
 
Aviation Sector Report - April 2019
Aviation Sector Report - April 2019Aviation Sector Report - April 2019
Aviation Sector Report - April 2019
 

Recently uploaded

NO1 Best kala jadu karne wale ka contact number kala jadu karne wale baba kal...
NO1 Best kala jadu karne wale ka contact number kala jadu karne wale baba kal...NO1 Best kala jadu karne wale ka contact number kala jadu karne wale baba kal...
NO1 Best kala jadu karne wale ka contact number kala jadu karne wale baba kal...
Amil baba
 
Zepto Case study(On Track to Profitability).pptx
Zepto Case study(On Track to Profitability).pptxZepto Case study(On Track to Profitability).pptx
Zepto Case study(On Track to Profitability).pptx
aryan963438
 
一比一原版(UCSD毕业证书)加利福尼亚大学圣迭戈分校毕业证成绩单学位证书
一比一原版(UCSD毕业证书)加利福尼亚大学圣迭戈分校毕业证成绩单学位证书一比一原版(UCSD毕业证书)加利福尼亚大学圣迭戈分校毕业证成绩单学位证书
一比一原版(UCSD毕业证书)加利福尼亚大学圣迭戈分校毕业证成绩单学位证书
atedyxc
 
一比一原版(Caltech毕业证书)加州理工学院毕业证成绩单学位证书
一比一原版(Caltech毕业证书)加州理工学院毕业证成绩单学位证书一比一原版(Caltech毕业证书)加州理工学院毕业证成绩单学位证书
一比一原版(Caltech毕业证书)加州理工学院毕业证成绩单学位证书
atedyxc
 
一比一原版(UCSB毕业证书)圣塔芭芭拉社区大学毕业证成绩单学位证书
一比一原版(UCSB毕业证书)圣塔芭芭拉社区大学毕业证成绩单学位证书一比一原版(UCSB毕业证书)圣塔芭芭拉社区大学毕业证成绩单学位证书
一比一原版(UCSB毕业证书)圣塔芭芭拉社区大学毕业证成绩单学位证书
atedyxc
 
一比一原版(UPenn毕业证书)宾夕法尼亚大学毕业证成绩单学位证书
一比一原版(UPenn毕业证书)宾夕法尼亚大学毕业证成绩单学位证书一比一原版(UPenn毕业证书)宾夕法尼亚大学毕业证成绩单学位证书
一比一原版(UPenn毕业证书)宾夕法尼亚大学毕业证成绩单学位证书
atedyxc
 
原版一模一样(bu文凭证书)美国贝翰文大学毕业证文凭证书制作
原版一模一样(bu文凭证书)美国贝翰文大学毕业证文凭证书制作原版一模一样(bu文凭证书)美国贝翰文大学毕业证文凭证书制作
原版一模一样(bu文凭证书)美国贝翰文大学毕业证文凭证书制作
uotyyd
 
ASSESSING HRM EFFECTIVENESS AND PERFORMANCE ENHANCEMENT MEASURES IN THE BANKI...
ASSESSING HRM EFFECTIVENESS AND PERFORMANCE ENHANCEMENT MEASURES IN THE BANKI...ASSESSING HRM EFFECTIVENESS AND PERFORMANCE ENHANCEMENT MEASURES IN THE BANKI...
ASSESSING HRM EFFECTIVENESS AND PERFORMANCE ENHANCEMENT MEASURES IN THE BANKI...
indexPub
 
Rapport annuel de Encevo Group pour l'année 2023
Rapport annuel de Encevo Group pour l'année 2023Rapport annuel de Encevo Group pour l'année 2023
Rapport annuel de Encevo Group pour l'année 2023
Paperjam_redaction
 
一比一原版(UMich毕业证书)密歇根大学安娜堡分校毕业证成绩单学位证书
一比一原版(UMich毕业证书)密歇根大学安娜堡分校毕业证成绩单学位证书一比一原版(UMich毕业证书)密歇根大学安娜堡分校毕业证成绩单学位证书
一比一原版(UMich毕业证书)密歇根大学安娜堡分校毕业证成绩单学位证书
atedyxc
 

Recently uploaded (20)

The Pfandbrief Roundtable 2024 - Covered Bonds
The Pfandbrief Roundtable 2024 - Covered BondsThe Pfandbrief Roundtable 2024 - Covered Bonds
The Pfandbrief Roundtable 2024 - Covered Bonds
 
NO1 Best kala jadu karne wale ka contact number kala jadu karne wale baba kal...
NO1 Best kala jadu karne wale ka contact number kala jadu karne wale baba kal...NO1 Best kala jadu karne wale ka contact number kala jadu karne wale baba kal...
NO1 Best kala jadu karne wale ka contact number kala jadu karne wale baba kal...
 
Zepto Case study(On Track to Profitability).pptx
Zepto Case study(On Track to Profitability).pptxZepto Case study(On Track to Profitability).pptx
Zepto Case study(On Track to Profitability).pptx
 
How do I sell my Pi Network currency in 2024?
How do I sell my Pi Network currency in 2024?How do I sell my Pi Network currency in 2024?
How do I sell my Pi Network currency in 2024?
 
Economic Risk Factor Update: May 2024 [SlideShare]
Economic Risk Factor Update: May 2024 [SlideShare]Economic Risk Factor Update: May 2024 [SlideShare]
Economic Risk Factor Update: May 2024 [SlideShare]
 
Retail sector trends for 2024 | European Business Review
Retail sector trends for 2024  | European Business ReviewRetail sector trends for 2024  | European Business Review
Retail sector trends for 2024 | European Business Review
 
Economics - Development 01 _ Handwritten Notes.pdf
Economics - Development 01 _ Handwritten Notes.pdfEconomics - Development 01 _ Handwritten Notes.pdf
Economics - Development 01 _ Handwritten Notes.pdf
 
一比一原版(UCSD毕业证书)加利福尼亚大学圣迭戈分校毕业证成绩单学位证书
一比一原版(UCSD毕业证书)加利福尼亚大学圣迭戈分校毕业证成绩单学位证书一比一原版(UCSD毕业证书)加利福尼亚大学圣迭戈分校毕业证成绩单学位证书
一比一原版(UCSD毕业证书)加利福尼亚大学圣迭戈分校毕业证成绩单学位证书
 
一比一原版(Caltech毕业证书)加州理工学院毕业证成绩单学位证书
一比一原版(Caltech毕业证书)加州理工学院毕业证成绩单学位证书一比一原版(Caltech毕业证书)加州理工学院毕业证成绩单学位证书
一比一原版(Caltech毕业证书)加州理工学院毕业证成绩单学位证书
 
Managing personal finances wisely for financial stability and
Managing personal finances wisely for financial stability  andManaging personal finances wisely for financial stability  and
Managing personal finances wisely for financial stability and
 
STRATEGIC MANAGEMENT VIETTEL TELECOM GROUP
STRATEGIC MANAGEMENT VIETTEL TELECOM GROUPSTRATEGIC MANAGEMENT VIETTEL TELECOM GROUP
STRATEGIC MANAGEMENT VIETTEL TELECOM GROUP
 
一比一原版(UCSB毕业证书)圣塔芭芭拉社区大学毕业证成绩单学位证书
一比一原版(UCSB毕业证书)圣塔芭芭拉社区大学毕业证成绩单学位证书一比一原版(UCSB毕业证书)圣塔芭芭拉社区大学毕业证成绩单学位证书
一比一原版(UCSB毕业证书)圣塔芭芭拉社区大学毕业证成绩单学位证书
 
1. Elemental Economics - Introduction to mining
1. Elemental Economics - Introduction to mining1. Elemental Economics - Introduction to mining
1. Elemental Economics - Introduction to mining
 
一比一原版(UPenn毕业证书)宾夕法尼亚大学毕业证成绩单学位证书
一比一原版(UPenn毕业证书)宾夕法尼亚大学毕业证成绩单学位证书一比一原版(UPenn毕业证书)宾夕法尼亚大学毕业证成绩单学位证书
一比一原版(UPenn毕业证书)宾夕法尼亚大学毕业证成绩单学位证书
 
原版一模一样(bu文凭证书)美国贝翰文大学毕业证文凭证书制作
原版一模一样(bu文凭证书)美国贝翰文大学毕业证文凭证书制作原版一模一样(bu文凭证书)美国贝翰文大学毕业证文凭证书制作
原版一模一样(bu文凭证书)美国贝翰文大学毕业证文凭证书制作
 
Big developments in Lesotho Butha-Buthe.
Big developments in Lesotho Butha-Buthe.Big developments in Lesotho Butha-Buthe.
Big developments in Lesotho Butha-Buthe.
 
Pitch-deck CopyFinancial and MemberForex.ppsx
Pitch-deck CopyFinancial and MemberForex.ppsxPitch-deck CopyFinancial and MemberForex.ppsx
Pitch-deck CopyFinancial and MemberForex.ppsx
 
ASSESSING HRM EFFECTIVENESS AND PERFORMANCE ENHANCEMENT MEASURES IN THE BANKI...
ASSESSING HRM EFFECTIVENESS AND PERFORMANCE ENHANCEMENT MEASURES IN THE BANKI...ASSESSING HRM EFFECTIVENESS AND PERFORMANCE ENHANCEMENT MEASURES IN THE BANKI...
ASSESSING HRM EFFECTIVENESS AND PERFORMANCE ENHANCEMENT MEASURES IN THE BANKI...
 
Rapport annuel de Encevo Group pour l'année 2023
Rapport annuel de Encevo Group pour l'année 2023Rapport annuel de Encevo Group pour l'année 2023
Rapport annuel de Encevo Group pour l'année 2023
 
一比一原版(UMich毕业证书)密歇根大学安娜堡分校毕业证成绩单学位证书
一比一原版(UMich毕业证书)密歇根大学安娜堡分校毕业证成绩单学位证书一比一原版(UMich毕业证书)密歇根大学安娜堡分校毕业证成绩单学位证书
一比一原版(UMich毕业证书)密歇根大学安娜堡分校毕业证成绩单学位证书
 

Goa State Report - July 2018

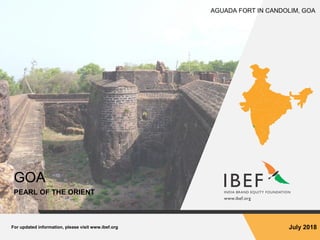
  • 1. For updated information, please visit www.ibef.org July 2018 GOA AGUADA FORT IN CANDOLIM, GOA PEARL OF THE ORIENT
  • 2. . Table of Content Executive Summary .…………….…….…....3 Introduction ……..………………………...….4 Economic Snapshot ……………….….…….9 Physical Infrastructure ………..……...........15 Industrial Infrastructure ……..……….........26 Key Sectors ………….………………..…...29 Key Procedures & Policies………………...34 Annexure.………….……..….......................43 Social Infrastructure …..……..……….........23
  • 3. For updated information, please visit www.ibef.orgGOA3 EXECUTIVE SUMMARY  Goa currently* has a total of 38 operational mining leases with a reported production of 6.08 million tonnes in 2017-18 (up to December 2017).  Exports of iron ore reached 17.64 million tonnes between September 2015 and November 2017.  Total Iron Ore1 traffic handled at Mormugoa Port, Goa in 2017-18P was 10.26 million tonnes. India’s major iron ore producer  During 2016-17, the total traffic handled by Mormugao port was recorded to be 33.18 million tonnes, registering a growth of 59.70 per cent over the previous year, which is the highest growth rate among 12 major ports of the country. The port handled 26.90 million tonnes of cargo in 2017-18.  The average output per ship berth day was recorded to be 12,042 million tonnes during the same period. Mormugao Port, reflected remarkable growth  Goa is one of the fastest growing states in the country. Goa’s gross state domestic product (GSDP) was Rs 645.44 billion (US$ 9.62 billion) in 2016-17. Strong economic growth  Goa is a popular tourist destination due to its natural beauty and bountiful avenues for leisure and relaxation. During 2017, Goa witnessed arrivals of 6,895,234 domestic tourists and 890,459 foreign tourists. Tourist paradise Source: Economic Survey of Goa, Indian ports Association, Goa Tourism Department Note: * during 2017-18 as per Goa Economic Survey 2017-18, 1 – Includes Pellets, P - Provisional
  • 5. For updated information, please visit www.ibef.orgGOA5 GOA FACT FILE Source: Census 2011  Goa is located in the western region of India. The state shares its border with the Arabian Sea to the west, Maharashtra to the north and Karnataka to the south and the east.  Languages spoken are Konkani, Marathi, Portuguese, Hindi and English.  Goa’s administrative headquarters are located at Panaji (the state capital) and Margao. The state has two districts: North Goa and South Goa.  Goa has a tropical climate, with a monsoons lasting from June to September. Due to its long coastline, the weather is hot and humid for the rest of the year. Parameters Arunachal Pradesh Capital Panaji Geographical area (sq km) 3,702 Administrative districts (No) 2 Population density (persons per sq km) 364 Total population (million) 1.46 Male population (million) 0.74 Female population (million) 0.72 Sex ratio (females per 1,000 males) 973 Literacy rate (%) 88.7
  • 6. For updated information, please visit www.ibef.orgGOA6 ADVANTAGE GOA High Economic Growth  The GSDP (in Rs) increased at a compound annual growth rate (CAGR) of 8.78 per cent between 2011-12 and 2016-17.  The state has one of the highest per capita GSDP in the country and stands at about US$ 6,345.94 in 2016-17. Facilitating infrastructure  Goa has a well-developed social, physical and industrial infrastructure, and virtual connectivity.  It has an international airport that is in line its ambition to be a globally recognised leisure destination. It also has significant port infrastructure. Rich labour pool  Goa’s high rate of literacy has attracted knowledge-based industries such as pharmaceuticals, biotechnology and IT.  A large proportion of the population can speak English, which helps boost the state’s tourism and ITeS industries. Strong presence in mining, tourism and pharmaceuticals  Abundant reserves of iron ore.  Established base for the pharmaceuticals industry and an emerging destination for knowledge-based industries such as biotechnology and IT.  High inflow of international tourists driving tourism revenue. Advantage Goa Source: Economic Survey of Goa 2017-18, Press Information Bureau
  • 7. For updated information, please visit www.ibef.orgGOA7 GOA IN FIGURES Parameter Goa India GSDP as a percentage of all states’ GSDP 0.42 100.0 GSDP growth rate (in Rs) (%) 18.92 10.8 Per capita GSDP (US$) 6,345.94 1,750.29 Goa‘s Contribution to Indian Economy (2016-17) Parameter Goa India Installed power capacity (MW) (May 2018) 549.41 343,898.39 Wireless subscribers (mn) (April 2018)1 94.80 1,125.07 Internet subscribers1 (mn) (March 2018) 39.51 493.96 National Highway length (km) 293 122,432 Major and minor ports (No) 1+5 13+187 Airports (No) 1 125 Physical Infrastructure in Goa Parameter Goa India Literacy rate (%) 88.7 73.0 Birth rate (per 1,000 population) 12.9 20.4 Social Indicators Parameter Goa India Completed and Operational PPP projects (No) 42 9,068 Industrial Infrastructure Parameter Goa India Cumulative FDI equity inflows (US$ billion) April 2000 – March 2018 0.967 376.97 Investments Note: GSDP, per capita GSDP figures are taken at current prices, exchange rate used is average of 2016-17 i.e. 67.09; 1Goa is included in Maharashtra circle Note: PPP: Public Private Partnership
  • 8. For updated information, please visit www.ibef.orgGOA8 STATE VISION Vision 2035 Value chains to success Preserve beauty and serenity Knowledge centric Governance  To depend on natural resources and related logistic industries, tourism and related services, healthcare & pharma industry, etc.  The state plans to be a knowledge-centric destination in the upcoming years.  The state plans to preserve its natural beauty at all costs  To ensure vibrant future for the habitats of the state.  The foundation of high quality governance should be fairness, accountability and transparency.  Goa plans to emerge as the most well-governed state in India.  Goa’s per capita GDP is twice that of India and the state aims to exceed that in the next 25 years.  In spite of its higher literacy rate, the state plans to move one step ahead.  To conserve Goa’s biodiversity, embrace responsible mining, develop tourism sites. Source: Goa Chamber of Commerce and Industry
  • 10. For updated information, please visit www.ibef.orgGOA10 ECONOMIC SNAPSHOT – GSDP  At current prices, Goa’s gross state domestic product (GSDP) was Rs 645.44 billion (US$ 9.62 billion) in 2016-17.  The GSDP (in Rs) increased at a compound annual growth rate (CAGR) of 8.78 per cent between 2011-12 and 2016-17. GSDP of Goa at current prices Source: Directorate of Economics and Statistics Goa 8.84 7.00 5.94 7.82 8.29 9.62 423.67 381.20 359.21 478.14 542.75 645.44 0 100 200 300 400 500 600 700 0 2 4 6 8 10 12 2011-12 2012-13 2013-14 2014-15 2015-16 2016-17 US$ billion Rs billion Note: exchange rates used are averages of each year GSDP per capita of Goa at current prices 6,031 4,746 3,998 5,230 5,509 6,346 289,192 258,441 241,893 319,827 360,634 425,749 0 50,000 100,000 150,000 200,000 250,000 300,000 350,000 400,000 450,000 - 1,000 2,000 3,000 4,000 5,000 6,000 7,000 2011-12 2012-13 2013-14 2014-15 2015-16 2016-17 US$ Rs  The state’s per capita GSDP was Rs 425,749 (US$ 6,346), one of the highest in India, during 2016-17.  Goa’s per capita GSDP (in Rs) increased at a CAGR of 8.04 per cent between 2011-12 and 2016-17. CAGR 8.04%CAGR 8.78%
  • 11. For updated information, please visit www.ibef.orgGOA11 ECONOMIC SNAPSHOT – NSDP  At current prices, Goa’s net state domestic product (NSDP) was Rs 587.71 billion (US$ 8.76 billion) in 2016-17.  The NSDP (in Rs) increased at a compound annual growth rate (CAGR) of 9.11 per cent between 2011-12 and 2016-17. NSDP of Goa at current prices CAGR 9.11% 7.93 6.35 5.30 7.07 7.52 8.76 380.09 345.67 320.43 432.33 492.22 587.71 0 100 200 300 400 500 600 700 0 1 2 3 4 5 6 7 8 9 10 2011-12 2012-13 2013-14 2014-15 2015-16 2016-17 US$ billion Rs billion Source: Directorate of Economics and Statistics Goa Note: exchange rates used are averages of each year NSDP per capita of Goa at current prices 5,411 4,304 3,567 4,729 4,996 5,778 259,444 234,354 215,776 289,185 327,059 387,668 0 50,000 100,000 150,000 200,000 250,000 300,000 350,000 400,000 450,000 0 1,000 2,000 3,000 4,000 5,000 6,000 7,000 2011-12 2012-13 2013-14 2014-15 2015-16 2016-17 US$ Rs  The state’s per capita NSDP was Rs 387,668 (US$ 5,778) in 2016-17.  Goa’s per capita NSDP (in Rs) increased at a CAGR of 8.36 per cent between 2011-12 and 2016-17. CAGR 8.36%
  • 12. For updated information, please visit www.ibef.orgGOA12 ECONOMIC SNAPSHOT – PERCENTAGE DISTRIBUTION OF GSVA  In 2016-17, the tertiary sectorµ accounted for 35.55 per cent of GSVA at current prices, secondary sector for 55.18 per cent and the primary sector contributing a share of 9.26 per cent.  At 11.67 per cent, the secondary sector had the highest growth among all three sectors between 2011-12 and 2016-17, followed by the tertiary sector (11.07 per cent).  Growth in the tertiary sector has largely been driven by the tourism industry, which facilitated growth of other related industries such as banking and financial services, real estate, and business services. Visakhapatnam port traffic (million tonnes)GSVA composition by sector 21.52% 9.26% 47.23% 55.18% 31.25% 35.55% 0% 10% 20% 30% 40% 50% 60% 70% 80% 90% 100% 2011-12 2016-17 Primary Sector Secondary Sector Tertiary Sector -8.55% 11.07% 11.67% CAGR Source: Directorate of Economics and Statistics Goa
  • 13. For updated information, please visit www.ibef.orgGOA13 ECONOMIC SNAPSHOT – FDI INFLOWS & INVESTMENTS  According to the Department of Industrial Policy & Promotion (DIPP), FDI inflow into the state of Goa, between April 2000 and March 2018 was US$ 967 million.  In 2017 - 2018, the number of investments filed were 4 and the amount of investments proposed were Rs 141 crore (US$ 21.88 million) Source: Department of Industrial Policy & Promotion Investment intentions in terms of IEMs filed Year Number Proposed investments (US$ million) 2016 13 186.35 2017 12 20.48 2018 4 21.88 Visakhapatnam port traffic (million tonnes)FDI Inflows to Goa (US$ million) 302 38 9 17 35 18 83 43 724 762 771 788 823 841 924 967 200 400 600 800 1,000 1,200 1,400 FY11 FY12 FY13 FY14 FY15 FY16 FY17 FY18 Annual FDI Inflow Cumulative from April 2000
  • 14. For updated information, please visit www.ibef.orgGOA14 ECONOMIC SNAPSHOT – EXPORTS Source: Ministry of Mines, Mormugao Port Trust Goa, Goa Economic Survey 2017-18 Commodities Loaded at Mormugao Port (Metric Tonnes) Visakhapatnam port traffic (million tonnes)Export of Marine Products (US$ million) Visakhapatnam port traffic (million tonnes)Iron ore exports from Mormugao Port Trust (‘000 tonnes) 50.87 58.23 63.24 78.62 79.47 91.61 95.70 0.00 20.00 40.00 60.00 80.00 100.00 120.00 2011 2012 2013 2014 2015 2016 2017 604 3,570 15,053 10,259 0 5,000 10,000 15,000 20,000 2014-15 2015-16 2016-17 2017-18 Commodities 2014-15 2015-16 2016-17 2017-18 Total Ores 871,398 3,779,608 14,722,851 9,925,112 Calcined Allumina 21,000 21,000 47,150 30,468 Container Cargo 144,423 108,286 131,999 127,903 Granite 302,627 313,140 290,322 170,135 H.R. Steel Coils 1,625,094 841,166 1,820,700 1,551,369 Iron and Steel 62,571 0 140,908 353,580 Pig Iron 263,699 306,624 140,350 248,371 Petroleum, Oil and Lube 0 2,166 0 4,164 Petroleum, Oil and Lube 0 2,166 0 4,164
  • 16. For updated information, please visit www.ibef.orgGOA16 PHYSICAL INFRASTRUCTURE – ROADS  NH-17 runs along India's West Coast & links Goa to Mumbai in the north & Mangalore to the south. NH-4A running across the state connects Panaji to Belgaum (Karnataka) in the east. As of February 2018, Goa had 293 km of national highways.  The state had a road density of 68.7 km per 1,000 sq. km of area, as of December 2016.  As per state’s Economic Survey, following road works were under taken in the state during 2017-18: • Major district road works were completed with a cost of Rs 12.78 crore (US$ 1.98 million). • Rural road works were completed with a cost of Rs 68.21 crore (US$ 10.58 million). • Central road works were completed with a cost of Rs 39.17 crore (US$ 6.10 million). Road type Road length (km) National highways (As of February 2018) 293 State highways 232 District highways 815 Source: Directorate of Transport PWD: Public Works Department, State Budget 2017-18 Note: Data is as per latest available information, exchange rate used is average of 2017-18 i.e. 64.45
  • 17. For updated information, please visit www.ibef.orgGOA17  The total railway route in Goa is comprising of two rail tracks: the Konkan Railways line that runs from the north to south & the South- Western Railways line that runs from west to east. These routes connect the state to other parts of the country. These routs are around 167 km long, and crosses the most important junction of the state, the Madgaon railway station. Vasco Da Gama is the next important railway station in the state.  Konkan Railways, which connects Mumbai, Goa & Mangalore, has considerably boosted tourism. The Mormugao port is connected through a broad gauge line.  An amount of US$ 14.87 million has been allocated under 2017-18 budget towards Konkan Railways. 4 railway overbridges are to be built in Goa with financial support from the Rail Ministry. The government has pulled off a new double-decker luxury train service on Konkan Railways route that commutes tourists from Mumbai to Goa.  On May 22, 2017, state-of-the-art, high-speed, 15 coach train Tejas Express, with a speed of 200 km/hour, made its debut. The train would run between Mumbai to North Goa, covering a distance of 579 km in 8.5 hours. The train has 2 classes — executive chair car & chair car, and is equipped with facilities like automatic doors, secured gangways, Wi-Fi, LCD screens, magazines, tea-coffee vending machines, bio-toilets, etc. PHYSICAL INFRASTRUCTURE – RAILWAYS Source: Maps of India
  • 18. For updated information, please visit www.ibef.orgGOA18 PHYSICAL INFRASTRUCTURE – AIRPORTS Goa Airport Passenger Traffic (million) Goa Airport Aircraft Movement Source: Airports Authority of India Freight handled by Goa airport (Metric Tonnes) 2013-14 2016-17 2017-18 2018-19* 4,767 4,103 4,372 269 24,326 24,018 27,430 26,804 28,904 33,422 39,030 47,801 50,567 4,351 0 10,000 20,000 30,000 40,000 50,000 60,000 2009-10 2010-11 2011-12 2012-13 2013-14 2014-15 2015-16 2016-17 2017-18 2018-19* 2.63 3.08 3.52 3.54 3.89 4.51 5.37 6.86 7.61 0.66 0 1 2 3 4 5 6 7 8 2009-10 2010-11 2011-12 2012-13 2013-14 2014-15 2015-16 2016-17 2017-18 2018-19*  Passenger footfalls at the Goa airport during 2017-18 reached 7,607,249 with aircraft movement reaching 50,567 flights.  Freight handled at Goa airport during 2017-18 was 4,372 MT.  Goa has one airport at Dabolim, which functions as a domestic as well as an international airport. The state is connected to most Indian cities by air.  The state ranks among the top 10 in all-India air traffic, most of which is tourism related.  The state has good connectivity in terms of international flights, including chartered flights from European countries. Note: For April 2018
  • 19. For updated information, please visit www.ibef.orgGOA19 PHYSICAL INFRASTRUCTURE – PORTS  Goa has 255 km of rivers & canals, providing an economical mode for goods transport. The Mormugao harbour, a multi-purpose general cargo berth situated in the port town of Vasco-da-Gama, handles local & international maritime cargo traffic.  The River Navigation Department was established to provide safe, dependable & affordable transport facilities on different ferry routes of Goa’s inland waters.  During 2017-18, cargo traffic handled at the port was recorded to be 26.90 million tonnes. In April-May 2018 the port handled 4.35 million tonnes of traffic. Major ports  Mormugao Minor ports  Panaji  Chapora  Betul  Talpona  Tiracol Commodity-wise Traffic Handled at Mormugao Port during 2017-18P Commodity Quantity (metric tonnes) POL (Petroleum, Oil & Lubricants) 629,000 Other Liquids 572,000 Iron ore 10,259,000 Thermal & Steam 1,999,000 Coking & others 8,514,000 Container tonnage 425,000 Container TEUs 32,000 Other Misc. Cargo 4,317,000 Source: Ministry of Shipping, Government of India, Indian Ports Association, Mormugao Port Trust Ports Note: P – Provisional
  • 20. For updated information, please visit www.ibef.orgGOA20 PHYSICAL INFRASTRUCTURE – POWER  The Electricity Department of Goa was created as a Government Department in the year 1963. The Electricity Department is the only licensee in the state of Goa for transmission and distribution of Electrical Energy. As of April 2018, Goa had a total installed power generation capacity of 549.41 MW.  Of the total installed capacity, 500.45 MW was managed by central utilities, 48.91 MW by private utilities and 0.05 MW by state utilities.. Thermal power plants accounted for a significant share in the total installed capacity with 522.45 MW, whereas nuclear energy and renewable energy contributed 26 MW and 0.96 MW respectively.  The state generates power from its 48 MW naphtha-based plant of Reliance Infrastructure Limited and it depends, largely, on the power allocated from the central generating stations.  The industrial sector is the largest consumer of electricity, followed by the domestic sector. Goa Electricity Department controls power infrastructure in the state. Visakhapatnam port traffic (million tonnes)Installed power capacity (MW) Source: Central Electricity Authority, State Budget 2016-17 Economic Survey of Goa, 2014-15 357.20 380.90 386.90 400.20 430.02 400.02 400.02 412.45 540.56 549.41 549.41 0.00 100.00 200.00 300.00 400.00 500.00 600.00 2008-09 2009-10 2010-11 2011-12 2012-13 2013-14 2014-15 2015-16 2016-17 2017-18 2018-19* Note: * - 2018-19 (Up tp May 2018)
  • 21. For updated information, please visit www.ibef.orgGOA21 PHYSICAL INFRASTRUCTURE – TELECOM  Goa is among the few states in the country to have 100 per cent automatic telephone systems with a good network of telephone exchanges.  Goa has a fibre-optic cable network spread through the state; it provides high-speed access for a wide range of internet-related services. All the gram panchayats in the state of Goa are connected with optical fiber.  As of April 2018, Goa(1) has 94.80 million wireless subscribers and 1.71 million wireline subscribers. Moreover, the tele-density stood at 108.46 per cent1, as of April 2018.  In December 2016, the Government of Goa announced the launch of Goa Yuva Sanchar Yojna, under which the state would be providing 100 minutes of free talk time and 3 GB of internet data every month, free with a new SIM card. Source: Economic Survey of Goa, Telecom Regulatory Authority of India Wireless subscribers(1) 94,795,487 Wireline subscribers(1) 1,705,903 Internet subscribers (million)(1)(2) 39.51 Tele-density(1) 108.46 Telecom Infrastructure – April 2018 Some of the major telecom service providers  Bharat Sanchar Nigam Limited (BSNL)  Tata Indicom  Bharti Airtel  Aircel Limited  Reliance Communications Note: 1Denotes Maharashtra including Goa, 2As of March 2018
  • 22. For updated information, please visit www.ibef.orgGOA22 PHYSICAL INFRASTRUCTURE - URBAN DEVELOPMENT  Panaji is one of the 65 cities identified under the Jawaharlal Nehru National Urban Renewal Mission (JNNURM). Two projects costing around US$ 15.6 million have been sanctioned for Panaji.  As per budget 2017-18, US$ 81.81 million would be allocated for Panaji under the Smart City mission, 5 major cities to be connected with tourist places with frequent plying of KTC with a budget of US$22.31 million. All street lights would be converted to LED lights by December 2017, a 2nd solid waste treatment plant to be built at Cacora in South Goa, an amount of US$ 17.25 million has been allocated for garbage management.  Under AMRUT (Atal Mission for Rejuvenation & Urban Transformation) scheme by the Government of India, the city of Panaji has been selected from the state of Goa. Source: JNNURM, Ministry of Urban Development, Public Works Department of Goa SJSRY – Swarna Jayanti Shahari Rozgar Yojana NULM – National Urban Livelihoods Mission Funds allocated to Goa under SJSRY and NULM (US$ million) 0.23 0.37 0.14 0.51 0.13 0.2 0 0.1 0.2 0.3 0.4 0.5 0.6 2012-13 2013-14 2014-15 2015-16 2016-17 2017-18 Water supply  Water supply in Goa’s urban and rural areas is 143 and 82 litres per capita per day (LPCD), respectively.  Goa’s water tariffs are among the cheapest in the country.  The state has proposed an investment outlay of US$ 160.1 million for water supply and sanitation projects in its 12th Five-Year Plan (2012-17). Area Based Development Service improvement for urban poor in Mala Fontainhas area, Integrated Urban Water Management, Church Square Revitalization, Provision of basic services in entire area (2 sq km), etc Smart Transportation and Eco Mobility Digital Enabled System for Public Bike Share System, Air Quality monitoring stations, Smart Parking, Smart Component for buses (GPS, automated fare collection etc.), etc Smart Environmental Services Trolley Bins with RFID tags, Biometric Attendance in 12 Zonal Offices, CCTV Surveillance of black spots, etc Smart City Proposal: List of projects in Panaji
  • 24. For updated information, please visit www.ibef.orgGOA24 SOCIAL INFRASTRUCTURE – EDUCATION  Goa has a number of leading engineering, business management, medical and legal institutes. The Maritime School, under the Captain of Ports Department, Government of Goa, is among the first of its kind in the country.  Goa College of Pharmacy, set up in 1842, is one of the oldest institutes in India. It offers bachelor’s, master’s & diploma courses in pharmacy. The institute has 60 seats for bachelor's degree, 60 seats for diploma & 36 seats for master’s degree in various fields of pharmacy.  The state has a literacy rate of 88.7 per cent according to the data of Census 2011; the male literacy rate is 92.65 per cent & the female literacy rate is 84.66 per cent. During 2017-18, the total enrolments in schools were recorded to be 239,834.  As per State Budget 2018-19, Goa Government has allocated Rs 18.91 billion (US$ 293.55 million) to the Education sector. As per state budget 2017-18, the Government of Goa has proposed to allocate US$ 6.24 million as financial assistance for Goa University, Source: Educational Statistics at a Glance 2017-18, Government of Goa Primary schools 1,157 Middle schools 64 Secondary schools 408 Higher secondary schools 200 Primary level and Middle level teacher – pupil ratio 1:24 Secondary level and Higher secondary level teacher – pupil ratio 1:21 Educational Statistics, 2016-17 Total 88.70 Male 92.65 Female 84.66 Literacy rate (%)  Shree Rayeshwar Institute of Engineering and Information Technology  Padre Conceicao College of Engineering  National Institute of Oceanography  Parvatibai Chowgule College of Arts & Science  Don Bosco College  St. Xavier’s College  BITS Pilani Goa campus Some of the higher education institutions
  • 25. For updated information, please visit www.ibef.orgGOA25 SOCIAL INFRASTRUCTURE – HEALTH  Goa has some very renowned hospitals including Apollo Victor Hospital in Margao, Manipal Hospital in Panaji & Vrundavan Shalby Hospital in Mapusa. As of May 2018, the number of primary health centres & sub centres in Goa were recorded to be 48 and 218, respectively.  Further, the state government has also made a provision of US$ 2.43 million for buildings, US$ 0.18 million for books & periodicals & US$ 0.70 million for various equipment for Goa Medical College.  As per Budget 2018-19, State Government has allocated Rs 521.27 crore (US$ 80.88 million) to the Health Services sector. A provision of US$ 0.12 million has also been made for supplies and materials & US$ 3.10 million is allocated for the completion of the 2nd phase of the building of Goa Dental College.  The state government announced ban on use of plastic bags effective from July 2017. Manufacturing, selling and carrying plastic bags would lead to imposition of a fine of up to US$ 74.37. Source: Goa Economy in Figures - 2015, Economic Survey of Goa, 2014-15 1Per thousand persons, 2Per thousand live births PHC# -Primary Health Centre, State Budget 2016-17, 2017-18 2018-19 Primary health centres 48 Sub centers 218 Community health centres 10 Active district hospitals 3 Active sub-district hospitals 2 Health infrastructure (as of May 2018) Birth rate 1 12.9 Death rate 1 6.7 Infant mortality rate 2 8 Health indicators (September 2017)
  • 27. For updated information, please visit www.ibef.orgGOA27 INDUSTRIAL INFRASTRUCTURE Industry clusters Industries Verna Rubber, plastics, petroleum products, pharmaceuticals, electronics and telecommunication equipment. Bicholim Engineering, oil products, plastics, leather, textiles, food processing, soaps and agro products. Kundaim Rubber, plastics, petroleum products, pharmaceuticals, steel fabrications and aluminum furniture. Margao Printing, plastics, herbal hair oils, cosmetics, ice blocks, engineering items and industrial diamond tools. Mormugao Shipbuilding and repair. Corlim Metal works, engineering, cold storage, food processing, electronic products, paper products, chemicals, paints and varnishes. Vasco Shipbuilding and repair.  Goa Industrial Development Corporation (Goa-IDC) is the nodal agency established for setting up of industrial estates & offering developed plots to industrial units in the state.  Goa-IDC has established 20 industrial estates, spread across the state’s talukas & is currently working on the expansion of existing industrial estates as well as establishing new ones.  7 ITIs (industrial training institutes) in the state of Goa are covered under the World Bank Assisted Vocational Training Improvement Project (VTIP) while 1 ITI in the state has been taken up by the central government for upgradation through public private partnership. Source: Goa Industrial Development Corporation
  • 28. For updated information, please visit www.ibef.orgGOA28 SEZ AND INDUSTRIAL ESTATES  As of December 2017, Goa had seven formally approved and three notified special economic zones (SEZs). However, there are no operational SEZs in the state and no in-principle approved SEZ.  On completion, the SEZs would primarily cover knowledge-based industries such as biotechnology and IT/ITeS. The Goa Industrial Development Corporation (Goa-IDC) assists in establishing industries in specific industrial areas and estates. Goa-IDC has established 20 industrial estates in various talukas of Goa. It plans to expand eight of these existing units and establish another five industrial estates.  The Government is committed to make Goa an aspirational investment destination for best-in-class manufacturing, tourism, entertainment and other service industries, including research and knowledge-based industries. Accordingly, the Government has set an ambitious target of creating 50,000 jobs by 2019, facilitating new investments of around US$ 4.2 billion in the state during 2014-19. Sector-wise formally approved SEZs Sector Developer Number of SEZs Area (Hectares) IT/ITeS K. Raheja Corp Pvt. Ltd. 1 105.91 Biotechnology Peninsula Pharma Research Centre Pvt Ltd 1 20.37 Pharmaceuticals Meditab Specialities Pvt Ltd 1 123.20 IT/ITeS Paradigm Logistics and Distribution Pvt Ltd 1 40.25 Gems and Jewellery Planet Mercantile Company 1 13.28 Biotechnology Inox Mercantile company 1 48.48 IT Panchbhoomi Infrastructure 1 18.5 Source: Ministry of Commerce & Industry, Department of Commerce, Goa Industrial Development Corporation, Economic Survey of Goa
  • 29. GOA KEY SECTORS  Mining  Tourism and Hospitality  Fishing
  • 30. For updated information, please visit www.ibef.orgGOA30 KEY SECTORS – MINING… (1/2)  The mining belt of Goa covers an area of approximately 700 sq km & is mostly concentrated in the 4 talukas of Bicholim, Salcete, Sanguem & Quepem.  The iron ore in Goa is export oriented with average annual export from Goa at around 30 million tonnes. Value of minerals produced (excluding fuel minerals) in Goa in 2017-18 (up to January 2018) reached Rs 620.55 crore US$ 96.29 million.  Most mines in Goa are of open-cast type, which necessitates the removal of over burden overlying the iron ore formations. During 2015-16, the state government created a separate District Mineral Foundation under the MMDR Act, 1957, as per which the state’s mining firms need to deposit an additional amount of 30 per cent of the royalty paid to this fund.  Under State Budget 2018-19, Rs 22.77 crore (US$ 3.53 million) was allocated to the mining sector. Source: Ministry of Mines, Government of India Mineral Reserves (In ‘000 tonnes) Iron ore-hematite 6,42,113 Iron ore-magnetite 2,15,557 Manganese 23,271 Bauxite 53,072 Quartz/silica sand 20,004 Goa mineral reserves* Note: * - As per latest available data
  • 31. For updated information, please visit www.ibef.orgGOA31 KEY SECTORS – MINING… (2/2)  Formaly known as Sesa Goa, is one of the world's largest global diversified natural resource majors, with operations across zinc-lead-silver, oil & gas, iron ore, copper, aluminium and commercial power.  Vedanta has large iron ore mines in Goa and Karnataka and a pig iron plant in Goa. The mining operations are carried out at the Codli group and the Sonshi group of mines in Goa.Vedanta Limited
  • 32. For updated information, please visit www.ibef.orgGOA32 KEY SECTORS – TOURISM AND HOSPITALITY  Innovative marketing strategies to project Goa as an all-time leisure destination have resulted in higher tourist inflows over the years. With the continuous in-flow of tourists, Russian & European tourists, in collaboration with locals from Arambol to Patnem, have started offering yoga training classes to people.  During 2017, Goa witnessed arrivals of 6,895,234 domestic tourists and 890,459 foreign tourists. E – visa facility issued at Dabolim airport, Goa from January 2017 – December 2017 was 133,798.  During 2017-18 (up to October 2017), the hotel rooms available in the state increased by 7.93 per cent year-on-year.  For the year 2018-19, the state government had made an allocation of Rs 219.53 crore (US$ 34.06 million) to the tourism sector. Source: Department of Tourism, Government of Goa, Economic Survey of Goa, 2014-15 Visakhapatnam port traffic (million tonnes)Tourist arrivals in Goa (in million) 2.21 2.02 2.13 2.2 2.22 2.33 2.62 3.54 4.76 5.65 6.90 0.39 0.35 0.38 0.44 0.45 0.45 0.49 0.51 0.54 0.68 0.89 0 1 2 3 4 5 6 7 8 9 2007 2008 2009 2010 2011 2012 2013 2014 2015 2016 2017 Domestic Foreign
  • 33. For updated information, please visit www.ibef.orgGOA33 KEY SECTORS– FISHERIES  Goa has a coastline of about 104 kms and inland waterways of about 250 km. The coast is full of creeks and estuaries formed by rivers; 144.28 thousand tonnes of marine fish and 5.33 thousand tonnes of inland fish were harvested in 2017.  As per budget 2018-19, Fisheries has been allotted an annual fund of Rs 6,900 crore (US$ 10.71 million).  Marine fish production in the state in 2017 was 120,430 tonnes while inland fish production was 5,332 tonnes. Annual fish catch (‘000 tonnes) Source: Economic Survey of Goa, 2017-18 State Budget 2016-17 91.1 88.7 80.6 87.0 86.1 86.6 87.9 128.1 105.7 101.1 144.3 2.4 3.0 3.2 3.3 3.5 3.8 4.6 3.7 4.6 4.4 5.3 0.0 1.0 2.0 3.0 4.0 5.0 6.0 0.0 50.0 100.0 150.0 200.0 2007 2008 2009 2010 2011 2012 2013 2014 2015 2016 2017 Marine (LHS) Inland (RHS) Marine Fish Production in Goa (‘000 tonnes) Source: Department of Animal Husbandry, Dairying and Fisheries,, Ministry of Agriculture, Government of India, State Budget 2018-19 Note: 2016-17(P) – provisional, Conversion rate = 64.45 86.60 88.00 128.10 108.20 101.10 120.40 0.00 20.00 40.00 60.00 80.00 100.00 120.00 140.00 2012 2013 2014 2015 2016 2017
  • 35. For updated information, please visit www.ibef.orgGOA35 KEY INVESTMENT PROMOTION OFFICES Agency Description Goa Industrial Development Corporation (Goa-IDC)  It has been established with the purpose of securing land and assisting in fast and orderly establishment of industries in the 20 designated industrial areas and estates. Economic Development Corporation  This is a state Government-promoted financial institution to operate and manage government-promoted financial schemes.  It acts as an investment company and provides financial assistance to entrepreneurs for starting as well as expanding business units. The Goa State Infrastructure Development Corporation  This was set up as a Special Purpose Vehicle (SPV), with the basic aim to develop infrastructure in a time- bound manner. Goa Handicrafts Rural and Small Scale Industries Development Corporation  It promotes traditional arts and crafts, fashioned by the state’s artists and artisans.  It performs functions related to procurement and distribution of indigenous and imported raw material, especially for small scale units.  It has been instrumental in starting the ‘Deen Dayal Swayamrojgar Yojana’, a scheme to develop self- employment opportunities for the youth. Goa Tourism Development Corporation  It promotes tourism and related activities in Goa.  It focuses on developing eco-tourism, heritage tourism, adventure tourism, medical tourism and event tourism. Goa Horticulture Corporation  It promotes investments in export-oriented projects, especially for the cultivation of exotic fruits and vegetables, floriculture, etc.  It is entrusted with the development of horticulture estates and establishment of sales outlets for local produce through establishments called ‘Krishi Ghars’. Info Tech Corporation of Goa Ltd (ITG)  It looks after the development of IT-related infrastructure, ITeS and implementation of the government’s e-governance objectives.
  • 36. For updated information, please visit www.ibef.orgGOA36 CONTACT LIST Udyog Bhavan, Panaji- 403 001 Goa Phone: 91-832-2226377 Website: http://www.goaditc.gov.in/ Directorate of Industries, Trade and Commerce Narayan Rajaram Bandekar Bhavan, T.B Cunha Road, P.O. Box 59, Panaji - 403 001 Phone: 91-832-2424252 E-mail: goachamber@goachamber.org Website: http://www.goachamber.org/ Goa Chamber of Commerce & Industry
  • 37. For updated information, please visit www.ibef.orgGOA37 KEY APPROVALS REQUIRED Approvals and clearances required Departments to be consulted Estimated time in days Incorporation of company Registrar of Companies N.A. Registration, Industrial Entrepreneurs Memorandum (IEM), Industrial Licences High Powered Coordination Committee (HPCC) for large and medium-sized projects, Director of Industries, Trade and Commerce for small and micro projects N.A. Allotment of land Goa-IDC 8 to 15 Permission for land use Goa-IDC 8 to 15 Site environmental approval Goa State Pollution Control Board and Ministry of Environment and Forests 60 No objection certificate and consent under Water and Pollution Control Acts Goa State Pollution Control Board 7 to 14 Approval of construction activity and building plan Town and Country Planning Authority 30 Sanction of power State Electricity Department Up to 60 Registration under the State Sales Tax Act and Central and Excise Act Sales Tax Department and Central and State Excise Department N.A. N.A. – Not Available
  • 38. For updated information, please visit www.ibef.orgGOA38 APPROVAL PROCESS … (1/2)  The Goa Industrial Policy 2003 has revamped the single-window clearance mechanism in the state.  HPCC, chaired by Goa’s Chief Minister, has been appointed responsible for dealing with large projects. Members of the committee include senior- most officers of concerned state departments.  The Director of Industries, Trade and Commerce handles small scale industries. The Goa-IDC and the District Industries Centre act as nodal agencies for various projects in the state. Goa-IDC handles the creation of SEZs in the state. Greater than US$ 1.09 million HPCC Department of Industries, Trade and Commerce Director of Industries, Trade and Commerce The Chief Minister District Industries Centre Goa Industrial Development Corporation (Goa-IDC) Nodal agency Under the Chairmanship ofInvestment handled Below US$ 1.09 million
  • 39. For updated information, please visit www.ibef.orgGOA39 APPROVAL PROCESS … (2/2)  Goa Investment Policy 2013, which laid a special thrust on development of Special Investment Regions, aims to kick start investment in Goan economy.  This policy aims to articulate various initiatives being undertaken to make Goa a preferred and aspirational investment destination.  It aims to create an institutional framework for facilitating investments in the thrust areas as well as other areas decided upon by the Investment Promotion Board (IPB)/Government of Goa on an ongoing basis. Evaluation and recommendation by satellite expert consultant IPB decision on investment proposal along with all approving authorities Check on land availability in industrial estates Process for industrial set up in Goa 15 days Rejection IPB approval Detailed templatised proposal submitted to IPB Land not available Land earmarked 30 days Evaluation and recommendation by satellite consultant Nodal officer approval who would assist with all approvals Approval Rejection Receipt of all clearances for unit to establish facility and start operations 30 days30 days30 days Preliminary Project Report submitted to IPB
  • 40. For updated information, please visit www.ibef.orgGOA40 COST OF DOING BUSINESS IN GOA Cost parameter Cost estimate Industrial land (per sq ft) US$ 10–50 Office space rentals (per sq ft per month) US 60 cents to US$ 2 Residential rentals (for a 2,000 sq ft house per month) US$ 800–1,300 Five-star hotel room (per night) US$ 160–800 Power cost (per kWh) Industrial: US 4.7–7.3 cents Labour cost (minimum wage per day) US$ 3.9–5.5 Source: Industry sources, Goa-IDC, Ministry of Labour and Employment, Government of India, Electricity Department, Government of Goa
  • 41. For updated information, please visit www.ibef.orgGOA41 STATE ACTS & POLICIES … (1/2)  The government has notified the Goa Start-up Policy 2017 with the following objectives: • Make Goa a hub of high value start-ups. • Attract entrepreneurial talent to the state and build a robust start-up eco-system in Goa • Provide assistance to local entrepreneurs and start-ups • Create at least 100 successful start-ups in the next five years  The Government of Goa has introduced the new Goa Investment Policy 2014 in order to boost investor confidence and attract new industries to Goa.  Main objectives of the new policy include: making Goa an aspirational investment destination by making business a pleasure, for best in class manufacturing, knowledge-based, tourism, entertainment and other service industries, while improving the environmental and social indicators of the state.  The state Government is working on the new tourism policy with a vision of overall tourism development and to engage with private players to invest and develop infrastructure in the state.
  • 42. For updated information, please visit www.ibef.orgGOA42 STATE ACTS & POLICIES … (2/2) Objectives IT Policy 2015  To make state of Goa most preferred destination for investors there by making IT/ITeS/ESDM a vibrant industry leading to inclusive growth and employment generation. Mining Lease Policy, 2014  The state Government can directly auction the leases in order to secure the best returns for the grant of leases by way of a competitive bidding process. Goa Investment Policy 2014  Creating 50,000 jobs and investing US$ 4.2 billion in new projects in the next five years.  Providing 24x7 high-quality power supply and logistics infrastructure to industries. Biotech Policy 2006  To ensure accelerated growth in all areas of the biotechnology sector such as education, research and economic sectors covering healthcare, agriculture, industry, services, environment management and employment generation. Objectives of the policy include prioritisation of the thrust areas for basic and applied research and technology development, and promotion of innovations in R&D by providing financial and infrastructural support. Goa Special Economic Zone Policy 2006  To augment infrastructure facilities to boost exports. Industrial Policy 2003  To ensure accelerated industrial development, catalyse economic growth and balanced regional growth, protect the environment and create sustainable employment for local youth of the state.  Key areas identified are pharmaceuticals, drugs and biotechnology, food processing, agro-based, IT and IT- enabled services, eco-tourism/heritage tourism/adventure tourism/event tourism/medical tourism and entertainment industries. Read more Read more Read more Read more Read more Read more
  • 44. For updated information, please visit www.ibef.orgGOA44 ANNEXURE…(1/2)- SOURCES Data Sources GSDP (state) MOSPI, Directorate of Economics and Statistics, Goa Per capita GSDP figures MOSPI, Directorate of Economics and Statistics, Goa GSDP (India) MOSPI, Directorate of Economics and Statistics, Goa Installed power capacity (MW) Central Electricity Authority, as of April 2018 Wireless subscribers (No) Telecom Regulatory Authority of India, as of February 2018 Internet subscribers (Mn) Telecom Regulatory Authority of India, as of December 2017 National highway length (km) NHAI & Roads and Building Department, as of February 2018 Number of Ports India Ports Association Airports (No) Airports Authority of India Literacy rate (%) Census 2011 Birth rate (per 1,000 population) SRS Bulletin, September 2017 Cumulative FDI equity inflows (US$ billion) Department of Industrial Policy & Promotion, From April 2000 to December 2017 Operational PPP projects (No) DEA, Ministry of Finance, Government of India, February 2018
  • 45. For updated information, please visit www.ibef.orgGOA45 ANNEXURE…(2/2) - EXCHANGE RATES Exchange Rates (Fiscal Year) Exchange Rates (Calendar Year) Year INR INR Equivalent of one US$ 2004–05 44.95 2005–06 44.28 2006–07 45.29 2007–08 40.24 2008–09 45.91 2009–10 47.42 2010–11 45.58 2011–12 47.95 2012–13 54.45 2013–14 60.50 2014-15 61.15 2015-16 65.46 2016-17 67.09 2017-18 64.45 Q1 2018-19 67.04 Year INR Equivalent of one US$ 2005 44.11 2006 45.33 2007 41.29 2008 43.42 2009 48.35 2010 45.74 2011 46.67 2012 53.49 2013 58.63 2014 61.03 2015 64.15 2016 67.21 2017 65.12 Source: Reserve Bank of India, Average for the year
  • 46. For updated information, please visit www.ibef.orgGOA46 DISCLAIMER India Brand Equity Foundation (IBEF) engaged Aranca to prepare this presentation and the same has been prepared by Aranca in consultation with IBEF. All rights reserved. All copyright in this presentation and related works is solely and exclusively owned by IBEF. The same may not be reproduced, wholly or in part in any material form (including photocopying or storing it in any medium by electronic means and whether or not transiently or incidentally to some other use of this presentation), modified or in any manner communicated to any third party except with the written approval of IBEF. This presentation is for information purposes only. While due care has been taken during the compilation of this presentation to ensure that the information is accurate to the best of Aranca and IBEF’s knowledge and belief, the content is not to be construed in any manner whatsoever as a substitute for professional advice. Aranca and IBEF neither recommend nor endorse any specific products or services that may have been mentioned in this presentation and nor do they assume any liability or responsibility for the outcome of decisions taken as a result of any reliance placed on this presentation. Neither Aranca nor IBEF shall be liable for any direct or indirect damages that may arise due to any act or omission on the part of the user due to any reliance placed or guidance taken from any portion of this presentation.