IAB Ireland Pwc 2016 Adspend Infographic
•
1 like•214 views

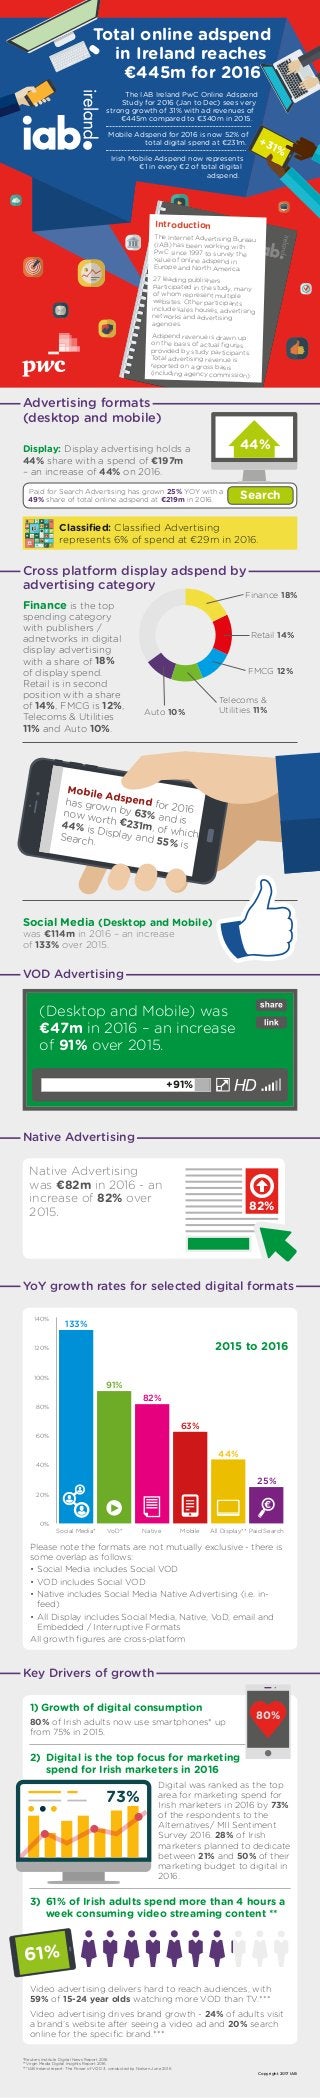
- Mobile Adspend for the year ended 2016 continues its upward trajectory - Total Digital Adspend is now at a record high of €445m, reflecting year-on-year growth of 31% for 2016, compared to 29% for 2015 - Mobile adspend reaches €231m for the year ended 2016, reflecting growth of 63% over 2015
Recommended

Recommended
More Related Content
More from IAB Europe
More from IAB Europe (20)
Recently uploaded
Recently uploaded (20)
IAB Ireland Pwc 2016 Adspend Infographic
- 1. +31% Total online adspend in Ireland reaches €445m for 2016 The IAB Ireland PwC Online Adspend Study for 2016 (Jan to Dec) sees very strong growth of 31% with ad revenues of €445m compared to €340m in 2015. Mobile Adspend for 2016 is now 52% of total digital spend at €231m. Irish Mobile Adspend now represents €1 in every €2 of total digital adspend. Introduction The Internet Advertising Bureau (IAB) has been working with PwC since 1997 to survey the value of online adspend in Europe and North America. 27 leading publishers participated in the study, many of whom represent multiple websites. Other participants include sales houses, advertising networks and advertising agencies. Adspend revenue is drawn up on the basis of actual figures provided by study participants. Total advertising revenue is reported on a gross basis (including agency commission). Advertising formats (desktop and mobile) Classified: Classified Advertising represents 6% of spend at €29m in 2016. Display: Display advertising holds a 44% share with a spend of €197m – an increase of 44% on 2016. Copyright 2017 IAB *Reuters Institute Digital News Report 2016 **Virgin Media Digital Insights Report 2016 ***IAB Ireland report: The Power of VOD 3, conducted by Nielsen June 2016 Paid for Search Advertising has grown 25% YOY with a 49% share of total online adspend at €219m in 2016. Search Native Advertising Native Advertising was €82m in 2016 - an increase of 82% over 2015. 82% +91% (Desktop and Mobile) was €47m in 2016 – an increase of 91% over 2015. Mobile Adspend for 2016 has grown by 63% and is now worth €231m, of which 44% is Display and 55% is Search. VOD Advertising Social Media (Desktop and Mobile) was €114m in 2016 – an increase of 133% over 2015. 44% Key Drivers of growth 1) Growth of digital consumption 80% of Irish adults now use smartphones* up from 75% in 2015. 2) Digital is the top focus for marketing spend for Irish marketers in 2016 Digital was ranked as the top area for marketing spend for Irish marketers in 2016 by 73% of the respondents to the Alternatives/ MII Sentiment Survey 2016. 28% of Irish marketers planned to dedicate between 21% and 50% of their marketing budget to digital in 2016. 3) 61% of Irish adults spend more than 4 hours a week consuming video streaming content ** Video advertising delivers hard to reach audiences, with 59% of 15-24 year olds watching more VOD than TV.*** Video advertising drives brand growth - 24% of adults visit a brand’s website after seeing a video ad and 20% search online for the specific brand.*** 80% 73% 61% YoY growth rates for selected digital formats Please note the formats are not mutually exclusive - there is some overlap as follows: • Social Media includes Social VOD • VOD includes Social VOD • Native includes Social Media Native Advertising (i.e. in- feed) • All Display includes Social Media, Native, VoD, email and Embedded / Interruptive Formats All growth figures are cross-platform 0% 20% 40% 60% 80% 100% 120% 140% Mobile 63% 82% Social Media* 133% VoD* Native 91% All Display** 44% Paid Search 25% 2015 to 2016 Cross platform display adspend by advertising category Finance 18% Retail 14% FMCG 12% Telecoms & Utilities 11%Auto 10% Finance is the top spending category with publishers / adnetworks in digital display advertising with a share of 18% of display spend. Retail is in second position with a share of 14%, FMCG is 12%, Telecoms & Utilities 11% and Auto 10%.