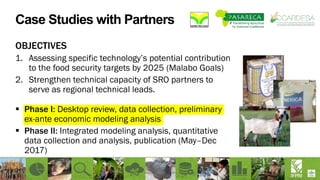
The document outlines a workshop focused on assessing the contribution of specific agricultural technologies to the Malabo food security targets by 2025 in Africa, detailing various case studies across different regions and commodities. It emphasizes the adoption levels, drivers, and impacts of technologies like NERICA rice in Senegal and QPM maize in Uganda, along with the methodologies for analysis and stakeholder engagement. The conclusions indicate that significant technology adoption could lead to improved food security and economic benefits for agricultural stakeholders.


![Approach and Methodology (2)
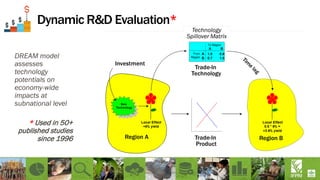
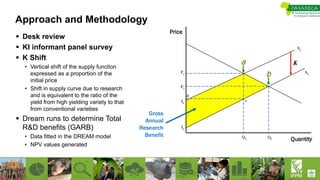
Total Benefits (B) computed from the following formula:
B= PQK (1 + K*0.5ED) (1- [(1-ED)2 ES/(ED-ES)]
Where B= Gross Annual Research Benefits (GARB); P= Price of the Product;
Q=Quantity of Product; K= Shift of the supply curve due to research; and ES and
ED are the supply and demand elasticities respectively
Kmax due to induced R&D effects is computed from the formula
Ki
Max = PiciAi
Max PPi,0 > 0
Where Pi= Probability of success which if the research is successful and the
products are fully adopted; will yield a cost saving per unit of output equal to ci
percent of the initial price PPi,0 in region i; while a ceiling adoption rate of Ai Max
percent holds in region i](https://image.slidesharecdn.com/ifpriandsros2017-workstream1-technologyplatformcasestudiesapril5r6-170427195202/85/Workstream-1-Technology-Platform-Case-Studies-26-320.jpg)